
Upcoming webinar on 'Inforiver Charts : The fastest way to deliver stories in Power BI', Aug 29th , Monday, 10.30 AM CST. Register Now
Upcoming webinar on 'Inforiver Charts : The fastest way to deliver stories in Power BI', Aug 29th , Monday, 10.30 AM CST. Register Now
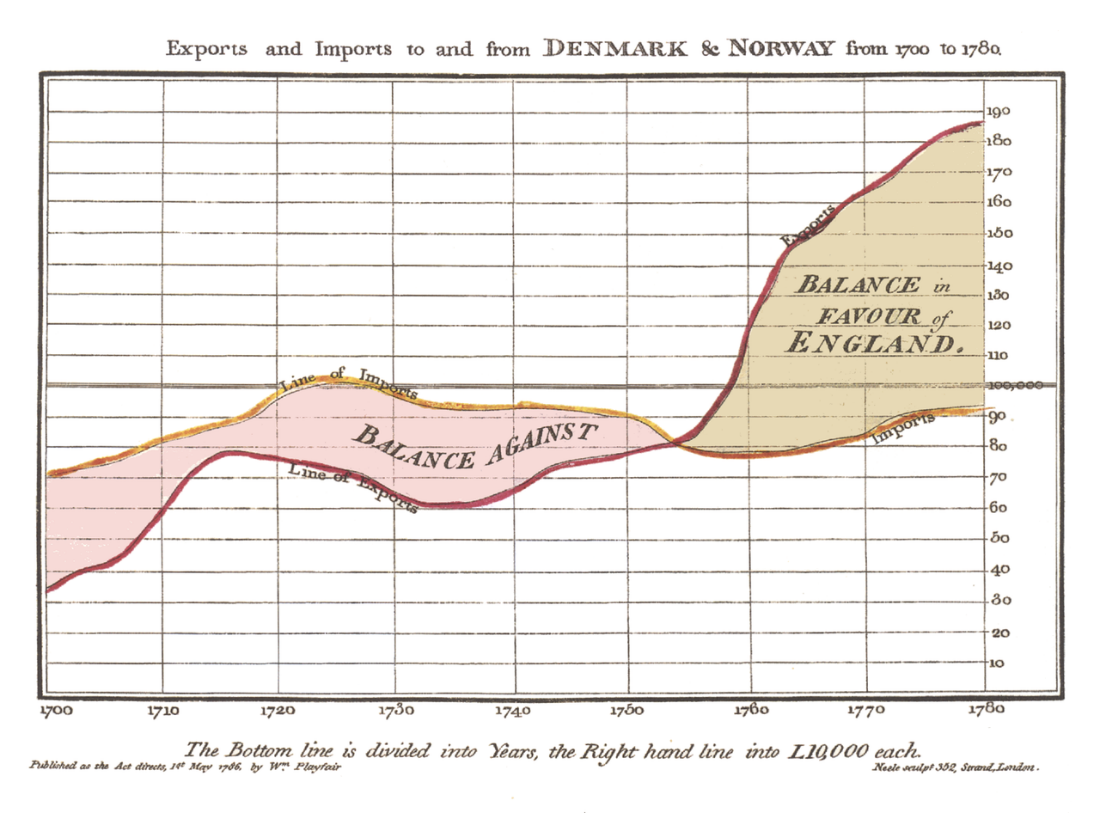
Line charts are among the most recognizable charts, with the first known one created in 1786 by William Playfair. They are simple enough to make even with pen and paper, but it is important to keep some guidelines in mind to create line charts that convey your story, while retaining accuracy and legibility.
Here are some dos and don’ts that you need to consider while building line charts.
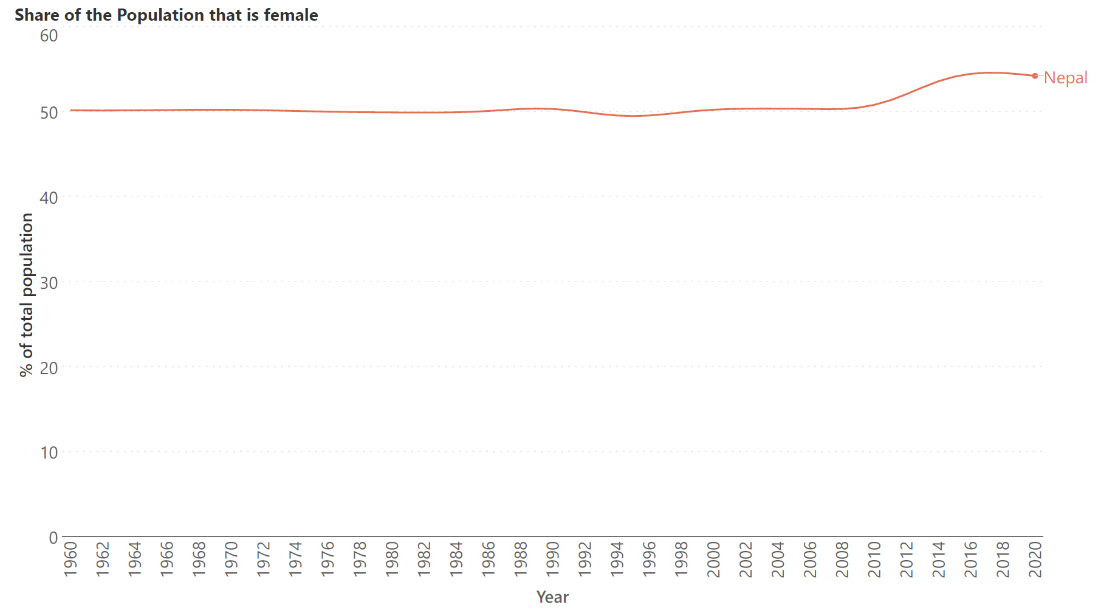
Charts that start the y-axis at any point other than zero are often criticized for misrepresentation, but in the case of line charts, there are two important questions to consider while deciding this. Does your data have a meaningful relationship to zero? What is the goal of your chart?
The two charts below show the trend in the percentage of the population that is female in Nepal. The first chart starts the y-axis at zero and we see a rather flat chart with barely any variation visible. Consider in this case what the goal of the chart is, and if the metric plotted bears a meaningful relationship to zero. For the first question, is the goal of the chart to show the troughs and peaks in the sex ratio over the years, clearly showcasing the climb in the proportion of the female population in the last decade? If yes, the chart below does a poor job of demonstrating these variations. For the latter question – consider that for most countries, the natural sex ratio at birth keeps values hovering around 50% in the overall population. In fact, if the proportion of the female population was to drop to 0% in a given country, it would mean that the country was populated entirely by men!
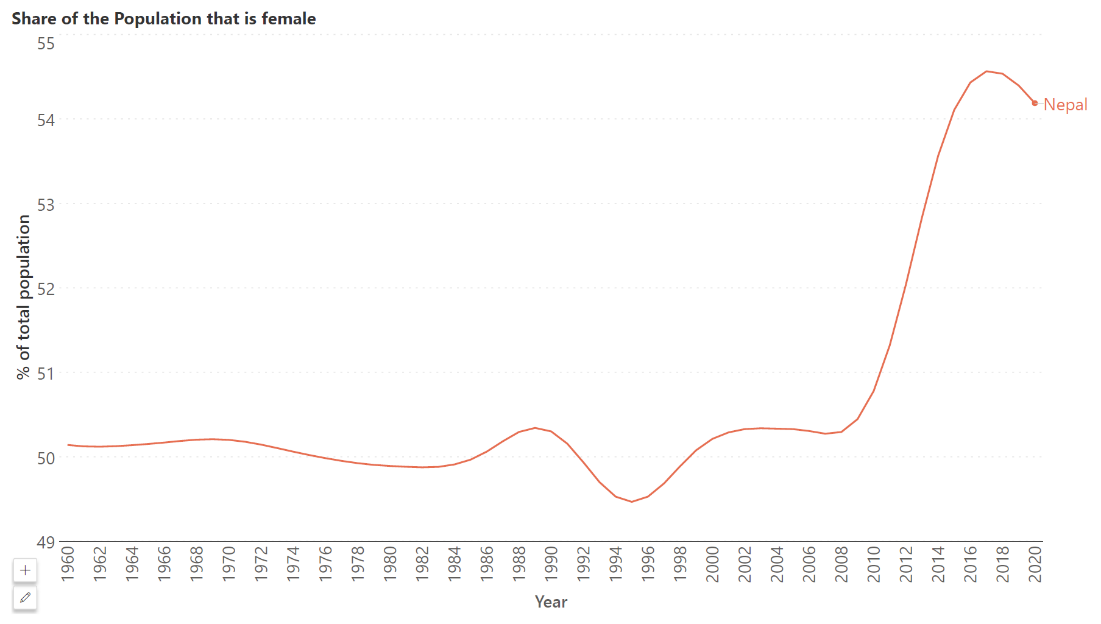
For these reasons, we may begin the axis at a point other than zero, as shown in the chart below. Notice how we clearly see the changing trend here.
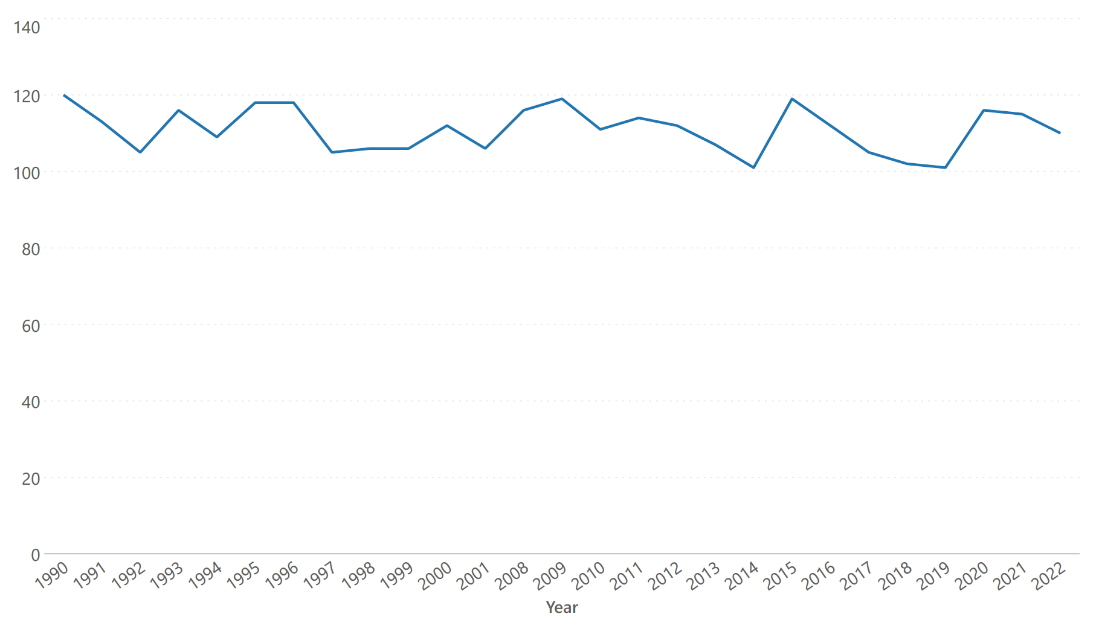
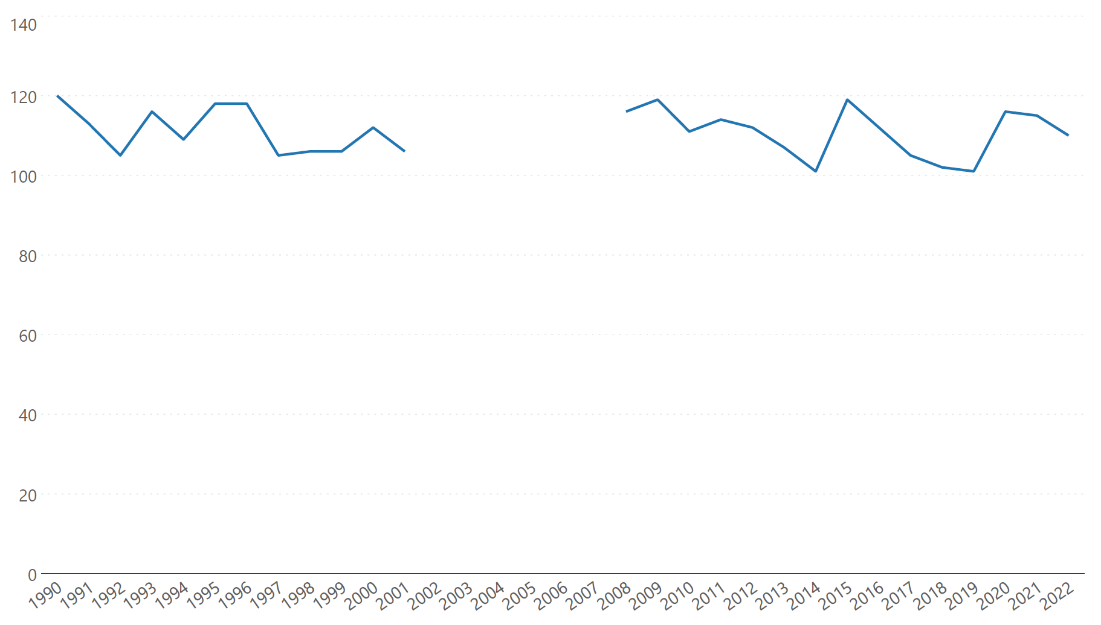
It is important to use visual cues to indicate areas in a line chart with missing data. Otherwise, we may have misrepresentations and wrong assumptions. Consider the following chart. At first glance, it appears to be a continuous curve through the entire period depicted. However, on closer inspection, we realize that there are missing values between 2002 and 2007.
In reality, the graph for the values that we have looks like this:
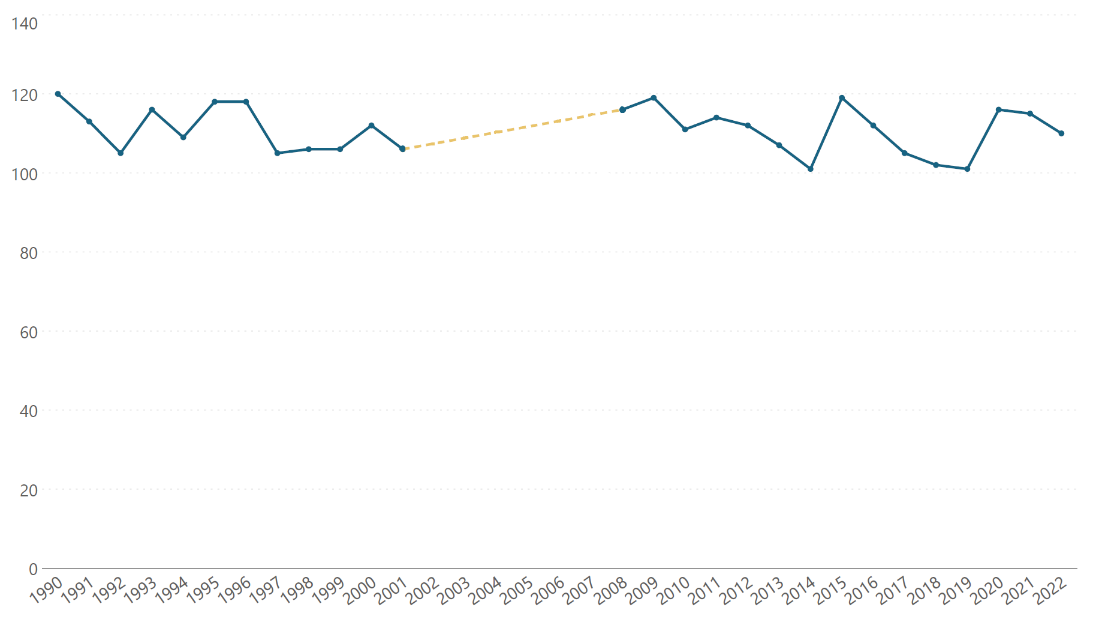
This depiction could also be a problem as our brains tend to assume that the missing values should connect across the gap in a straight line while something else may be happening, as in this chart below.
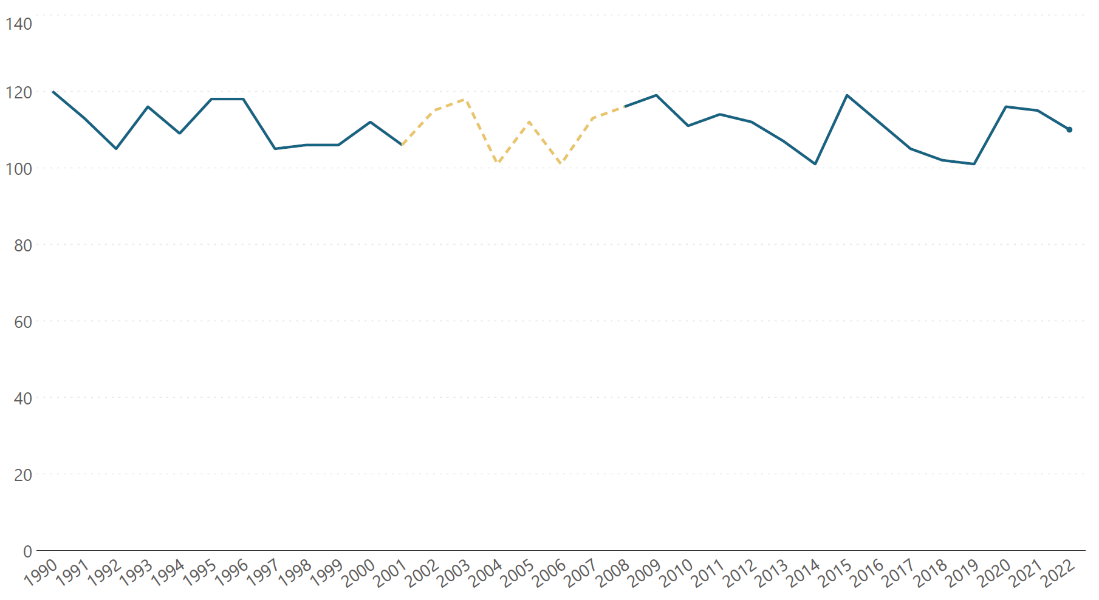
It is best to avoid confusion and wrong assumptions by using the following strategy. Use a dotted or a dashed line to indicate missing data, along with point markers to signal which points belong to the dataset. The data markers are especially important in the case of uneven date intervals, to allow readers to understand which dates have corresponding data points and how this influences the overall shape of the chart.
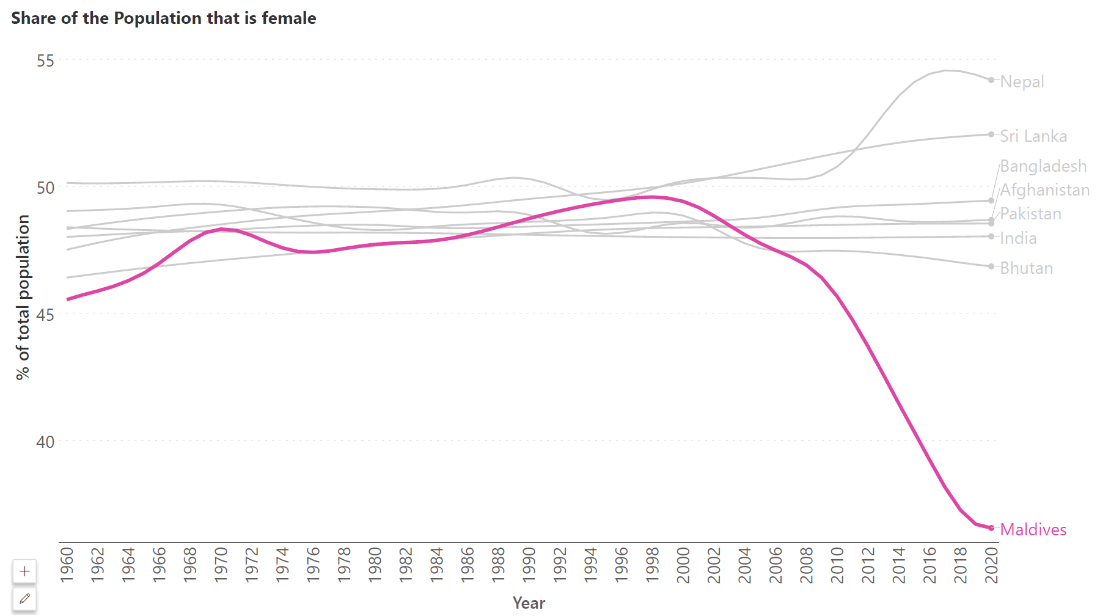
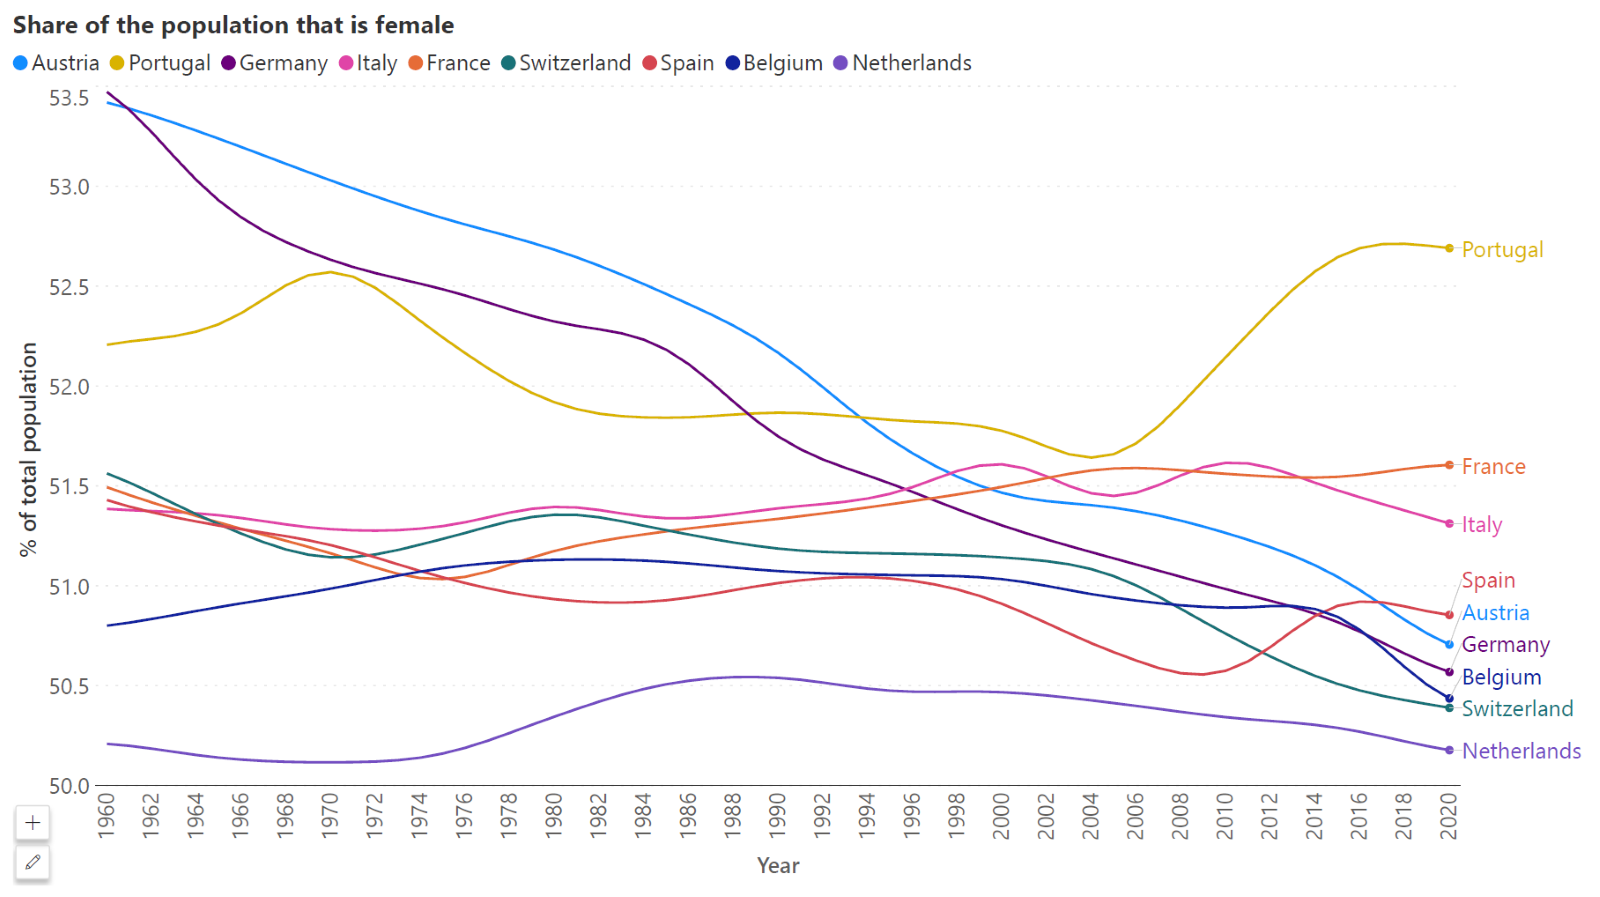
When too many series are plotted, a line chart can often fall into the “spaghetti on a plate” category with too many tangled lines that are difficult to parse through to gain any insight into the trends. Consider the chart below showing the trend in the share of the population that is female in South Asian countries. It is difficult to follow the variations in any one country because the lines are crowded together. The solutions here include either limiting the number of series plotted or drawing attention using color.
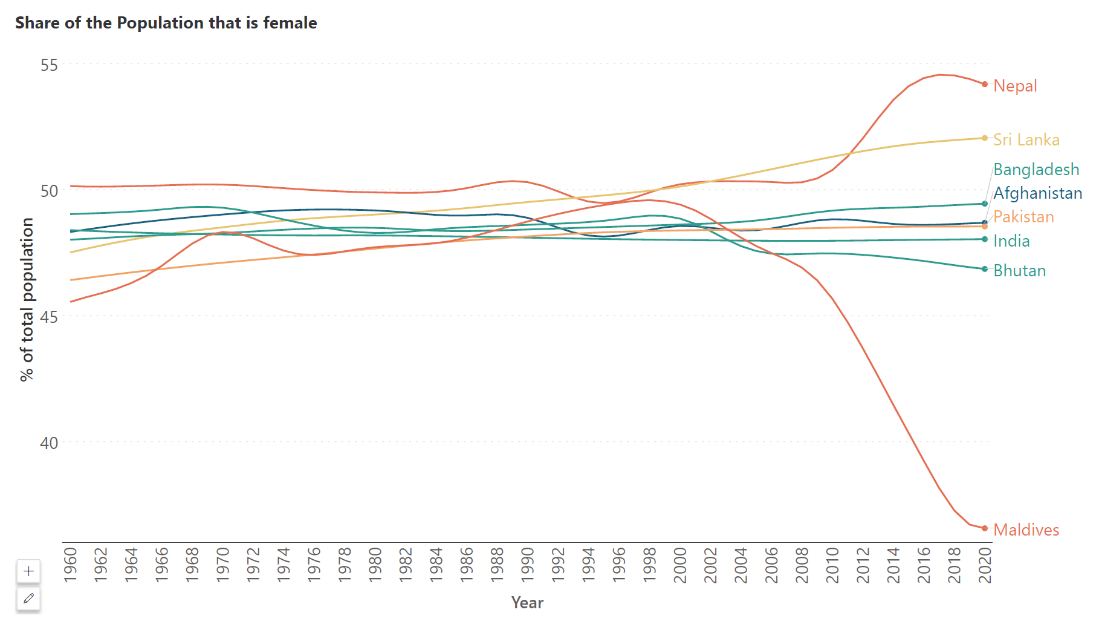
Let us say that we want to focus on the Maldives, where the influx of primarily male immigrant workers has skewed the sex ratio. We may highlight this country by using a thicker line width along with a bright color against grey for all the other countries, as seen in the chart below. By doing this, we can still compare the Maldives against other South Asian countries to see how it deviates from the trend, while also noticing the changes in this country, including the dip in the curve over the last two decades.
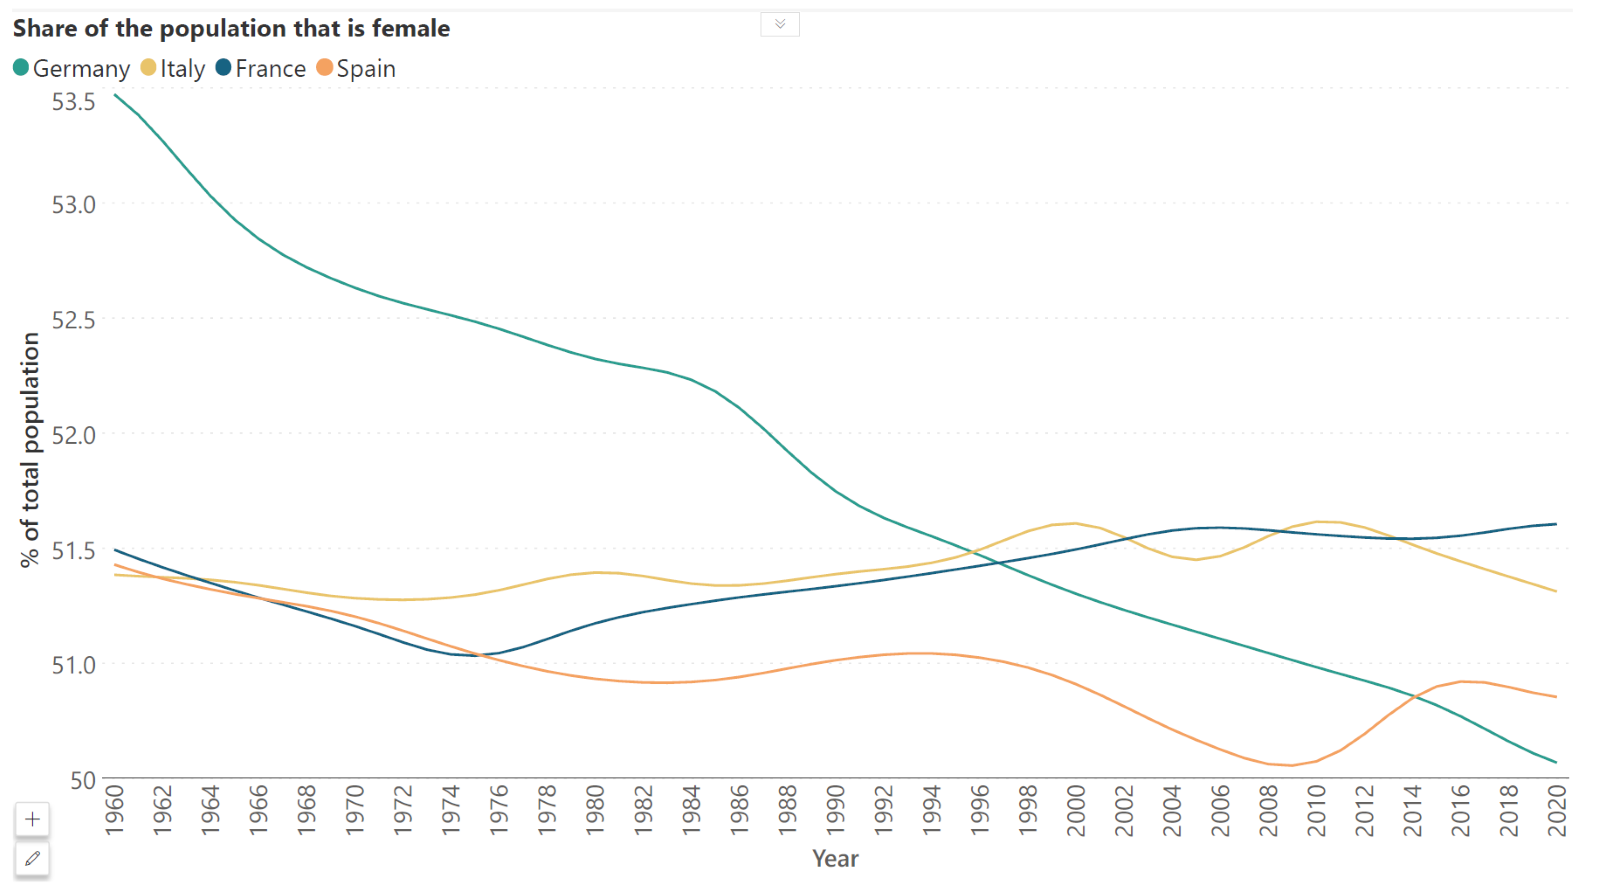
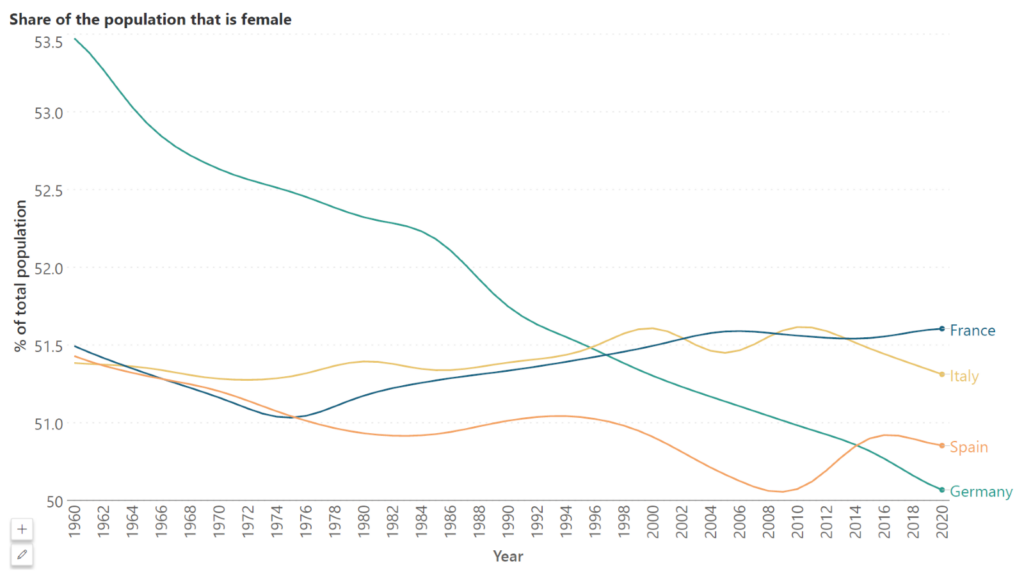
For line charts, it is better to label data series directly in line with the last point, instead of using a legend. This ensures that the reader’s eye does not have to constantly move back and forth between the legend and the curves to understand the chart, as in the first chart below. The legend can cause additional confusion when the order of the series in the legend differs from the chart. Consider using data driven labels which use the same color as the series, with the label placed next to the last point, as seen in the second chart.
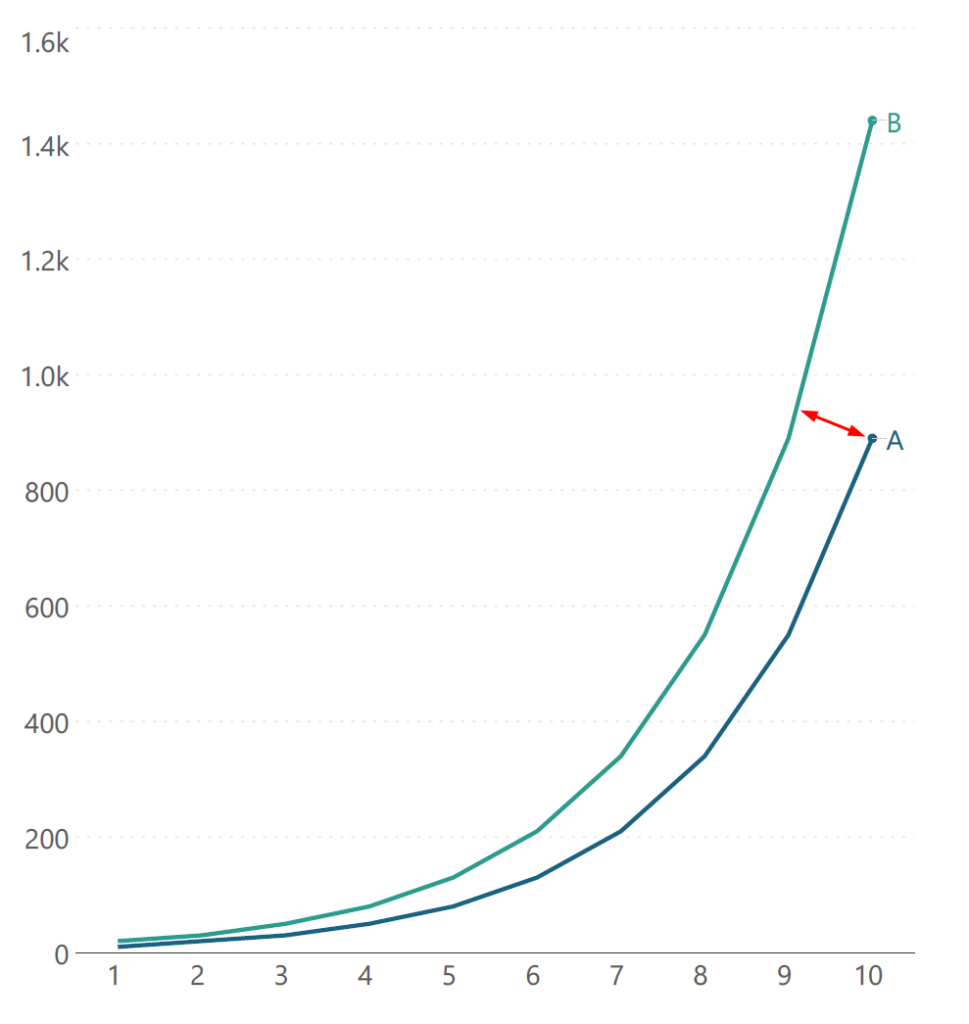
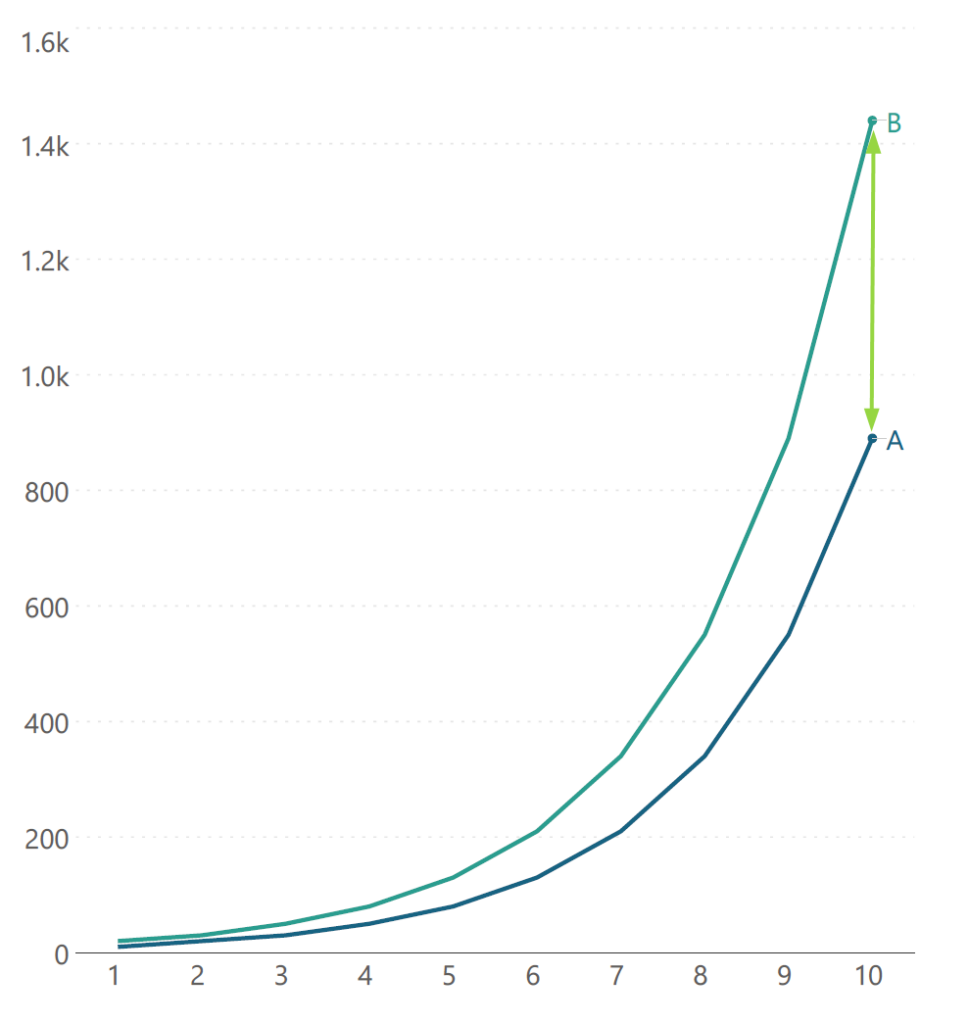
Line charts are prone to the line width illusion where our brains tend to wrongly evaluate the distance between two lines at the shortest distance between them instead of using the vertical distance. This can be an important consideration when comparing two curves. For example, we tend to evaluate the distance between A and B as in the chart on the left, using the shortest distance between the curves. However, the value that we plot corresponds to the position of the point which means that the difference is actually calculated using the vertical distance between the curves, as shown in the chart on the right. The difference between the two calculations can be considerable!
The solution to this issue is to directly plot the difference between the curves in cases where this is an important metric to track.
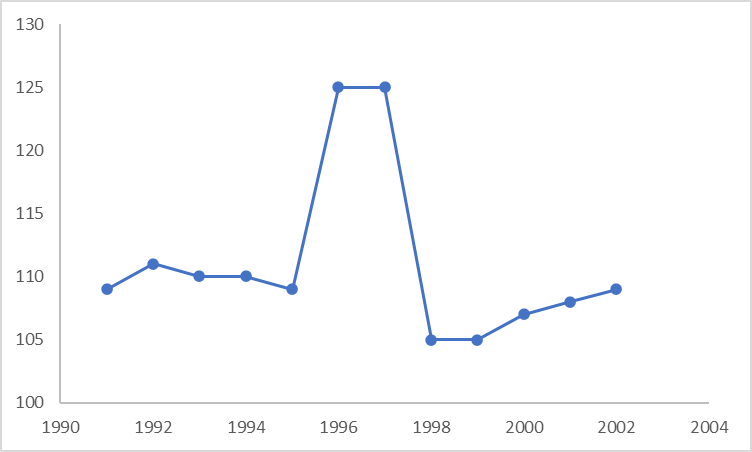
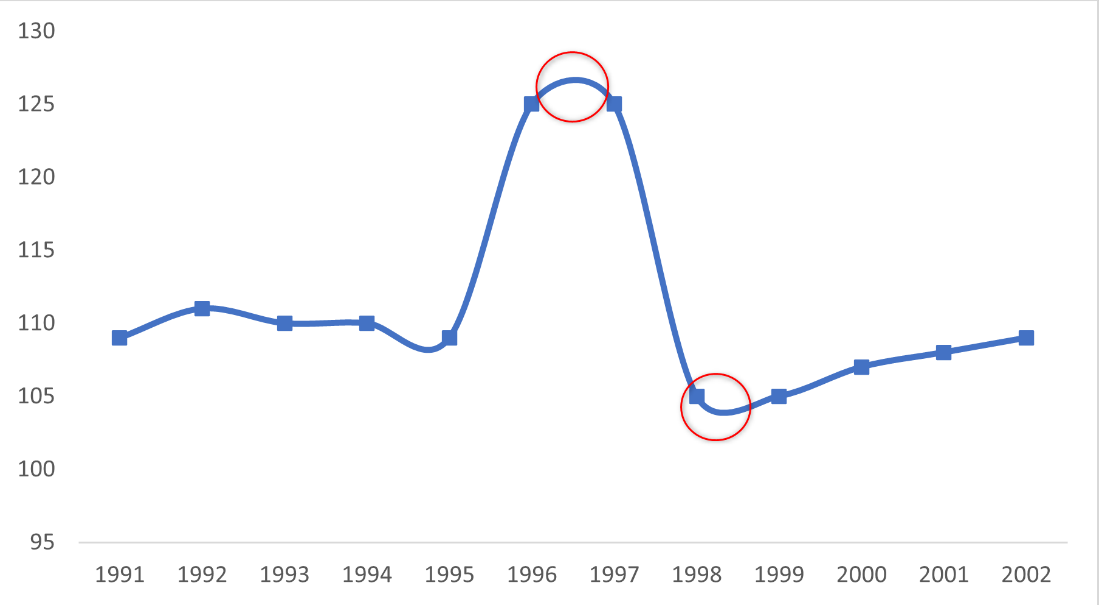
Avoid smoothening the curve or interpolating a curve between data points. We can use the example below to understand the problems with this. The first chart below shows a line chart without smoothening, while the second shows the same points with a smooth curve interpolated, with markers indicating the position of the points. Consider the errors in the smoothed chart indicated by the red circles – the curve sometimes shows a minimum that is lower than the minimum data point, or a maximum that is higher than the largest local value! This is not an accurate representation of the data as we have no way of knowing whether it is indeed what happens. The first chart, with straight lines connecting data points is a better choice.
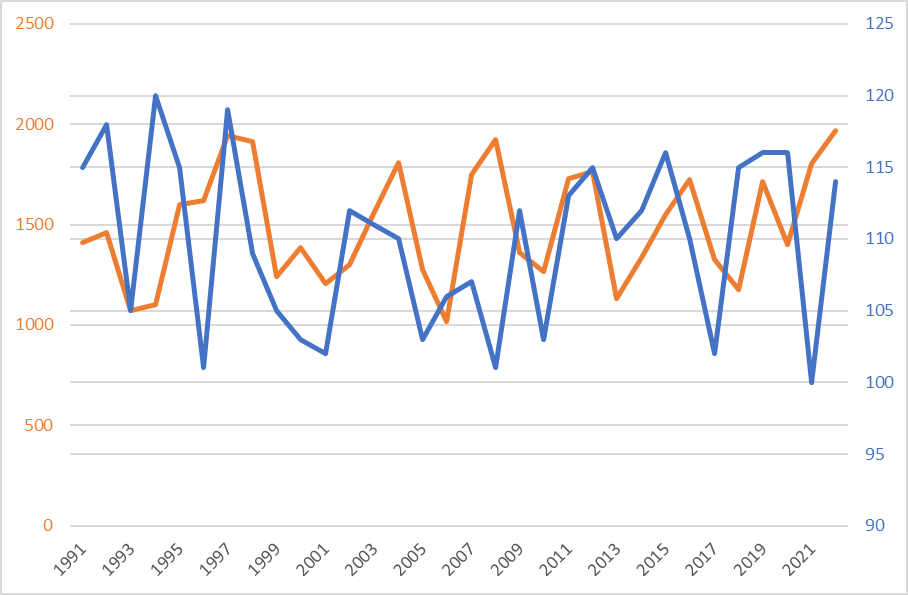
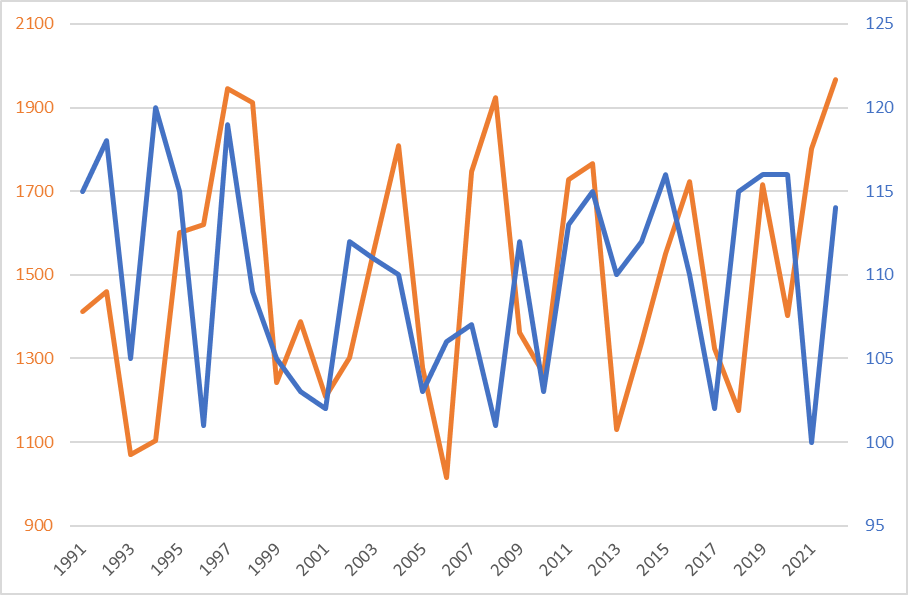
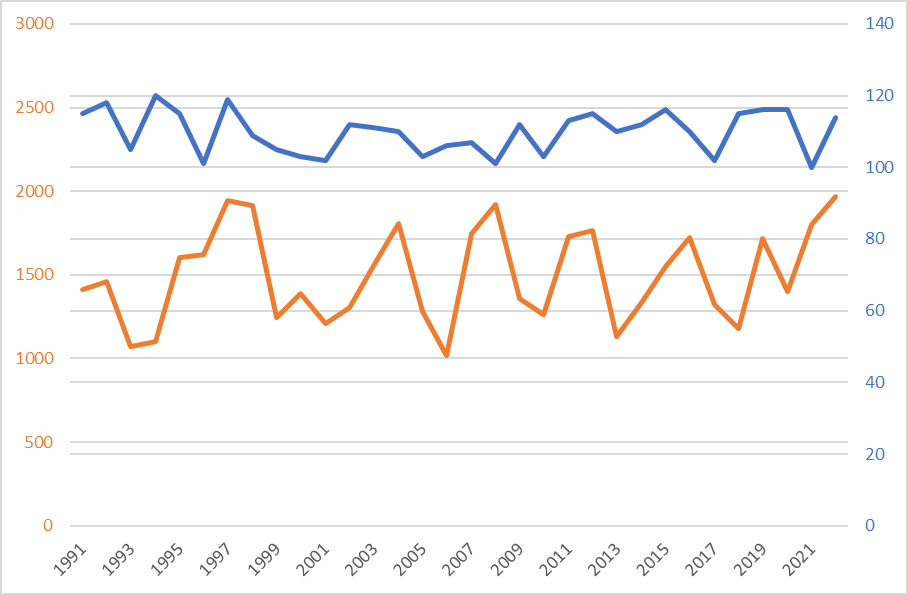
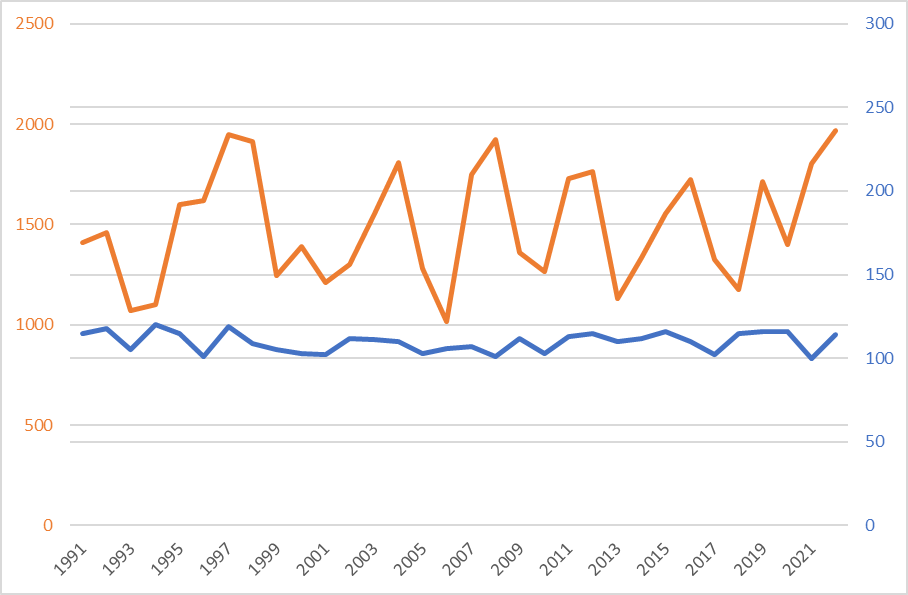
Consider the four line charts below. All four visualize the same two curves in a dual axis line chart, with the only difference being the scaling and starting point of the secondary y-axis. This provides a good illustration of the many reasons to avoid dual axis line charts. For one, the intersection point between the curves has no meaning, even though your audience may intuitively assume that it does. As illustrated by these charts, the intersection points can move depending on the scaling and starting point of the two axes. Secondly, the gridlines for each curve may not match with each other, leading to a messy and crowded chart. All of this makes the chart extremely difficult to read and understand. Consider placing each series in its own chart to avoid confusion.
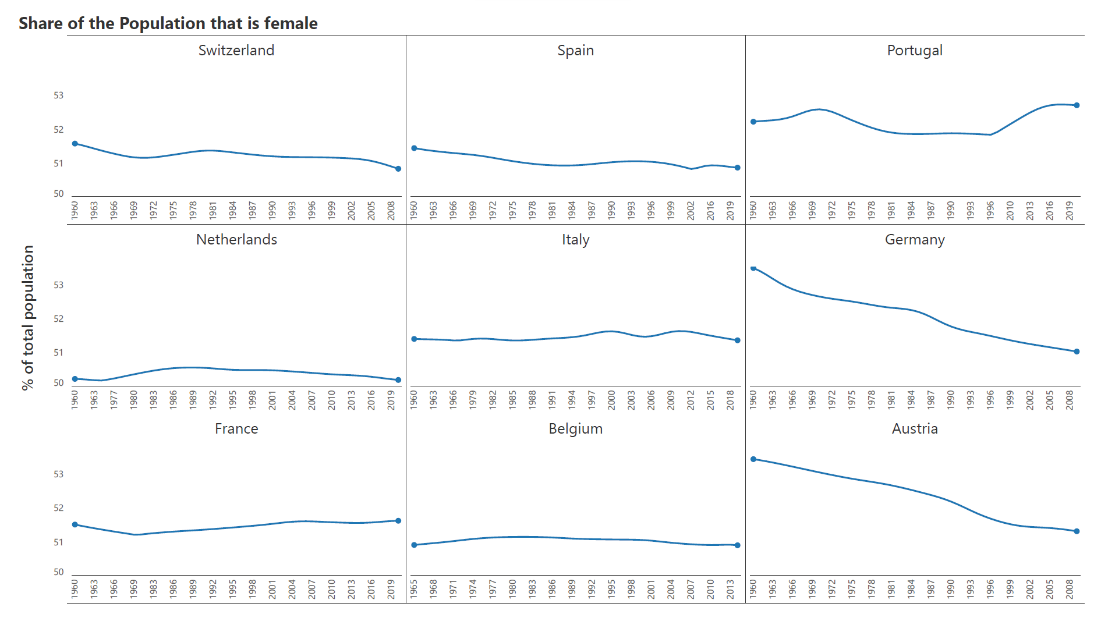
Line charts can handle several series at a time, but it is important to avoid the “spaghetti on a plate” chart described above – a crowded, tangled chart that has the appearance of spaghetti noodles thrown on a plate without clarity or focus, as in the first chart below. Add focus using highlight colors as described above or try small multiple charts instead as in the second image below. This brings clarity to the trends in each of the series, allows us to compare across variables, and present a lot of information in a relatively small area. Though we may lose some information on the relative value of the series, using small multiples means that the reader only needs to understand one chart in order to understand all charts.
Learn How Inforiver Solves Charting Limitations
- By Hamsini Sukumar
Line charts vs. Area charts: A comparison

Inforiver helps enterprises consolidate planning, reporting & analytics on a single platform (Power BI). The no-code, self-service award-winning platform has been recognized as the industry’s best and is adopted by many Fortune 100 firms.
Inforiver is a product of Lumel, the #1 Power BI AppSource Partner. The firm serves over 3,000 customers worldwide through its portfolio of products offered under the brands Inforiver, EDITable, ValQ, and xViz.