Upcoming webinar on 'Inforiver Charts : The fastest way to deliver stories in Power BI', Aug 29th , Monday, 10.30 AM CST. Register Now
Upcoming webinar on 'Inforiver Charts : The fastest way to deliver stories in Power BI', Aug 29th , Monday, 10.30 AM CST. Register Now
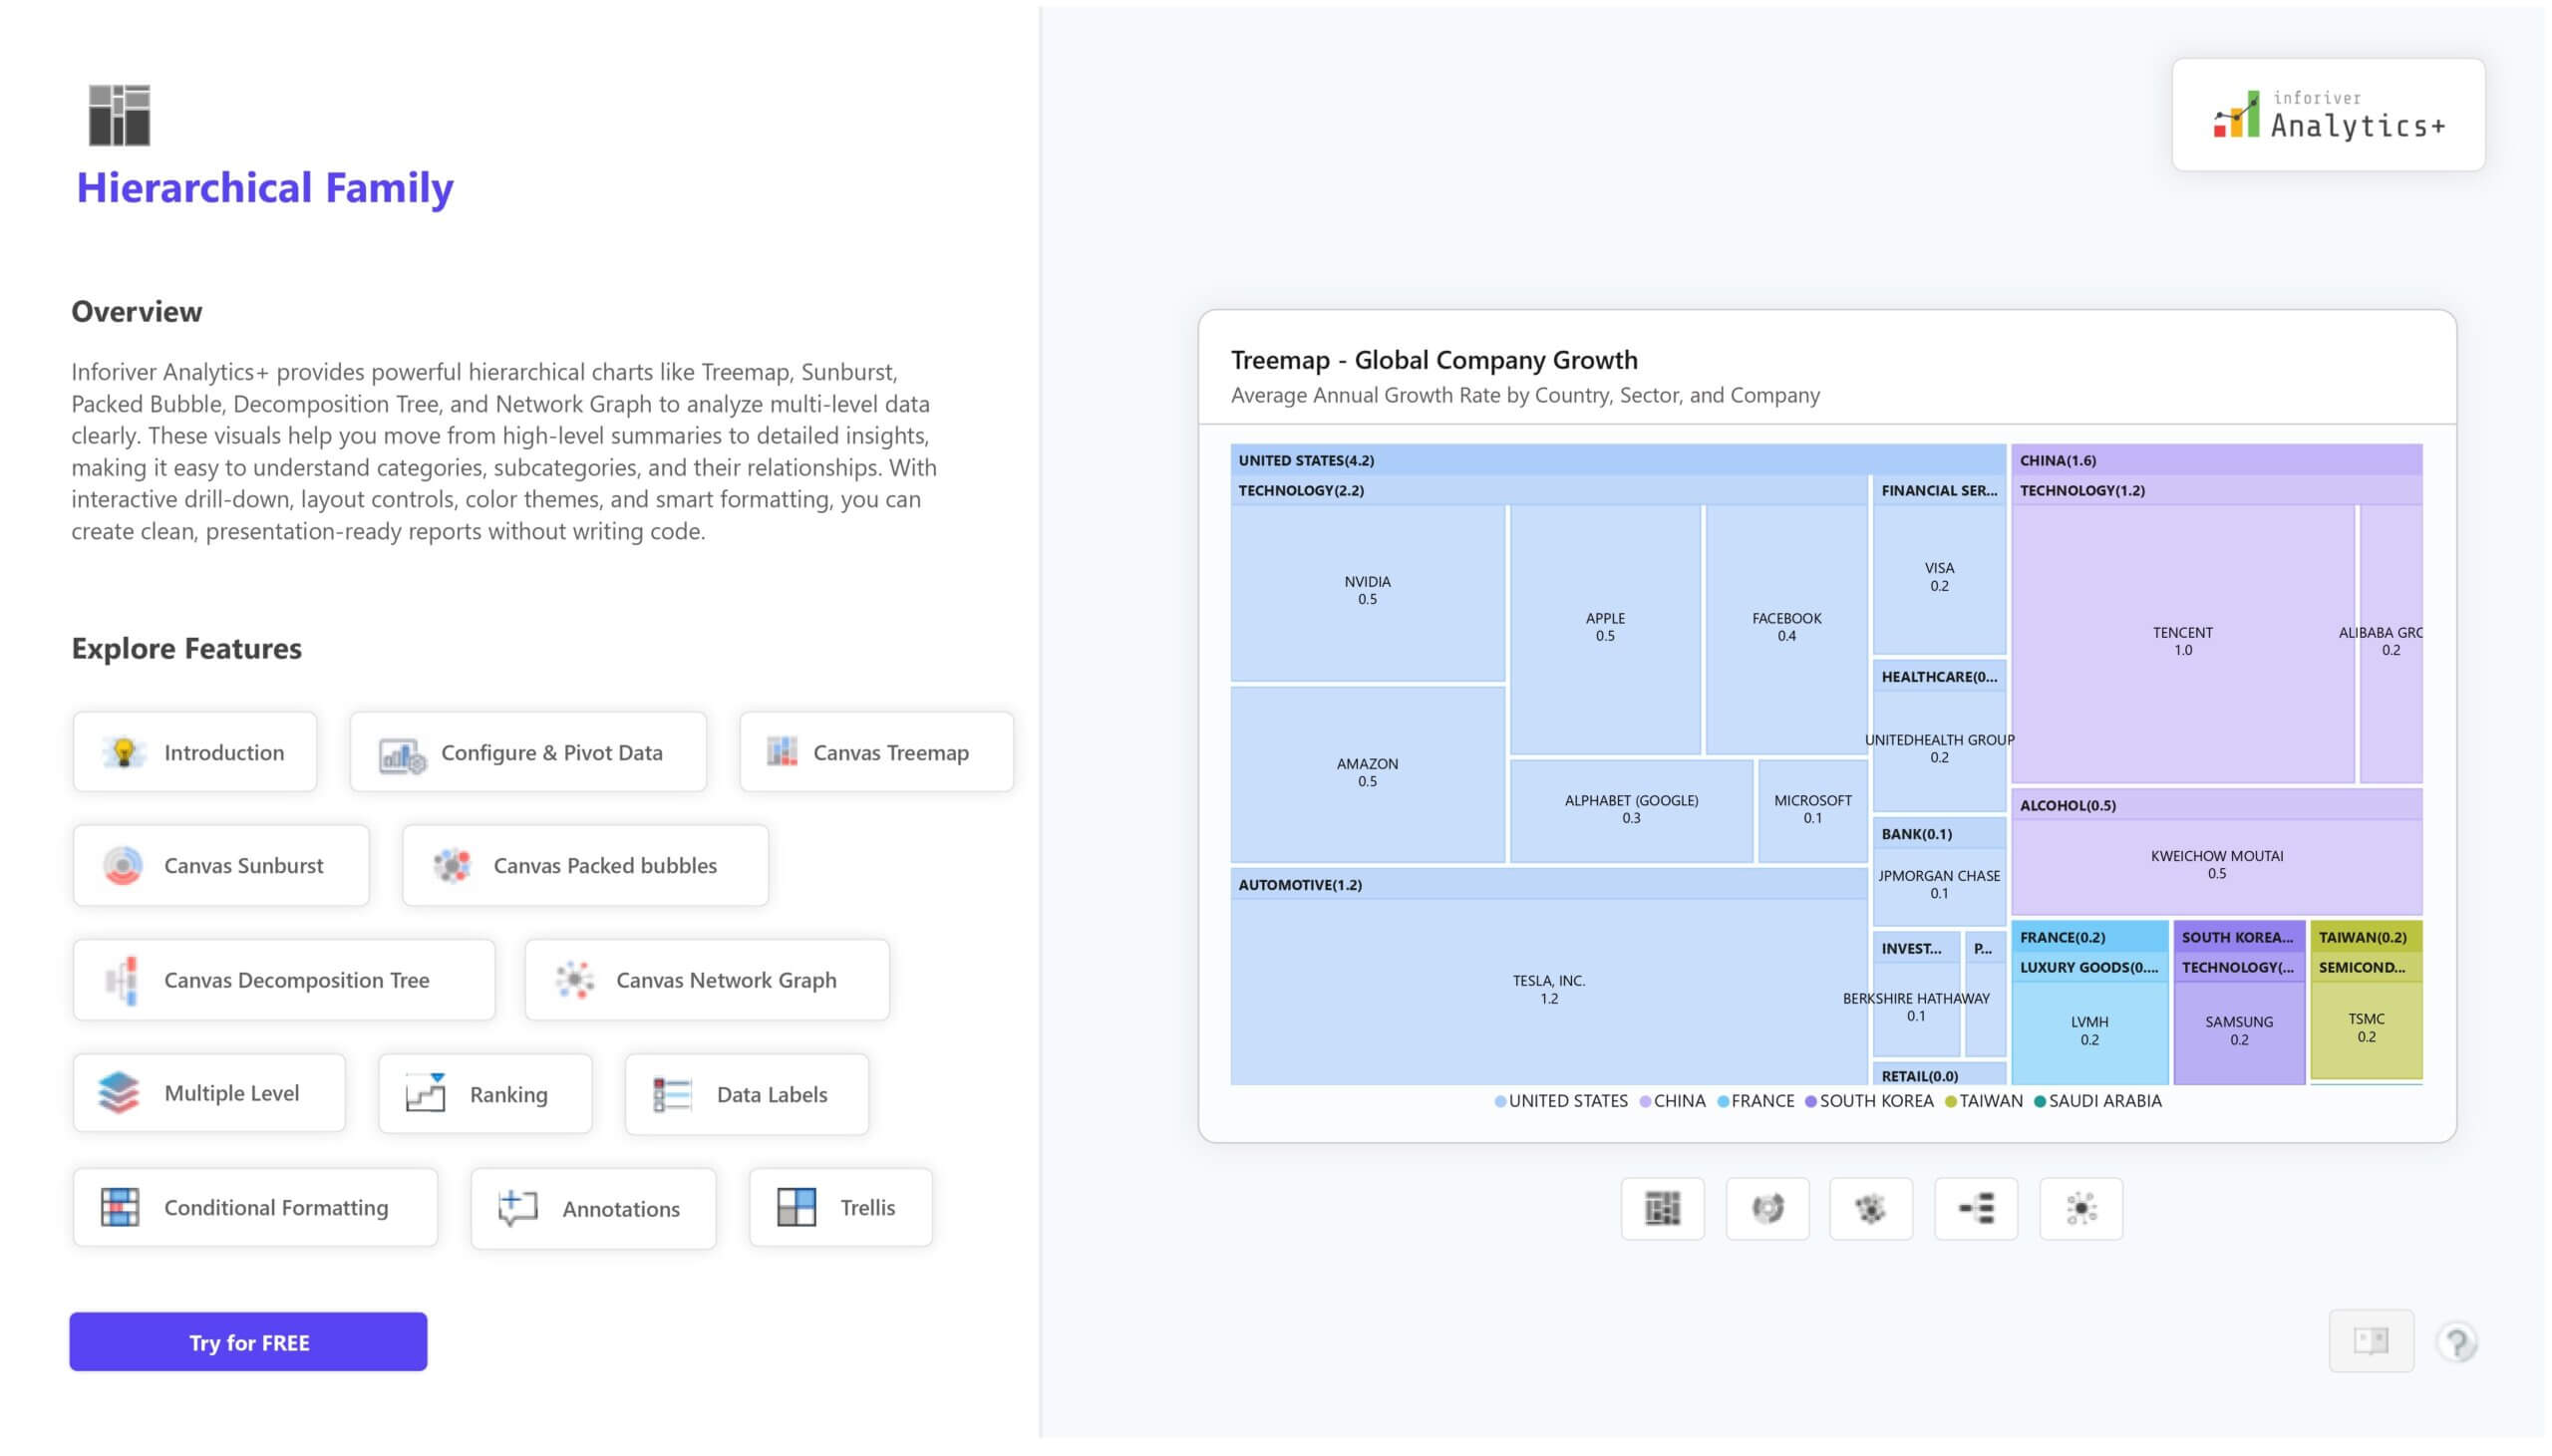
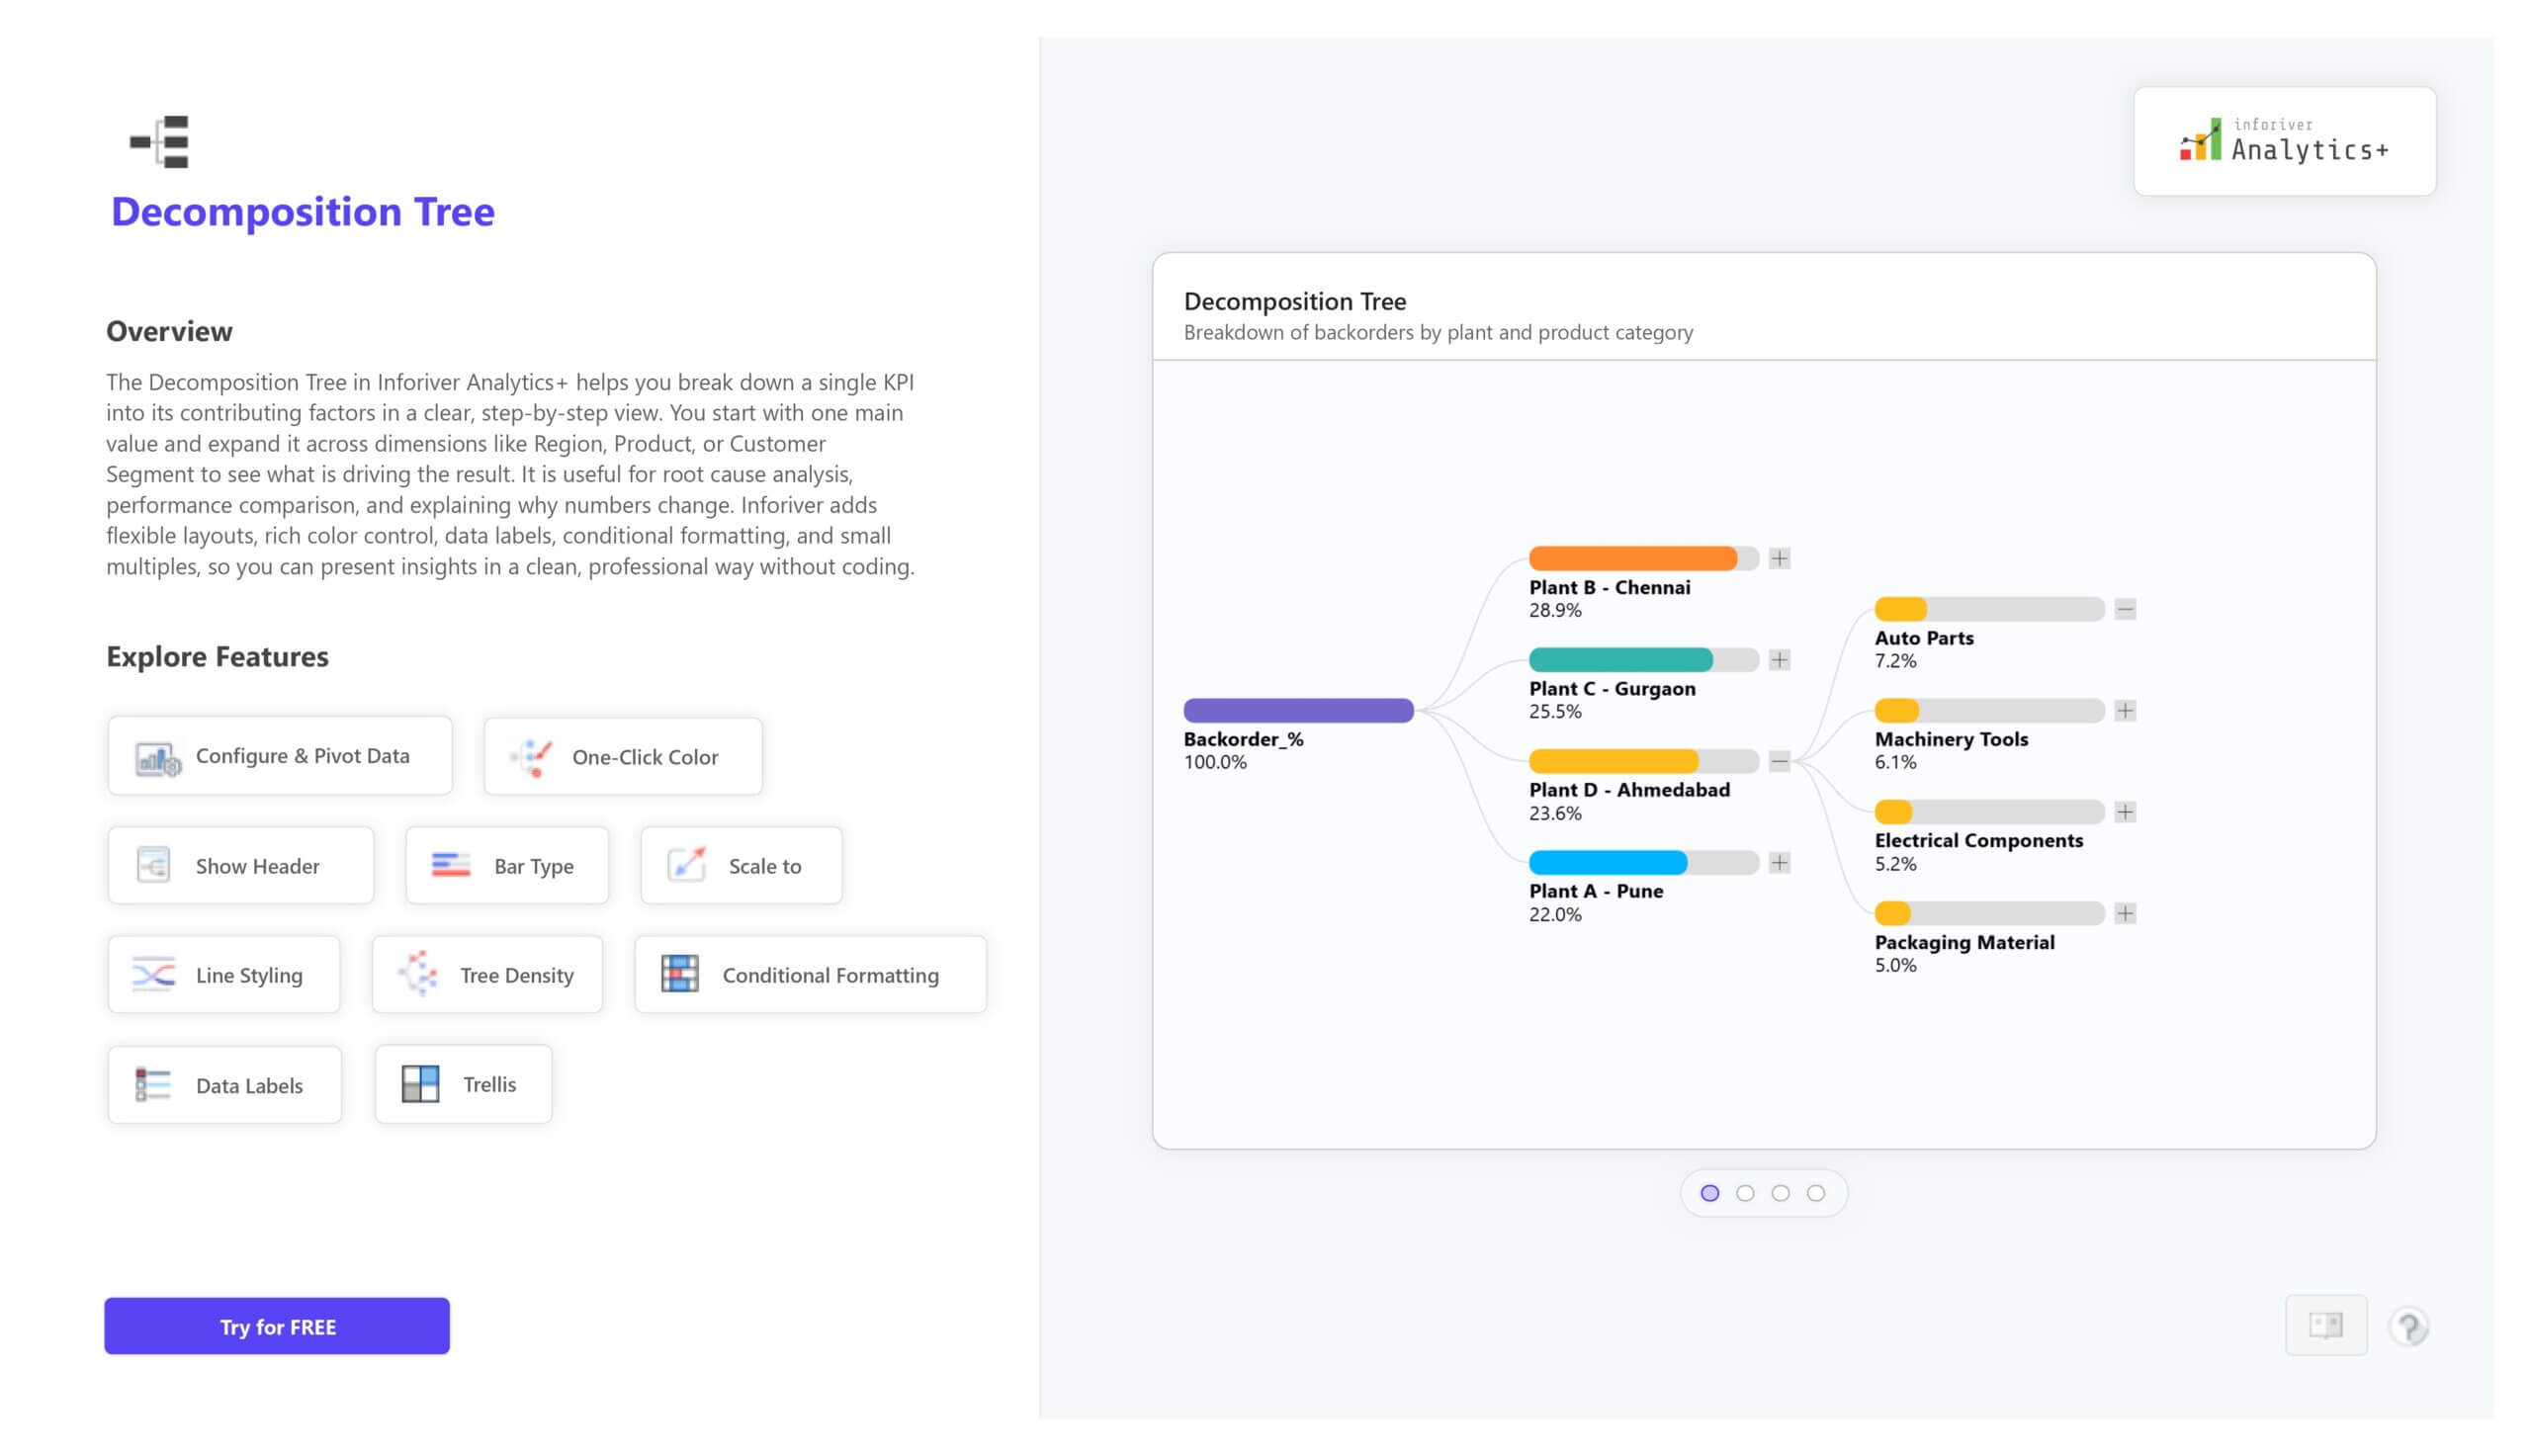
The Network Graph in Inforiver Analytics+ helps you visualize relationships between entities using a clear node and link structure. It’s perfect for analyzing connections in social networks, workflows, supply chains, or IT systems.
You can define source and target nodes, customize layouts (hierarchical, circular, or force-directed), and style links by color, shape, or thickness. Features like conditional formatting, data labels, and dynamic link weighting make complex relationships easy to explore and understand.
For complete details, demos, and pricing, visit: Explore the Network Graph on Inforiver Analytics+

to try advance features
[demo_download_modal title="Network Graph in Power BI" link="https://inforiver.com/wp-content/uploads/network-graph-in-analytics-plus-demo.zip"]
Inforiver helps enterprises consolidate planning, reporting & analytics on a single platform (Power BI). The no-code, self-service award-winning platform has been recognized as the industry’s best and is adopted by many Fortune 100 firms.
Inforiver is a product of Lumel, the #1 Power BI AppSource Partner. The firm serves over 3,000 customers worldwide through its portfolio of products offered under the brands Inforiver, EDITable, ValQ, and xViz.