
Upcoming webinar on 'Inforiver Charts : The fastest way to deliver stories in Power BI', Aug 29th , Monday, 10.30 AM CST. Register Now
Upcoming webinar on 'Inforiver Charts : The fastest way to deliver stories in Power BI', Aug 29th , Monday, 10.30 AM CST. Register Now
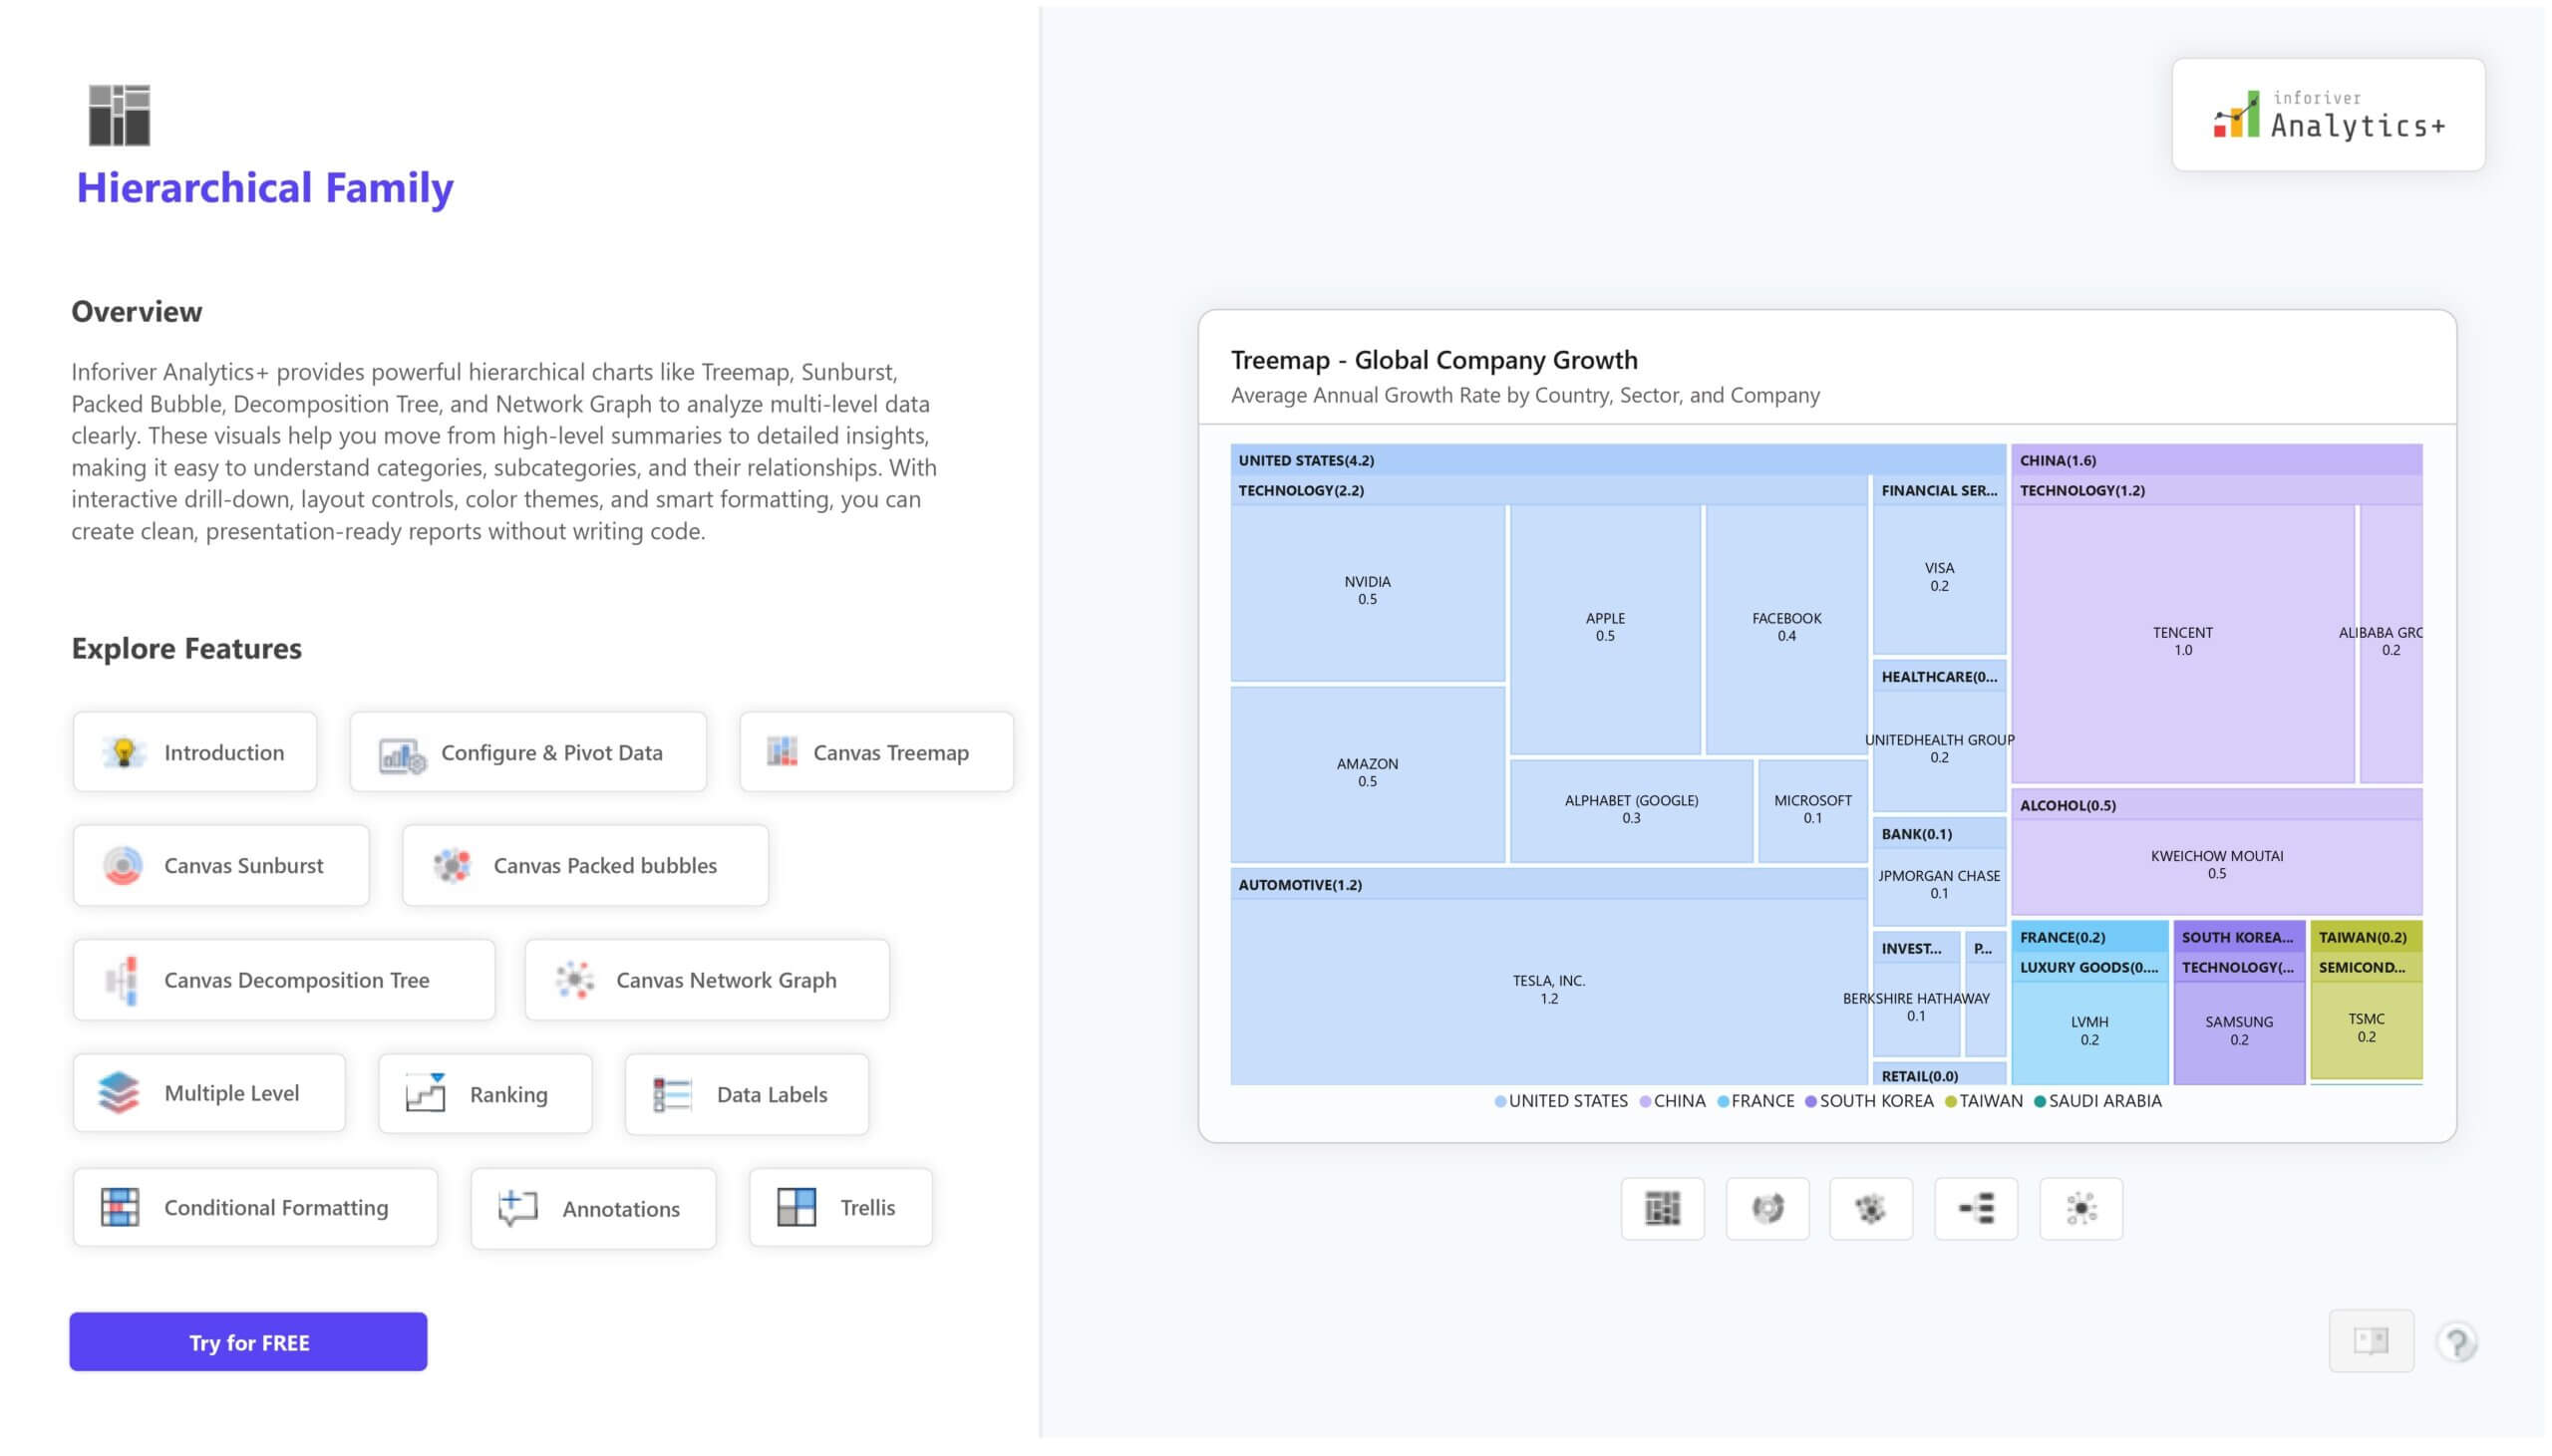
The Hierarchy Chart Family in Inforiver Analytics+ gives you a complete set of visuals to analyze multi level data with clarity. This family includes Treemap, Sunburst, Packed Bubble, Decomposition Tree, and Network Graph, helping you move smoothly from high level summary to deep detailed insight. You can understand parent child relationships, categories, subcategories, flows, and contributors in a single interactive reporting experience.
These Power BI hierarchical charts support drill down, small multiples, ranking, annotations, conditional formatting. You can fully control layout, spacing, labeling, color themes, opacity, and node formatting, so your reports stay clean, readable, and presentation ready without writing code.
The Hierarchical Family is ideal for sales analysis, market share analysis, product hierarchy, organization structures, customer segmentation, and root cause analysis. It brings flexibility and powerful storytelling inside Power BI using the Inforiver Analytics+ visual suite.
For complete feature details, demo visuals, and pricing information, visit: https://inforiver.com/analytics-plus/hierarchy/
to try advance features
[demo_download_modal title="Hierarchy Chart Family in Power BI" link="https://inforiver.com/wp-content/uploads/hierarchical-family-charts-in-analytic-plus-demo.zip"]
Inforiver helps enterprises consolidate planning, reporting & analytics on a single platform (Power BI). The no-code, self-service award-winning platform has been recognized as the industry’s best and is adopted by many Fortune 100 firms.
Inforiver is a product of Lumel, the #1 Power BI AppSource Partner. The firm serves over 3,000 customers worldwide through its portfolio of products offered under the brands Inforiver, EDITable, ValQ, and xViz.


