Upcoming webinar on 'Inforiver Charts : The fastest way to deliver stories in Power BI', Aug 29th , Monday, 10.30 AM CST. Register Now
Upcoming webinar on 'Inforiver Charts : The fastest way to deliver stories in Power BI', Aug 29th , Monday, 10.30 AM CST. Register Now
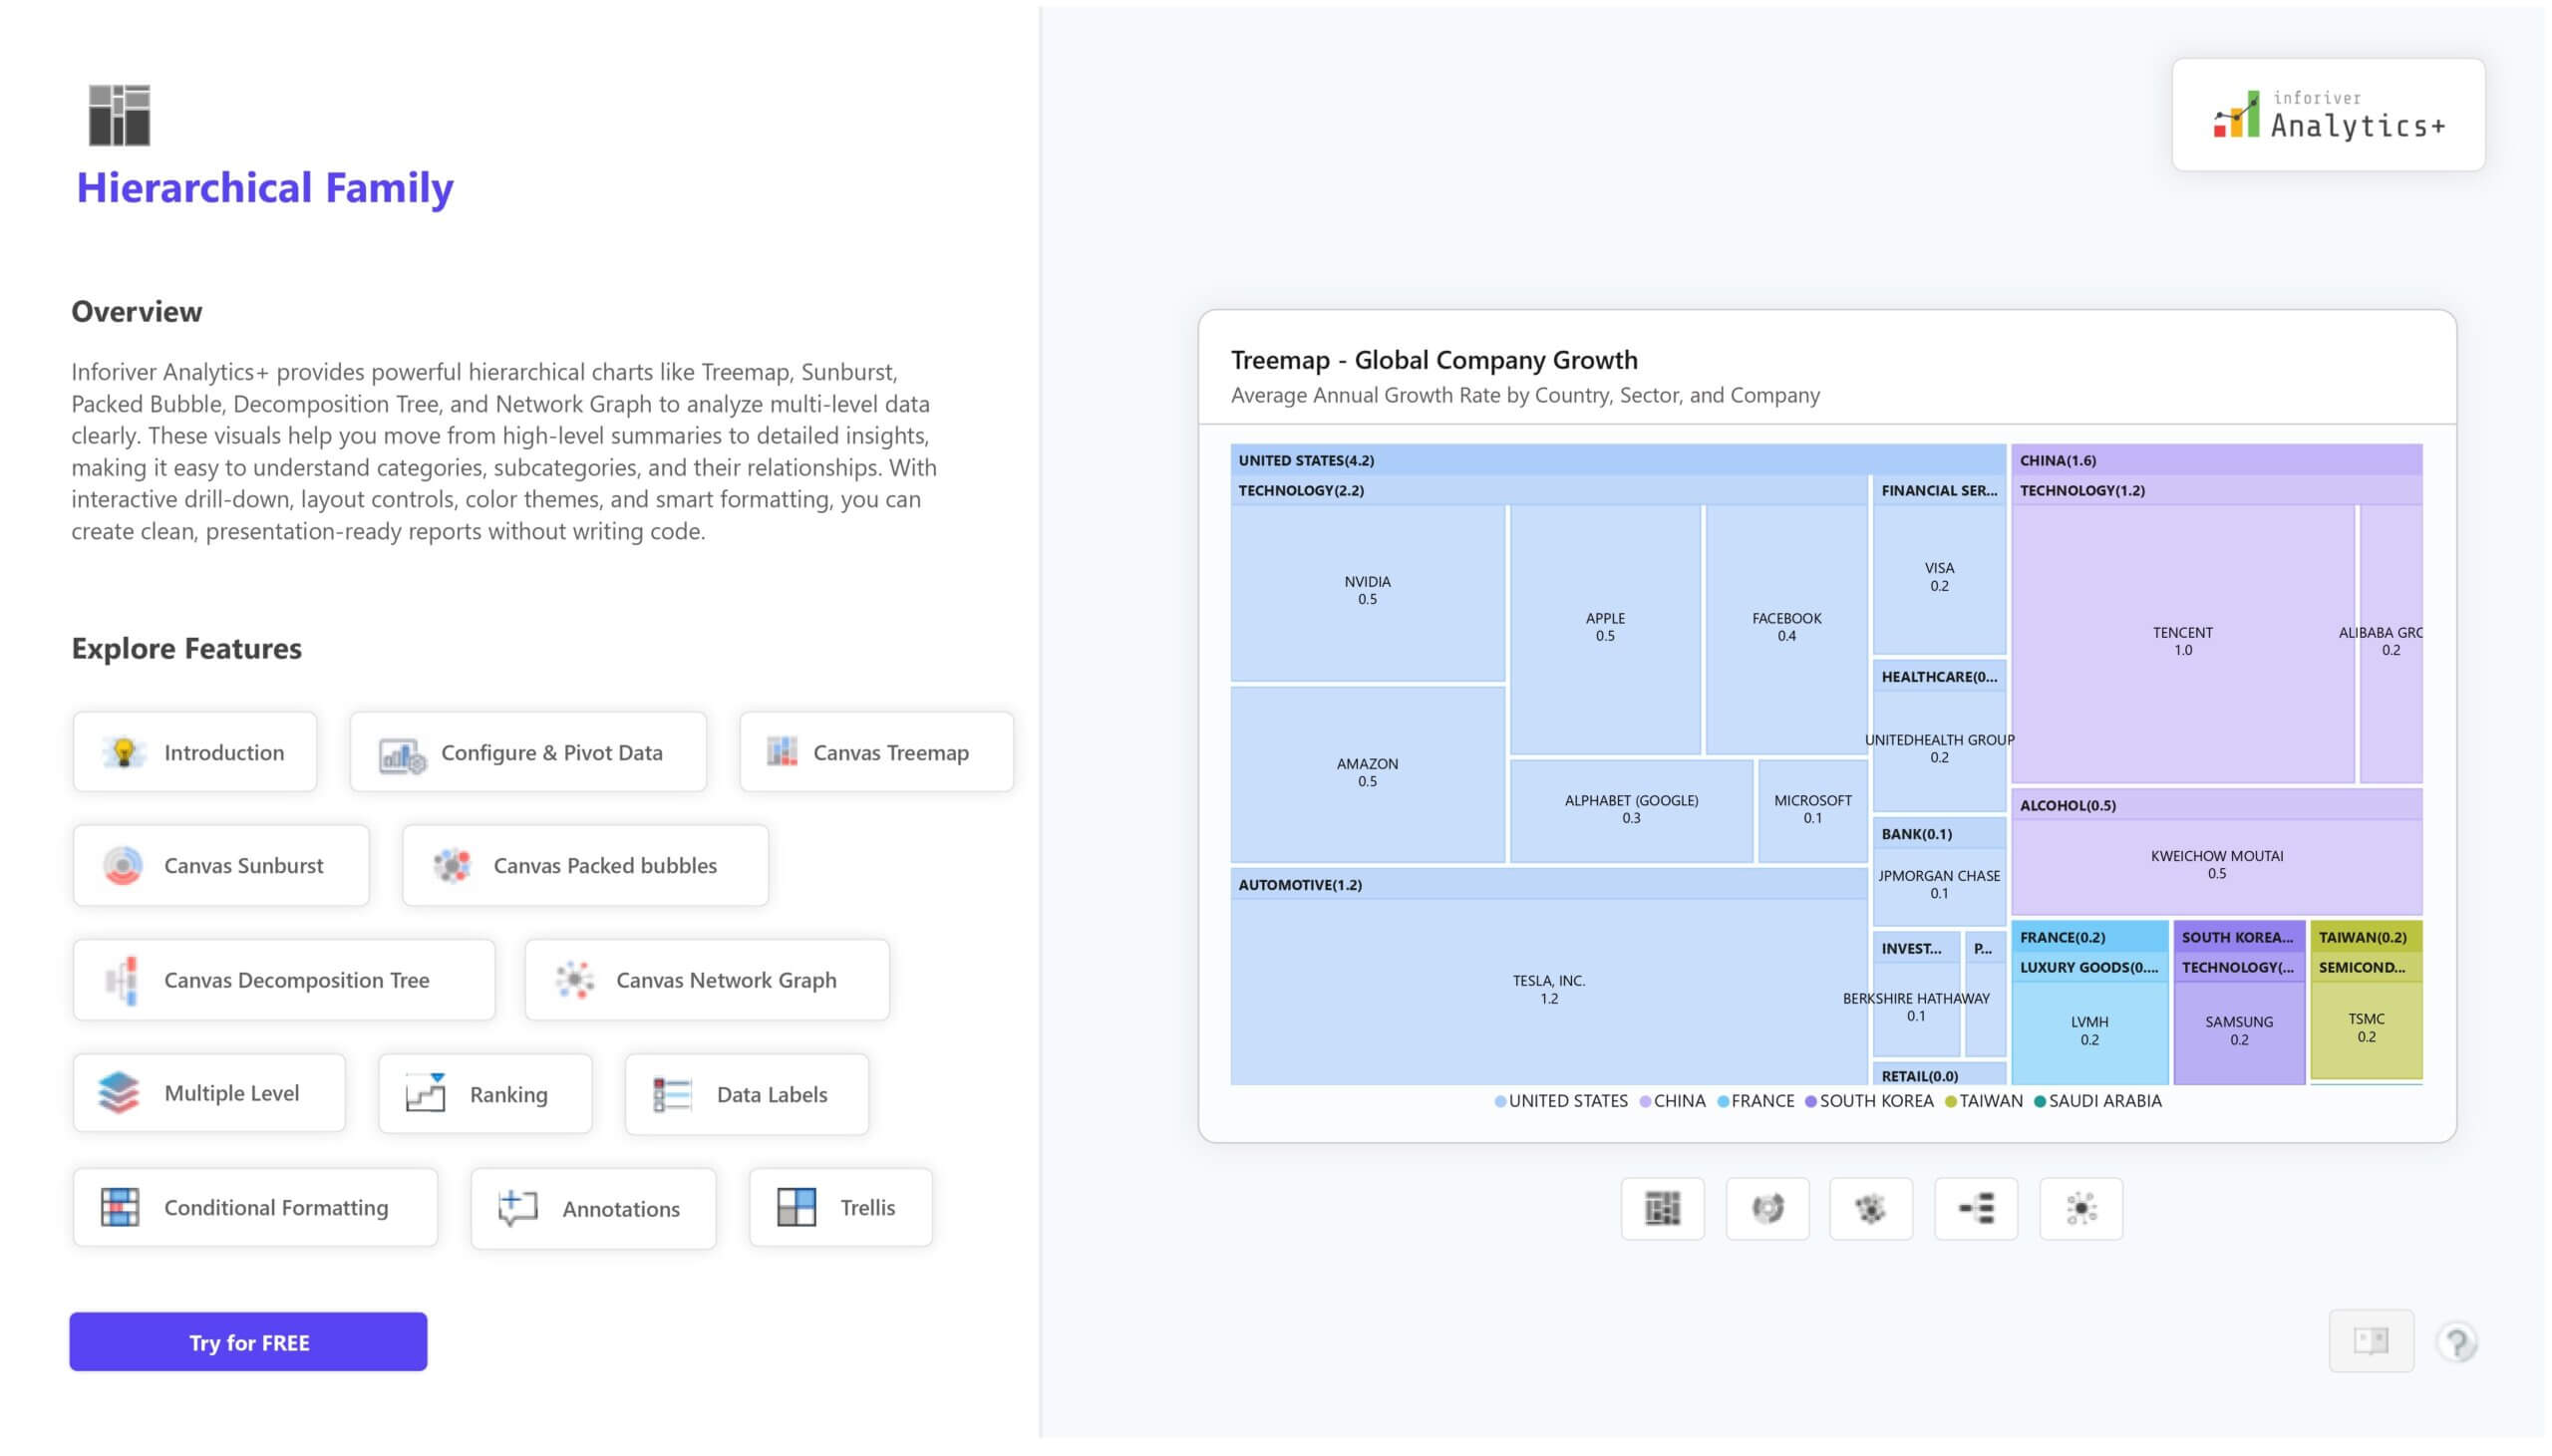
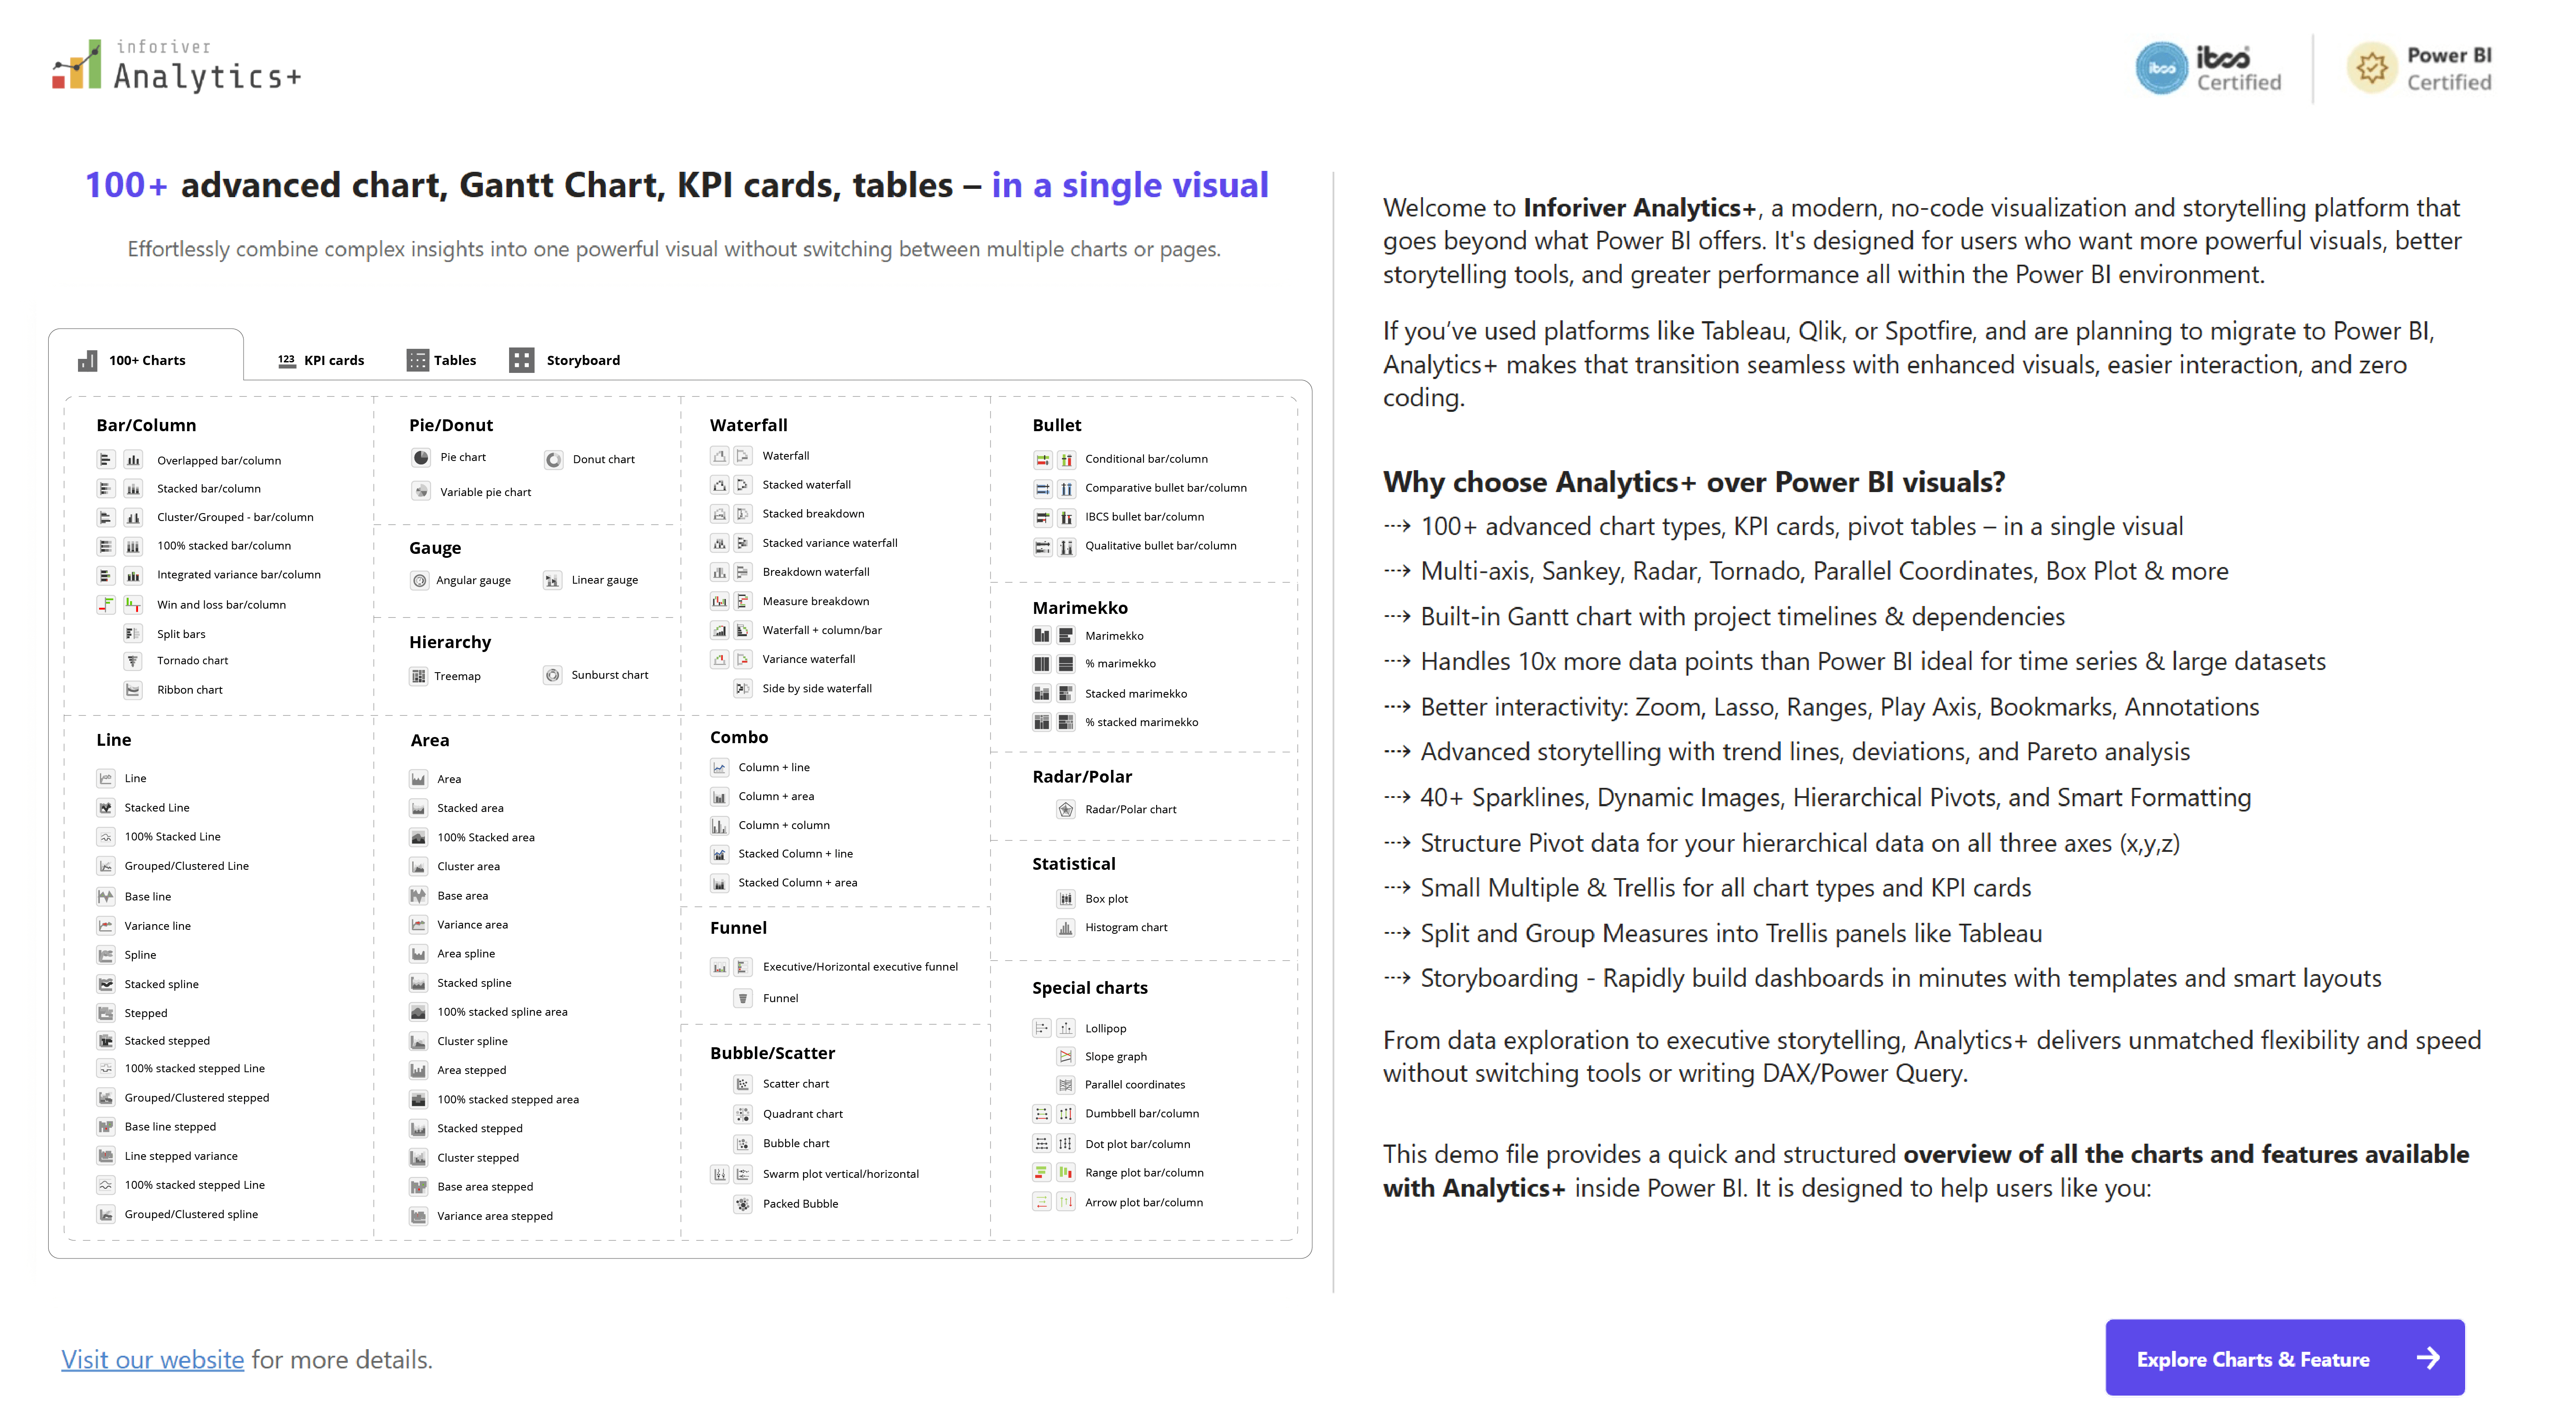
Welcome to Inforiver Analytics+, a modern, no-code visualization and storytelling platform that goes beyond what Power BI offers. It's designed for users who want more powerful visuals, better storytelling tools, and greater performance all within the Power BI environment.
If you’ve used platforms like Tableau, Qlik, or Spotfire, and are planning to migrate to Power BI, Analytics+ makes that transition seamless with enhanced visuals, easier interaction, and zero coding.
to try advance features
[demo_download_modal title="Inforiver Analytics+ for Power BI – Introduction Demo" link="https://inforiver.com/wp-content/uploads/Introduction-Demo-Analytics.zip"]
Inforiver helps enterprises consolidate planning, reporting & analytics on a single platform (Power BI). The no-code, self-service award-winning platform has been recognized as the industry’s best and is adopted by many Fortune 100 firms.
Inforiver is a product of Lumel, the #1 Power BI AppSource Partner. The firm serves over 3,000 customers worldwide through its portfolio of products offered under the brands Inforiver, EDITable, ValQ, and xViz.