Upcoming webinar on 'Inforiver Charts : The fastest way to deliver stories in Power BI', Aug 29th , Monday, 10.30 AM CST. Register Now
Upcoming webinar on 'Inforiver Charts : The fastest way to deliver stories in Power BI', Aug 29th , Monday, 10.30 AM CST. Register Now
Our long-term vision for Inforiver Analytics+ is that it becomes the “No-Code Visualization and Storytelling Platform of Choice” across all data platforms (Azure (Fabric & Power BI), GCP (Big Query & Looker), AWS, Snowflake, Data Bricks, etc.). With over a decade of deep experience from our Visual BI Days with VBX for SAP Lumira, then xViz for Power BI, and now with the 3.2 release, we are much closer to our vision than ever before. Inforiver Analytics+ now delivers 50+ Charts + KPI Cards + Tables in a single visual to help causal users build dashboards and storyboards in less than 5 minutes.
We see a huge opportunity as large enterprise customers continue to pay huge maintenance dollars for multiple BI Platforms (Tableau, Qlik, Spotfire, SAP BOBJ, Cognos, OBIEE …) despite owning Microsoft Power BI through an E5 license bundle. As the data visualization market rapidly evolves into Data Stories and augmented insights use cases – customers are looking for charts that provide stories and insights faster. The user persona using these tools are also more casual/citizen data users vs. Power Users or IT from the last decade.
With the 3.1 release – we have honed in on-canvas interactions, which will significantly improve the user experience for casual users to discover and apply properties to customize.

With our new small multiple/Trellis architecture framework with a full hierarchy expand/collapse experience – every chart type can be turned into a new modern “Visual Pivot Table.”
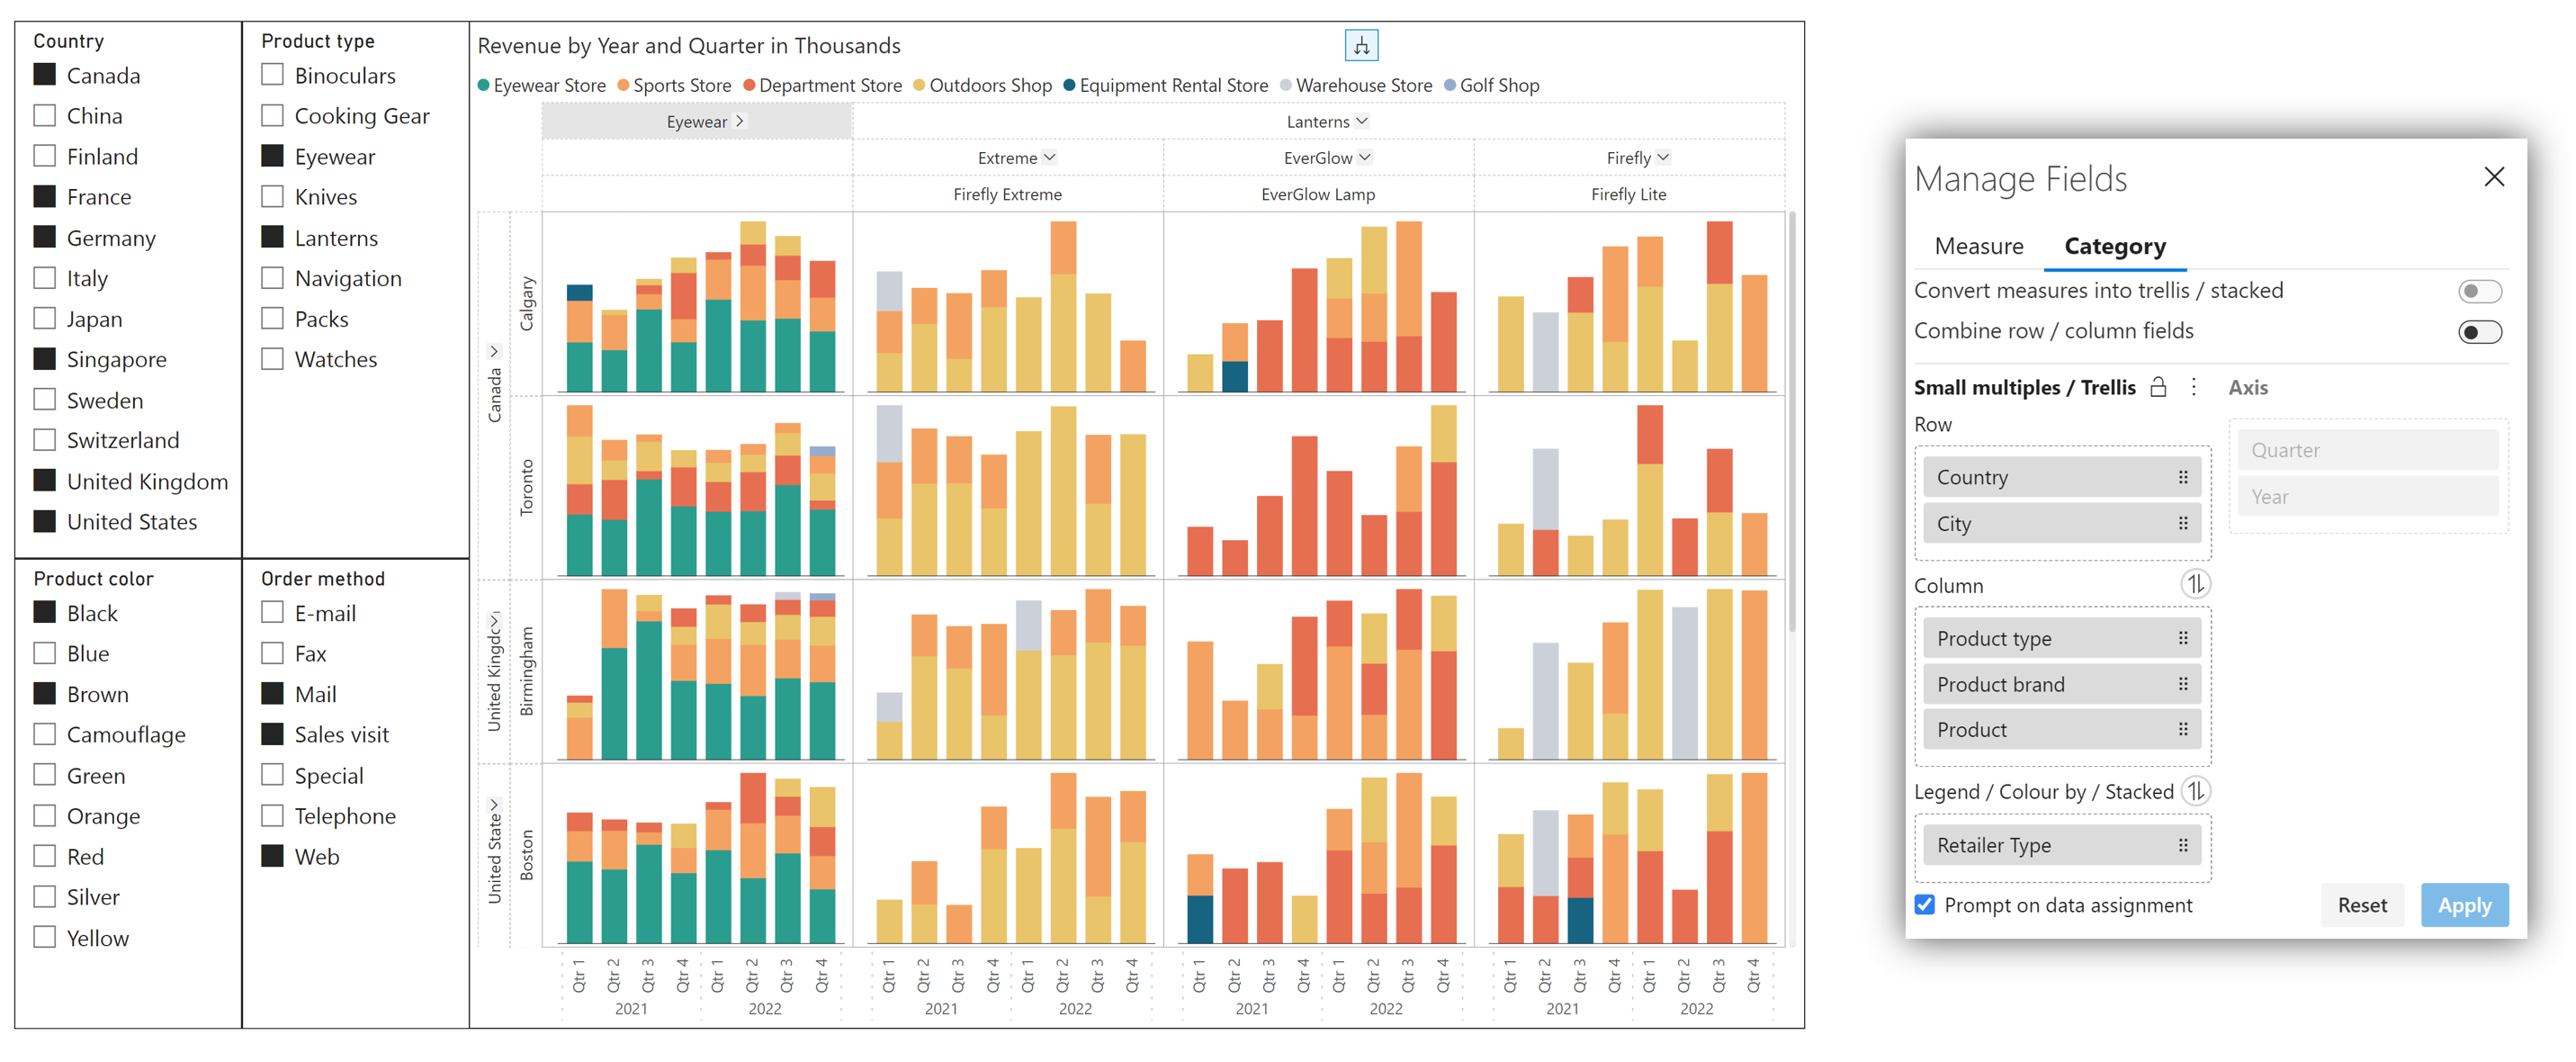
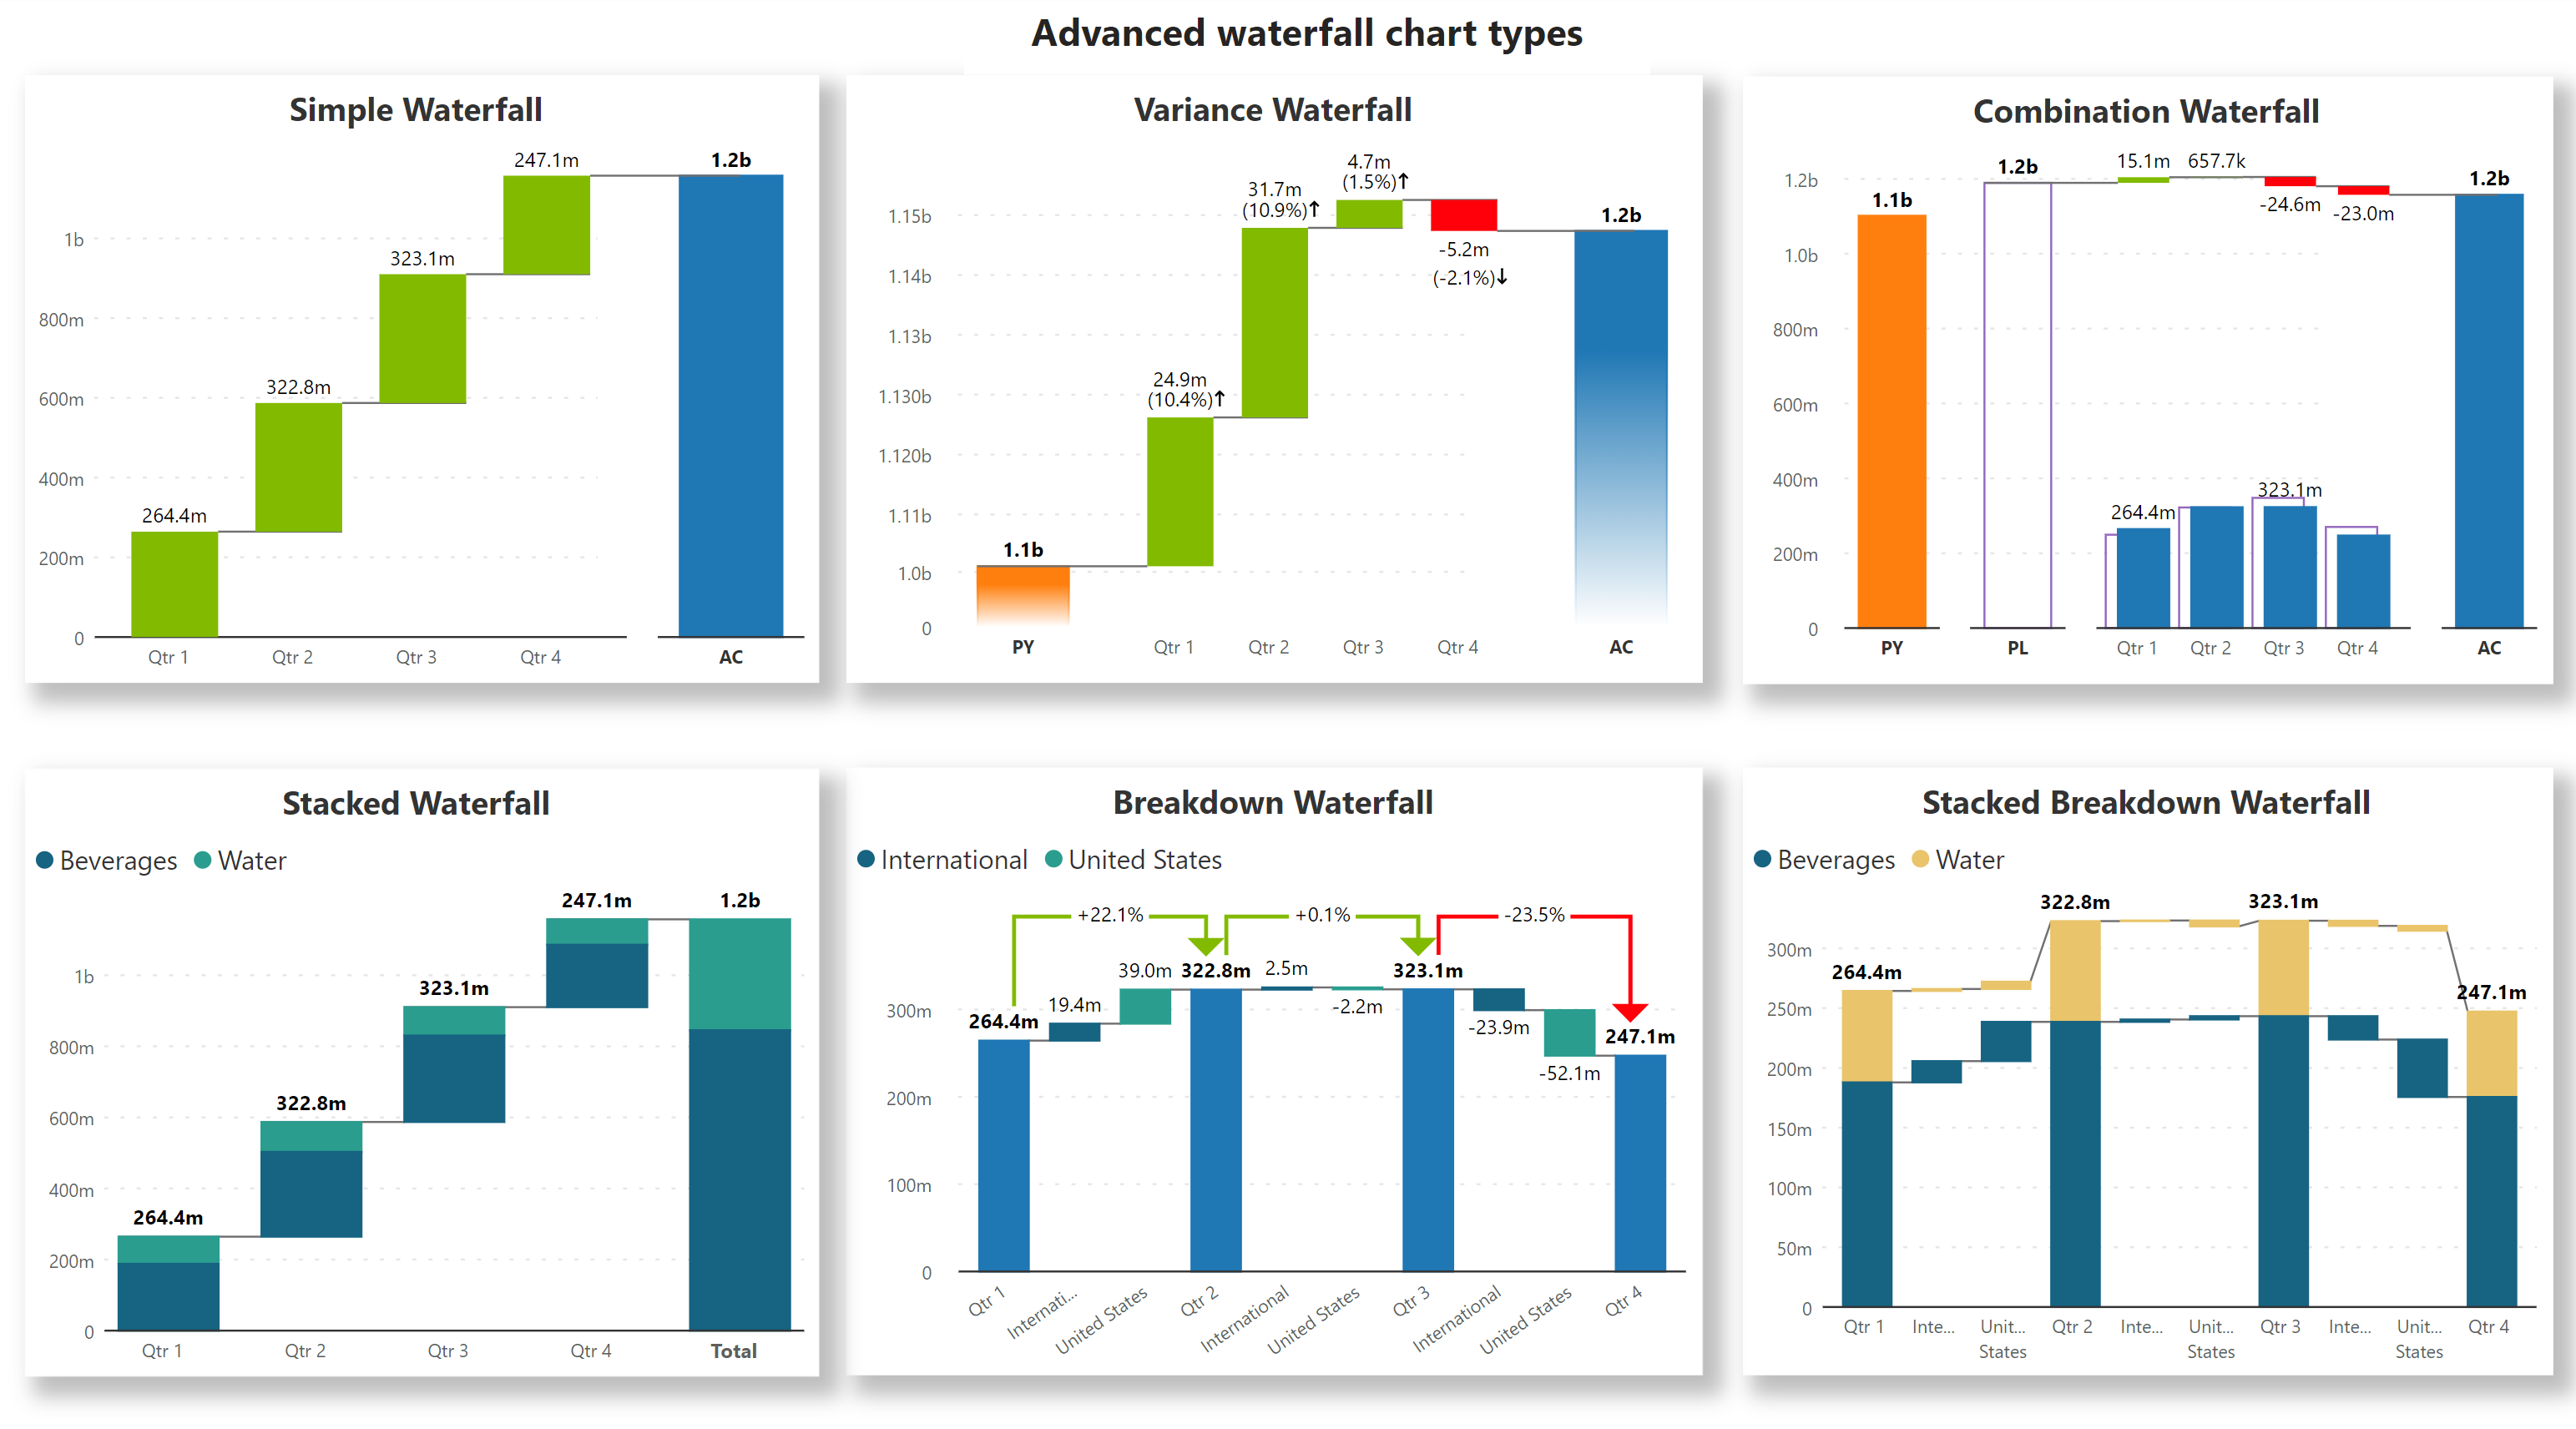
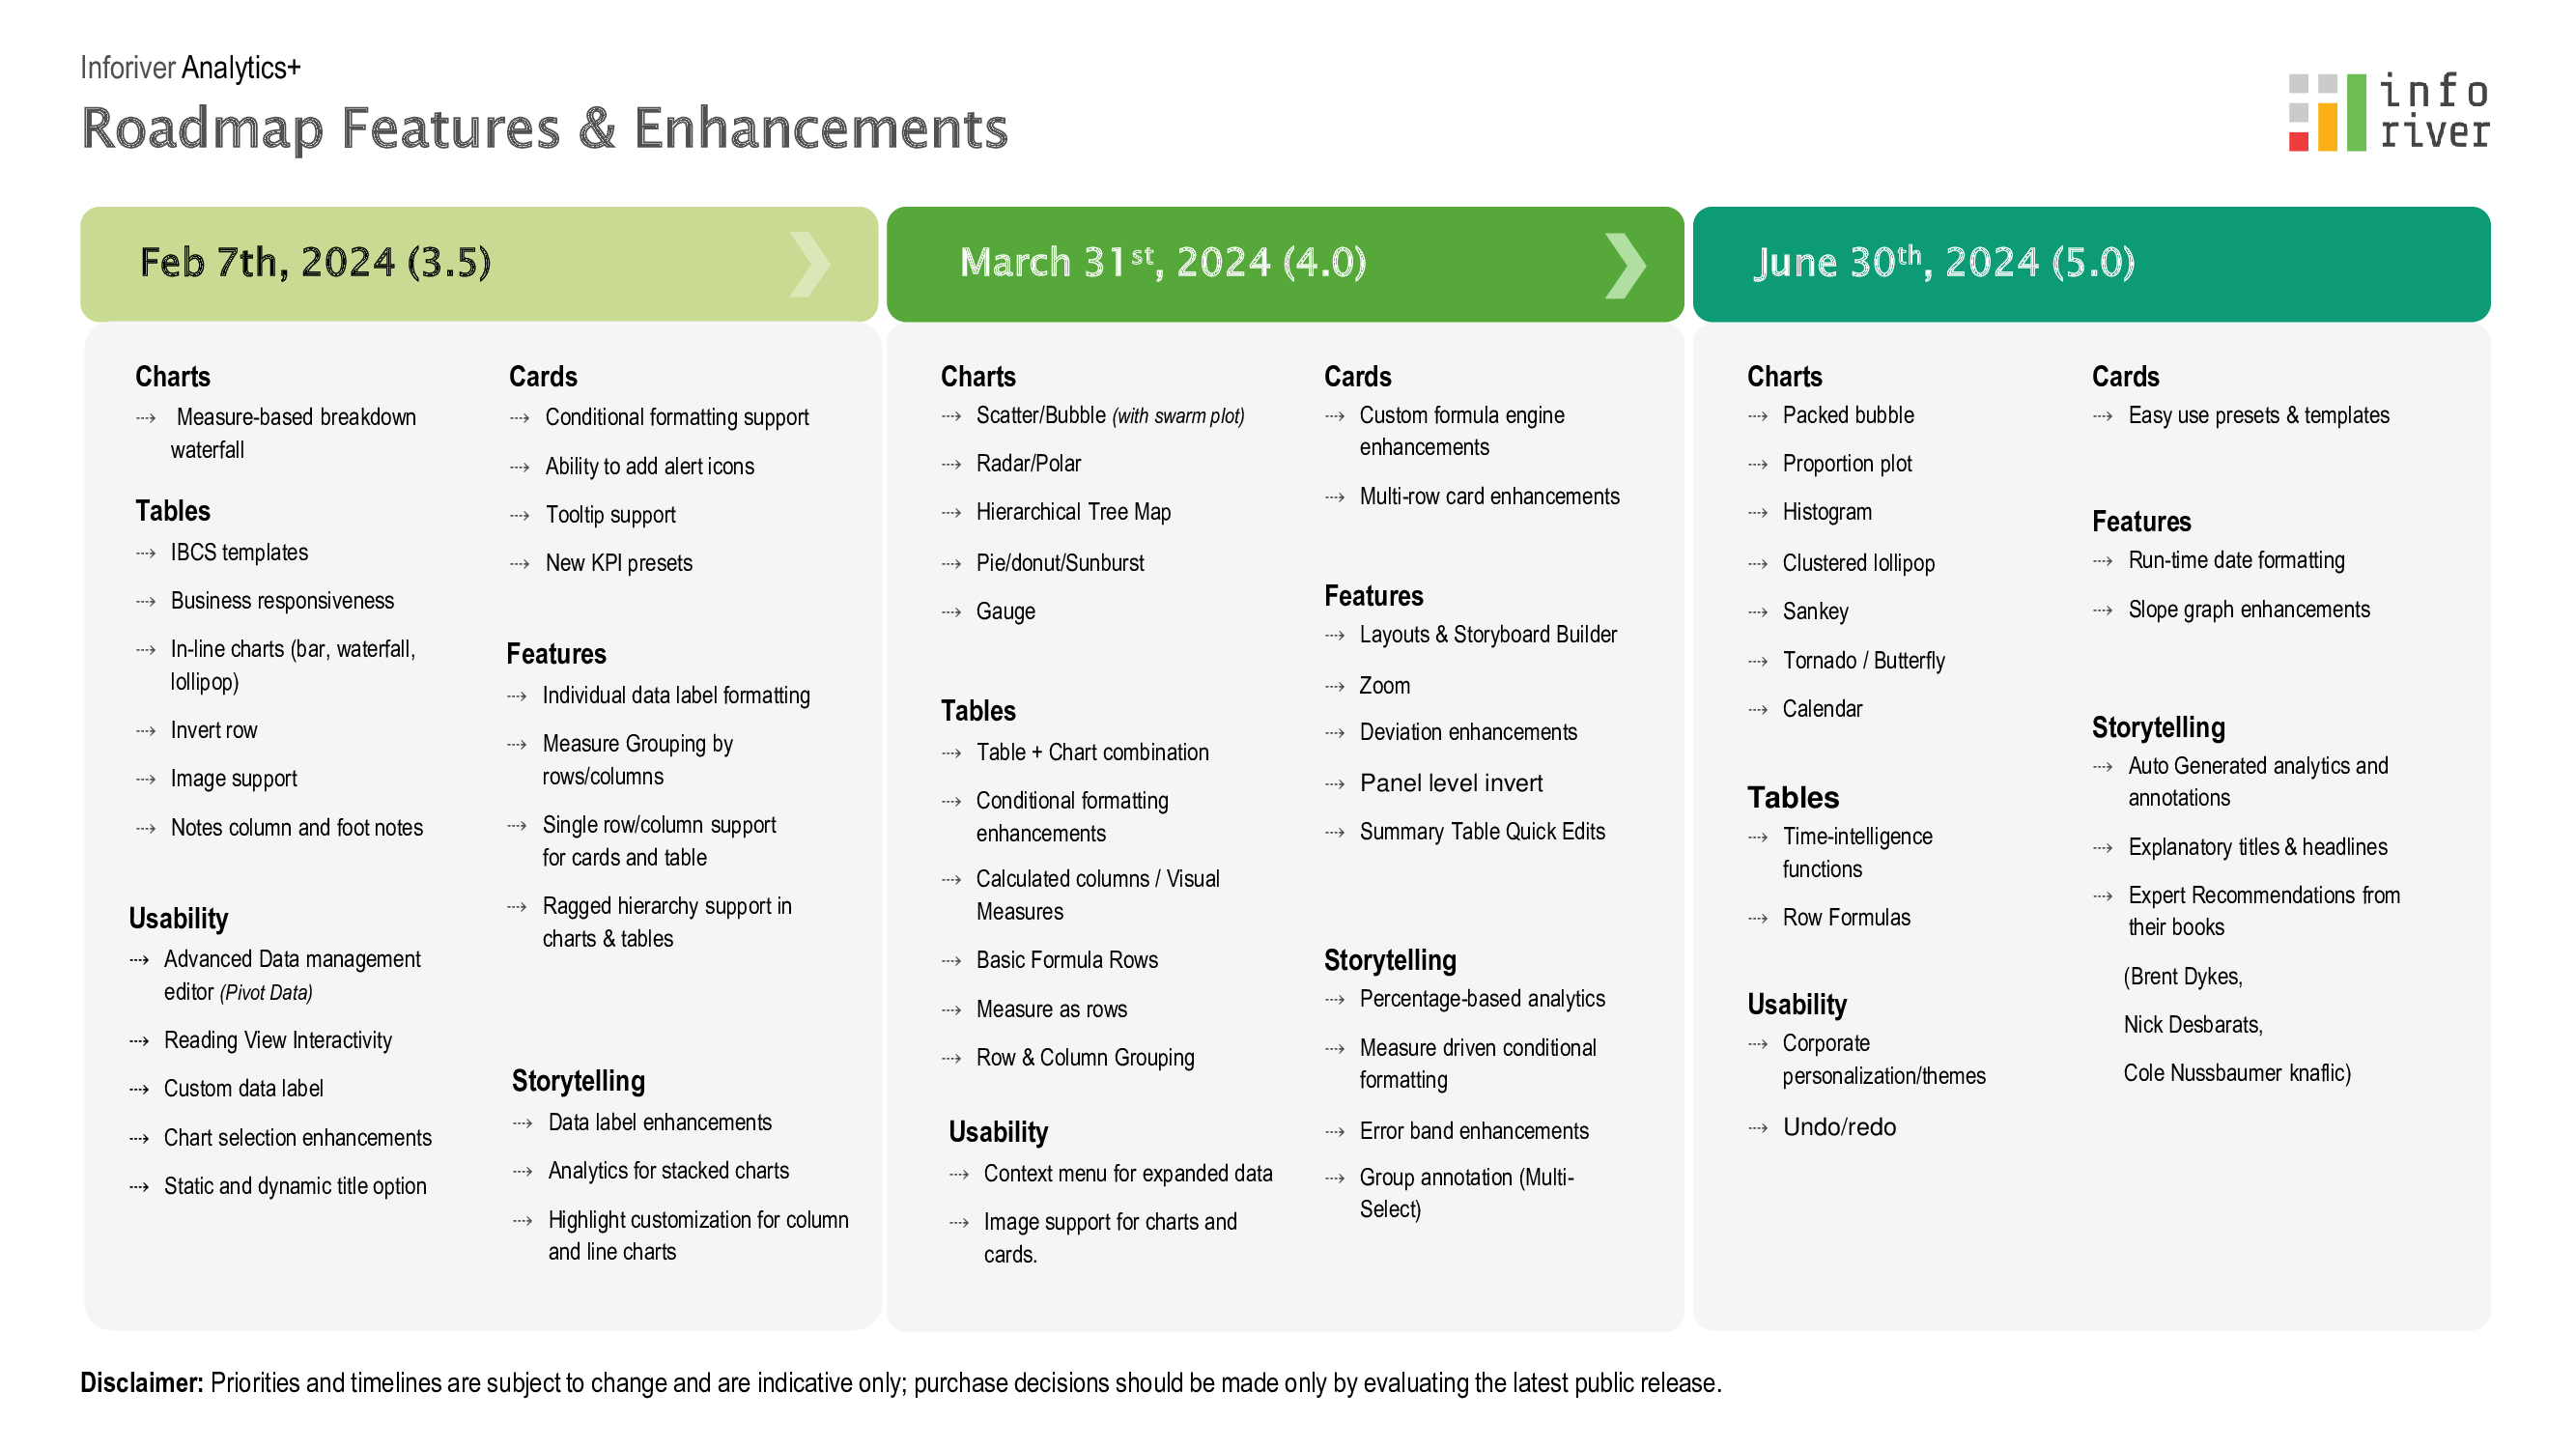
Finally, I am pleased to share our short and medium-term roadmap as we can rapidly bring new storytelling chart types (usually unavailable in any BI tools out of the box) and some very advanced chart types such as the measure-based breakdown waterfall. Also, all the new chart types will have small multiples/trellis support, enabling more TIBCO Spotfire and Tableau customers to migrate and consolidate with Power BI easily.
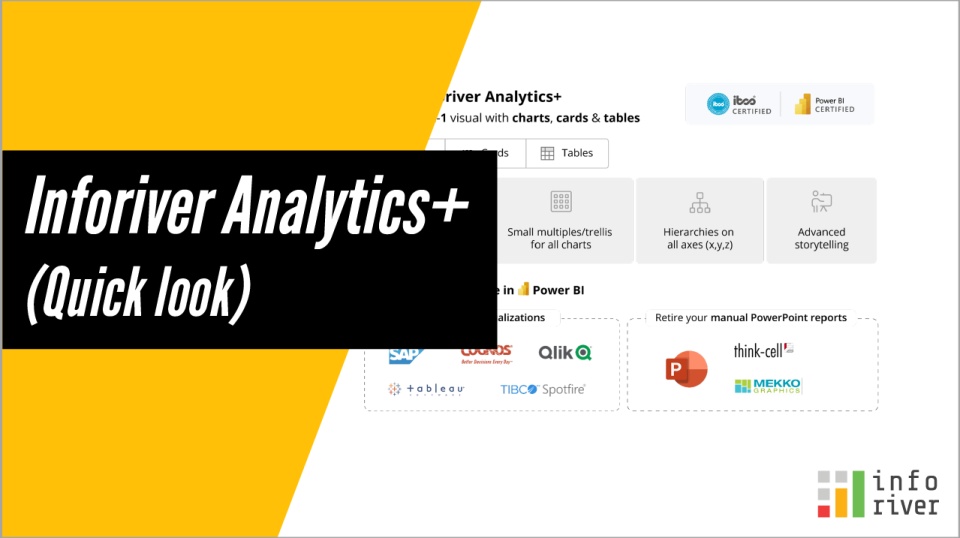
Take a quick look at the power of Inforiver Analytics+

Inforiver helps enterprises consolidate planning, reporting & analytics on a single platform (Power BI). The no-code, self-service award-winning platform has been recognized as the industry’s best and is adopted by many Fortune 100 firms.
Inforiver is a product of Lumel, the #1 Power BI AppSource Partner. The firm serves over 3,000 customers worldwide through its portfolio of products offered under the brands Inforiver, EDITable, ValQ, and xViz.