Upcoming webinar on 'Inforiver Charts : The fastest way to deliver stories in Power BI', Aug 29th , Monday, 10.30 AM CST. Register Now
Upcoming webinar on 'Inforiver Charts : The fastest way to deliver stories in Power BI', Aug 29th , Monday, 10.30 AM CST. Register Now
Revenue growth is one of the most closely watched metrics in any organization. Yet, for all its importance, revenue is often presented as a single, unexplained number.
Revenue is up by $1.75 million.
That statement tells us what happened but not why. Did the increase come from raising prices? From selling more units? From customers shifting toward premium products? Or from launching new SKUs? Without understanding the drivers behind the change, leadership teams are reacting to outcomes instead of managing the levers that create them.
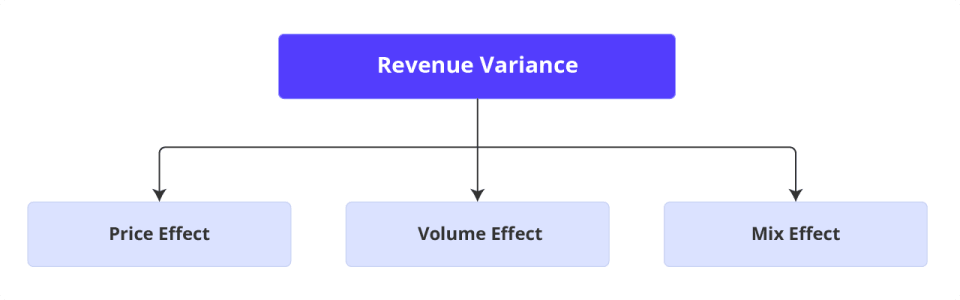
This is where Price Volume Mix (PVM) Analysis becomes indispensable. PVM breaks revenue variance into three fundamental components, price, volume, and mix, so decision-makers can evaluate the quality and sustainability of growth. Instead of treating revenue as a black box, PVM opens it.
When implemented using PVM analysis in Power BI, and enhanced with tools like Inforiver Analytics+, PVM evolves from a finance exercise into a strategic performance framework.
At its core, Price Volume Mix Analysis is a revenue variance analysis is a variance decomposition technique. It answers a simple but powerful question:
What drove the change in revenue between two periods?
Revenue can only change for three structural reasons:
Every revenue variance can be traced back to one or more of these drivers.
PVM allows organizations to isolate each driver mathematically and analyze its contribution. This separation provides clarity on whether growth is margin accretive, demand driven, or portfolio driven, and whether it is likely to continue.
o understand Price Volume Mix Analysis in action, let us use a consistent FMCG example.
Last year:
This year:
Revenue increased by $1,750,000.
Instead of stopping there, PVM asks how much of this $1.75 million increase came from price, how much from volume, and how much from mix.
In Price Volume Mix Analysis, the price effect isolates the portion of revenue change caused solely by changes in selling price.
The standard formula is:
(Current Price − Prior Price) × Current Volume
Applying this to our example:
($25 − $20) × 150,000 = $750,000
This means $750,000 of the total revenue growth came purely from increasing price.
Strategically, this is powerful insight. Price driven growth is often considered the highest quality growth because it typically flows directly to margin. Raising price does not necessarily require additional manufacturing, distribution, or servicing costs. It reflects pricing discipline, brand strength, differentiation, and competitive positioning.
However, pricing must always be evaluated carefully. A positive price effect may be accompanied by declining volume. Without PVM, that trade off can remain hidden.
The volume effect measures the revenue change driven by selling more or fewer units while holding price constant.
The formula is:
(Current Volume − Prior Volume) × Prior Price
Applying this:
(150,000 − 100,000) × $20 = $1,000,000
In our example, $1,000,000 of the growth came from selling additional units.
Volume growth often reflects market expansion, improved sales execution, wider distribution, or stronger demand. It can signal competitive gains and increased market share.
But volume led growth typically requires operational support. More units sold means more production, logistics, inventory, and working capital. From a profitability standpoint, understanding whether revenue growth is volume driven helps leadership assess operational scalability.
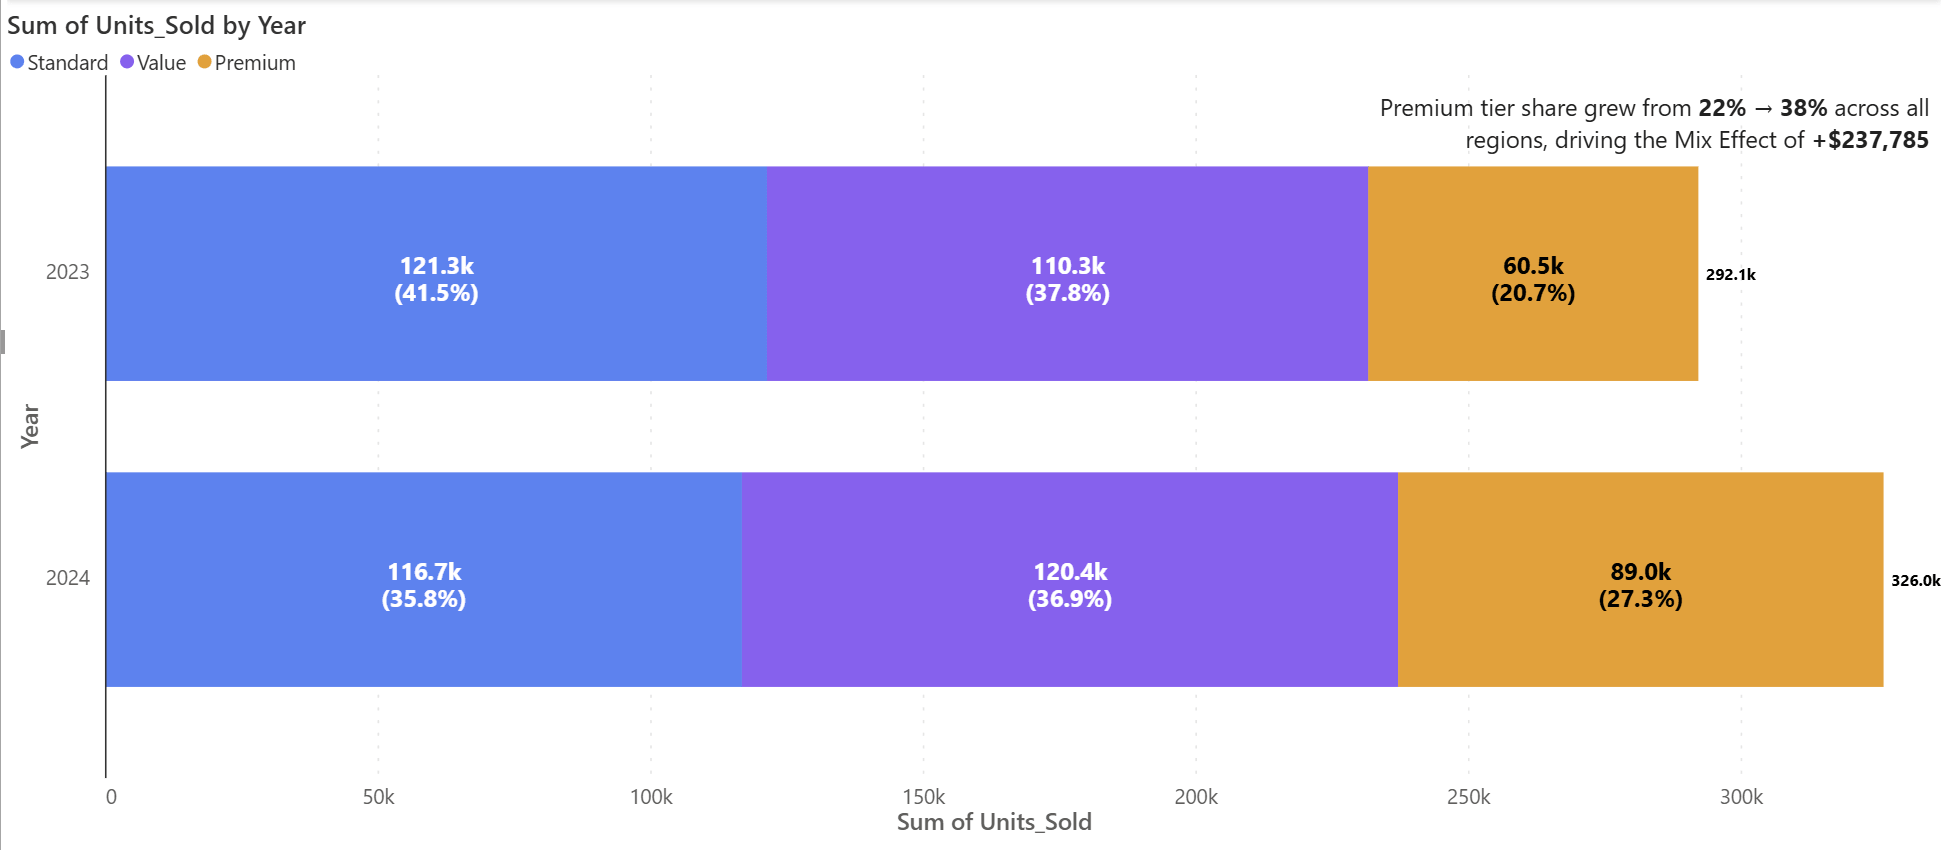
The mix effect captures changes in the composition of products sold. While price reflects changes to unit pricing and volume reflects unit quantity, mix reflects what customers are choosing within the portfolio.
Let us extend the same FMCG example.
Last Year:
This Year:
Here, customers shifted part of their purchases toward a higher priced premium product. Even if total volume had remained constant, revenue would have increased because of this shift.
That uplift is the mix effect.
Mix provides deep strategic insight. A positive mix effect may indicate successful premiumization, effective upselling, strong brand perception, or innovation traction. A negative mix effect may signal customer trade down, discount pressure, or economic stress.
In many industries, mix tells a more nuanced story than price alone. It reflects customer behaviour within your portfolio and often signals long term strategic trends.
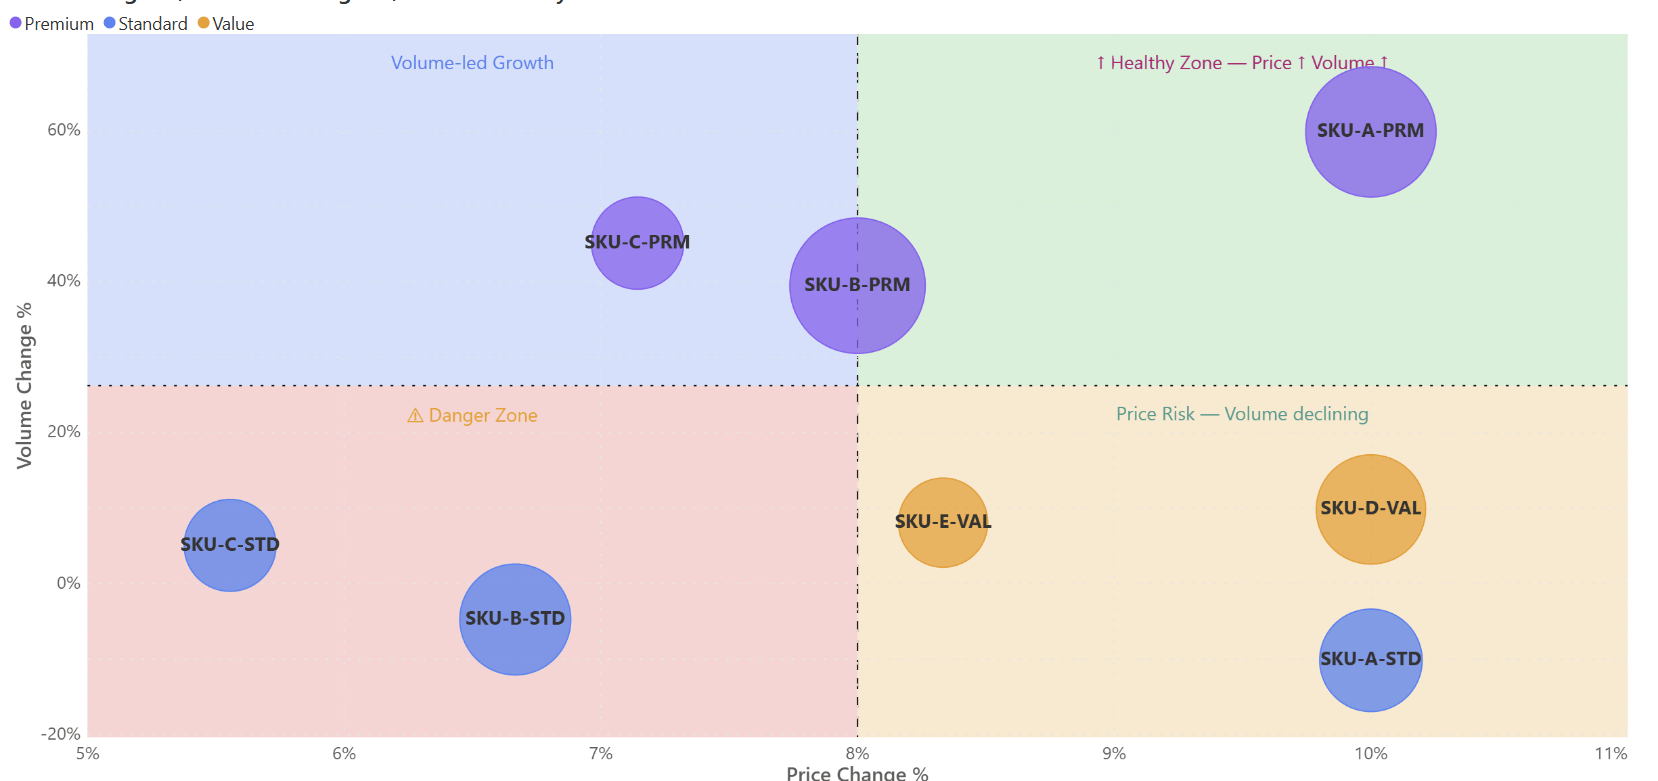
One of the most critical strategic applications of Price Volume Mix Analysis is understanding the price and volume relationship.
In many markets, increasing price leads to lower volume due to price elasticity. The key question becomes whether the gain from price outweighs the loss from reduced units.
For example:
Even though pricing increased revenue, the drop in units resulted in a net decline. Without PVM, leaders might incorrectly celebrate the price increase without recognizing its destructive impact.
Conversely, when both price and volume increase simultaneously, as in our original example, it signals exceptional market strength. This scenario suggests strong brand equity, differentiated value, or limited competitive alternatives.
PVM exposes these dynamics clearly and objectively.
While PVM can be calculated manually in spreadsheets, its strategic power increases significantly when visualized dynamically.
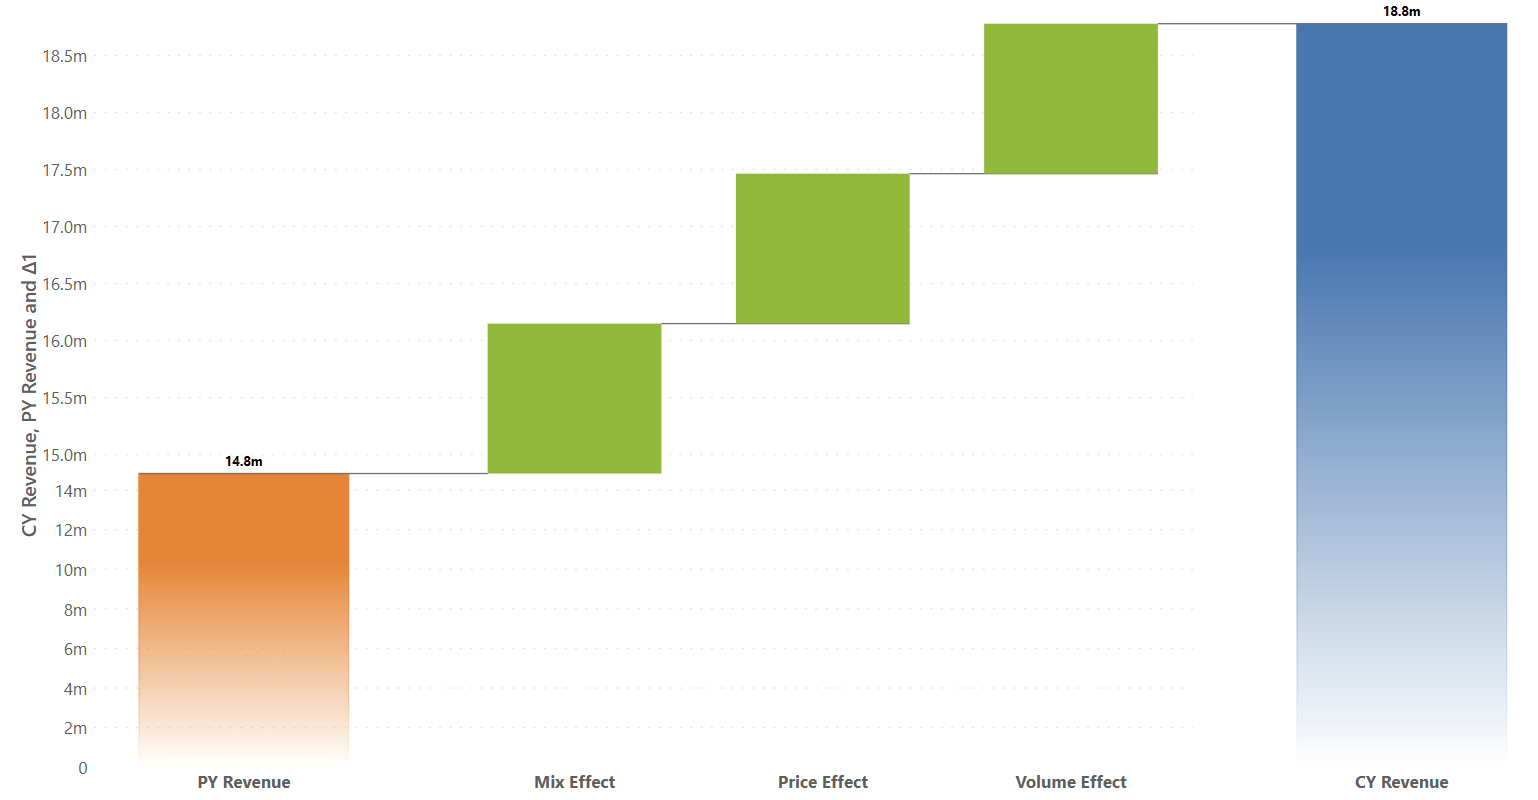
Within Microsoft Power BI, tools like Inforiver Analytics+ allow teams to build automated waterfall bridges that visually decompose revenue variance. Instead of reviewing static tables, executives see a visual story:
Prior Year Revenue → Price Effect → Volume Effect → Mix Effect → Current Year Revenue
This bridge immediately highlights which driver contributed most to growth.
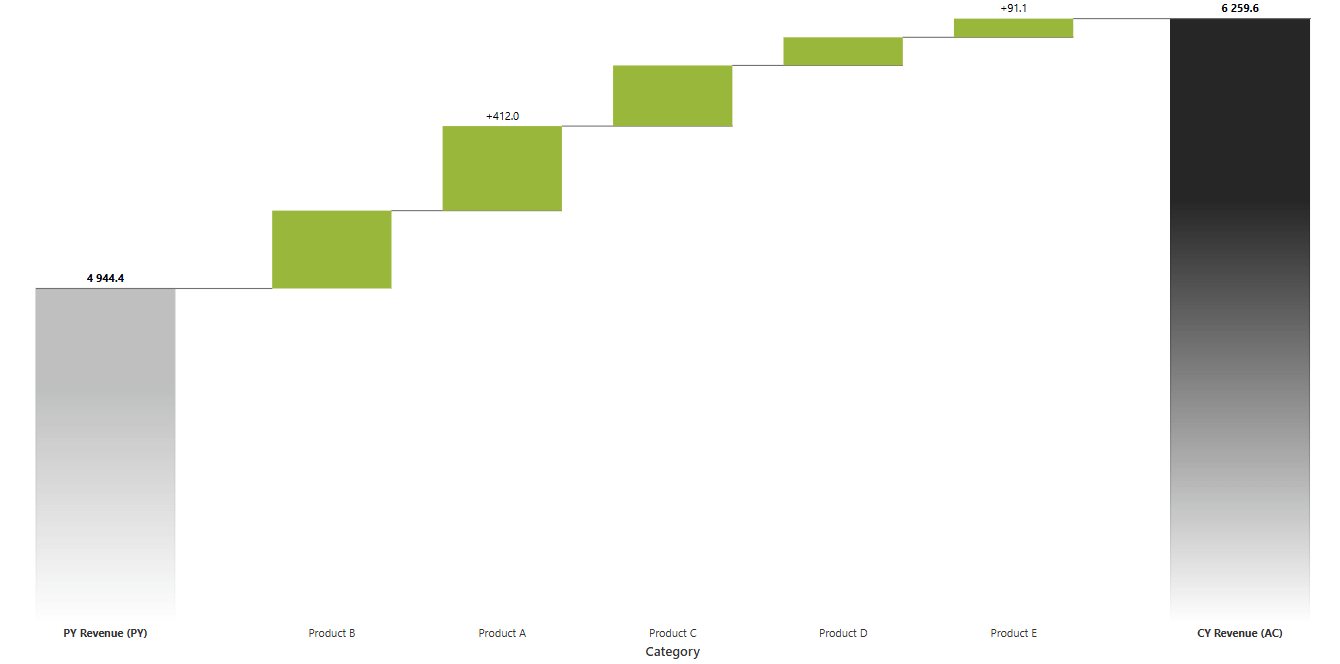
Interactive drill down capabilities enable leaders to move from company level analysis to region, category, or SKU level drivers. Side by side comparisons reveal whether different regions are relying on different growth strategies, one driven by price discipline, another by volume expansion.
This shifts revenue reporting from historical explanation to strategic diagnosis.
Price Volume Mix Analysis analysis transforms revenue from a static metric into a dynamic management framework. By applying price volume mix variance analysis, organizations understand the quality of growth, diagnose strategic trade-offs, and align commercial actions with profitability goals.
When supported by modern analytics platforms like Microsoft Power BI and visualization tools such as Inforiver Analytics+, PVM becomes scalable, automated, and executive ready.
Revenue variance should never remain a mystery. With Price Volume Mix Analysis, it becomes a roadmap that reveals not just where the business has been, but where it should go next.

Inforiver helps enterprises consolidate planning, reporting & analytics on a single platform (Power BI). The no-code, self-service award-winning platform has been recognized as the industry’s best and is adopted by many Fortune 100 firms.
Inforiver is a product of Lumel, the #1 Power BI AppSource Partner. The firm serves over 3,000 customers worldwide through its portfolio of products offered under the brands Inforiver, EDITable, ValQ, and xViz.