
Upcoming webinar on 'Inforiver Charts : The fastest way to deliver stories in Power BI', Aug 29th , Monday, 10.30 AM CST. Register Now
Upcoming webinar on 'Inforiver Charts : The fastest way to deliver stories in Power BI', Aug 29th , Monday, 10.30 AM CST. Register Now
A common requirement for organizations is to forecast using a blank template in Power BI, just as you would do with Microsoft Excel. Data in this case may be entered by a single individual or by many individuals across the organization.
Let us explore how you can set this up quickly in Power BI using Inforiver.
In our case, ACME Inc. wants to create sales forecasts for 2024 for its four quarters for each geography. These are the steps involved.
1. Launch Inforiver Matrix visual.
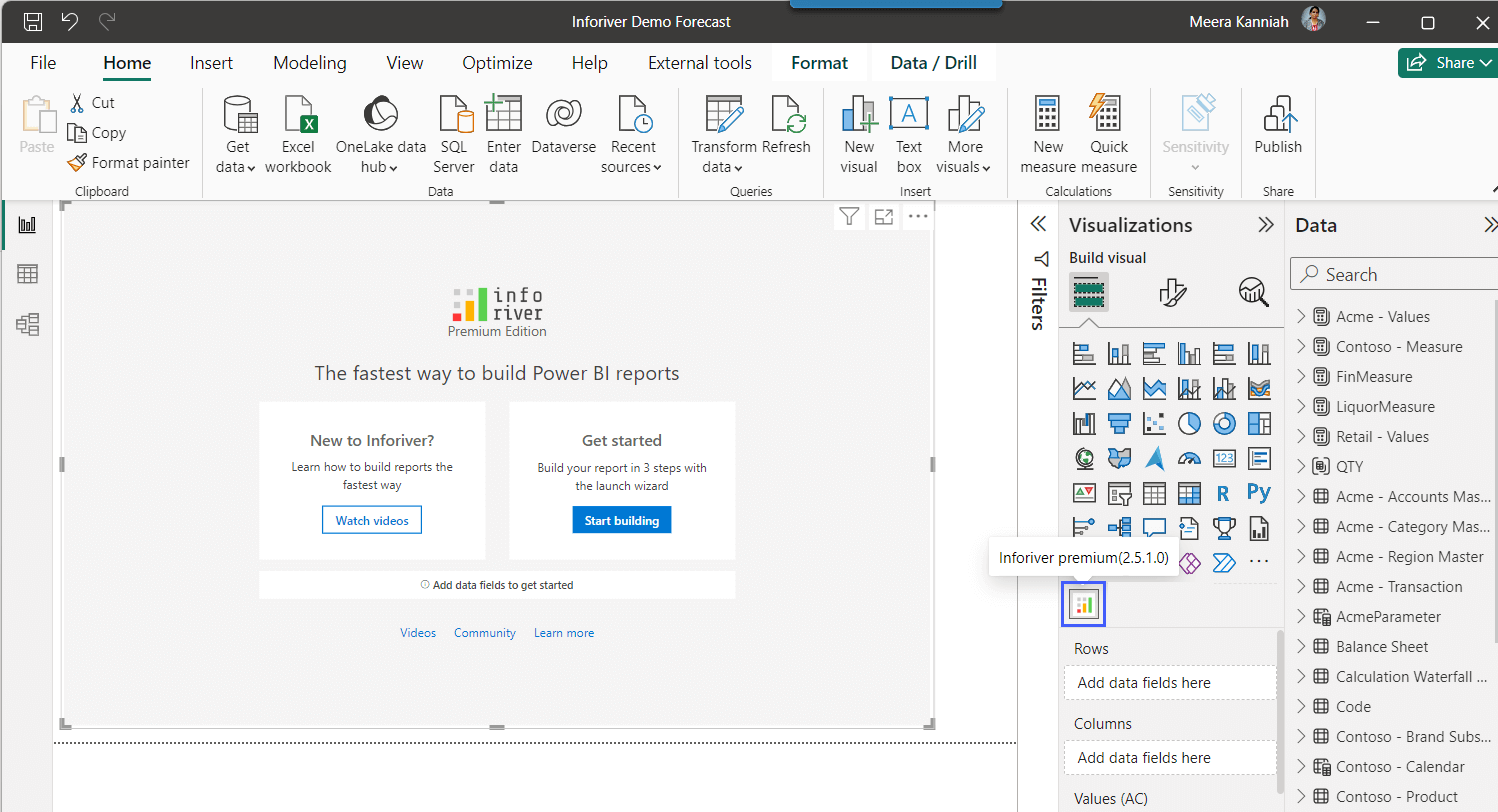
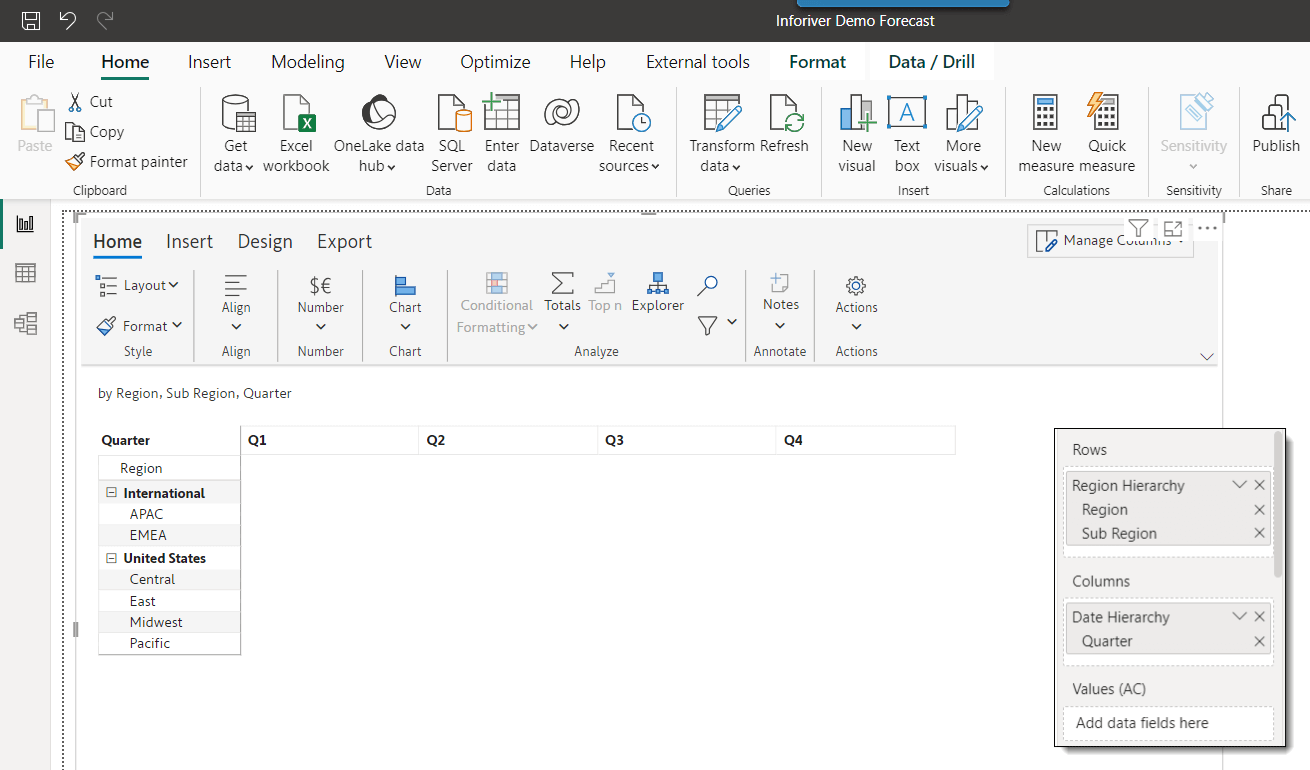
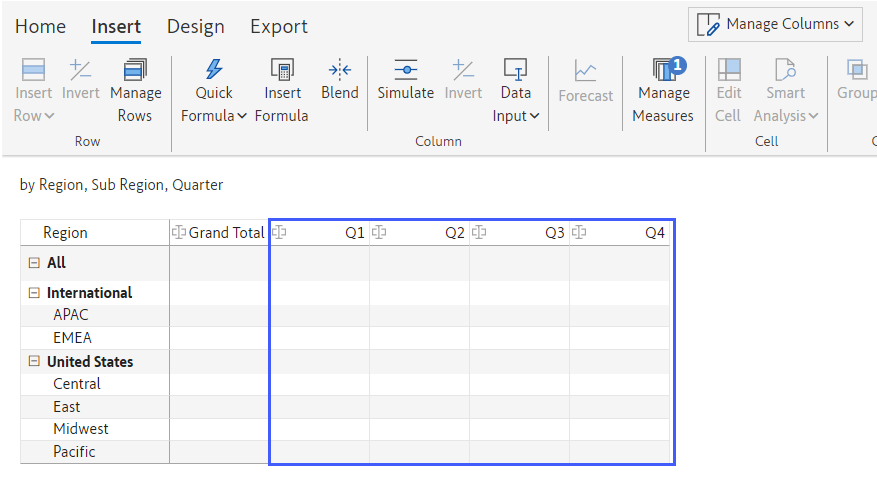
2. Assign region & subregion categories to rows and quarters to columns. You will have a blank table structure.
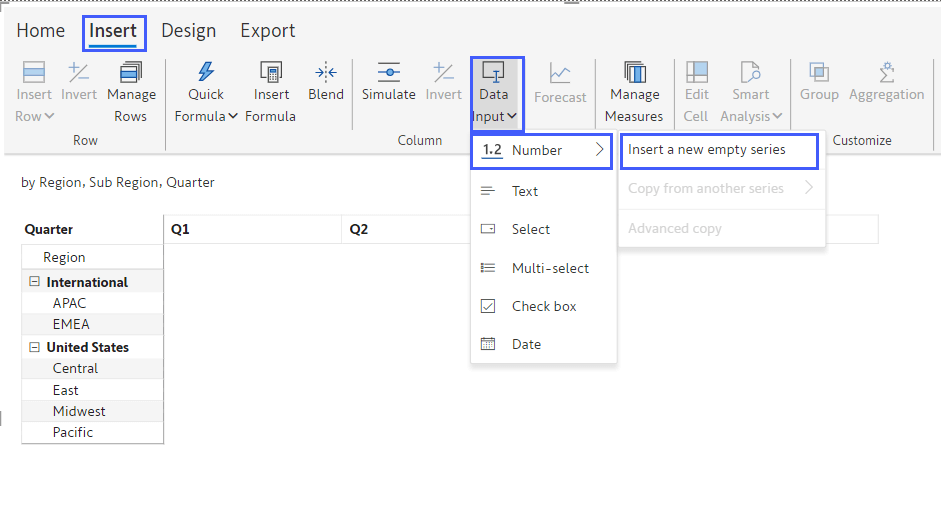
3. We now will create a data input field (a forecast measure) so that users can type in their values. To do this, click on Insert --> Data Input --> Number (it is a numeric field type) --> Insert a new empty series.
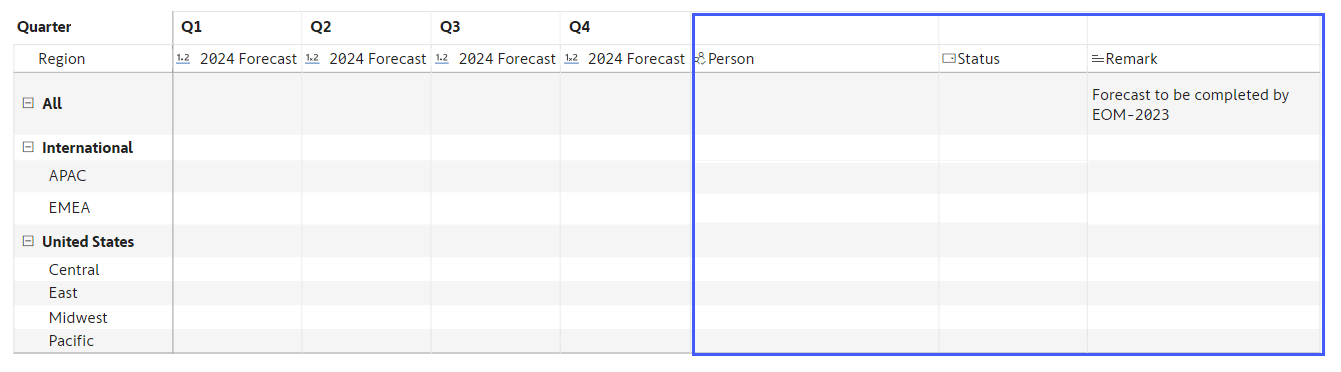
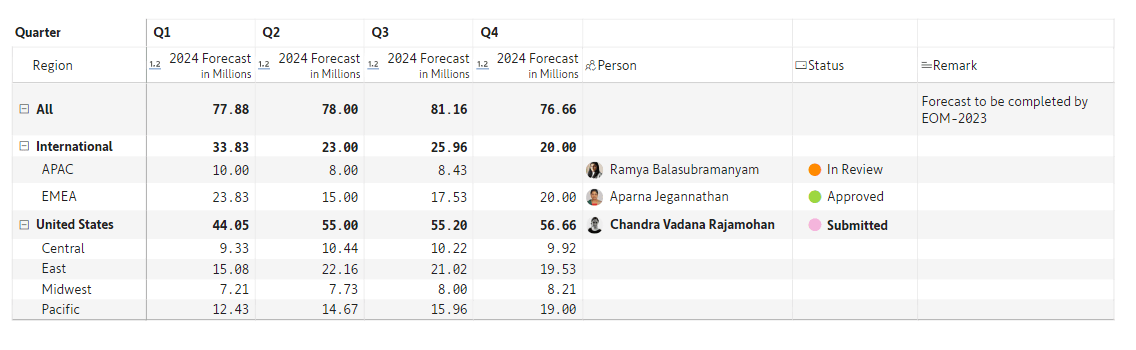
4. Name the column 2024 Forecast and click on Create.
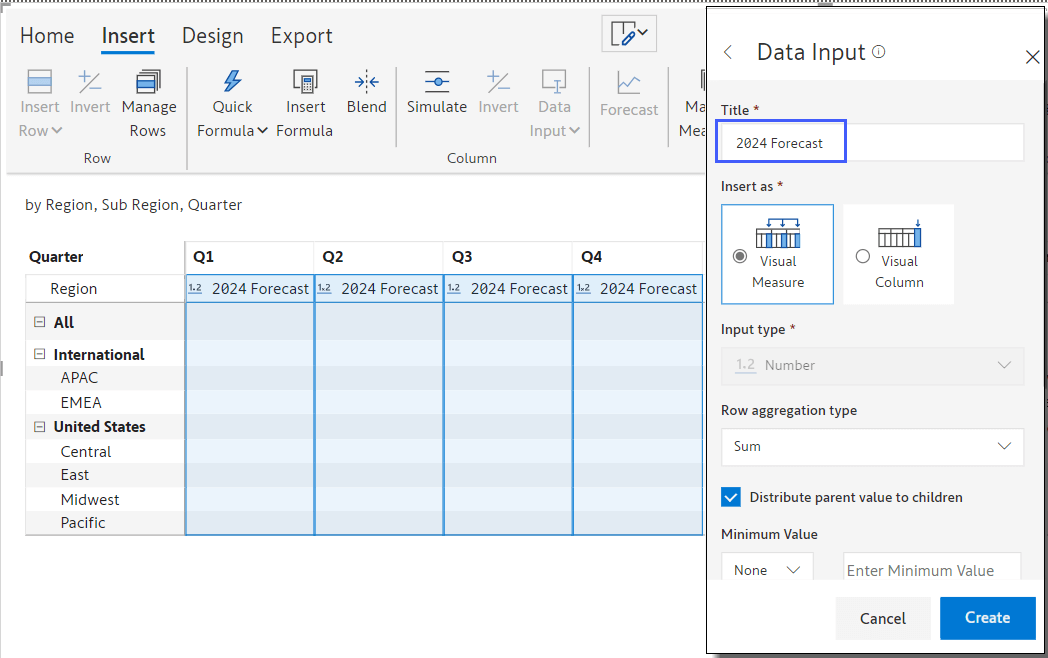
5. You will have a blank template with four columns. You can also add additional fields of other types (text, multi-select, date, etc) using the same Data Input menu shown earlier.
Let us go ahead & add these fields:
a. a "Person" column for inputting users' names from the organization. The list of names comes from Office365 directory.
b. a "Status" text dropdown field and
c. a "Remark" column for entering multiline comments.
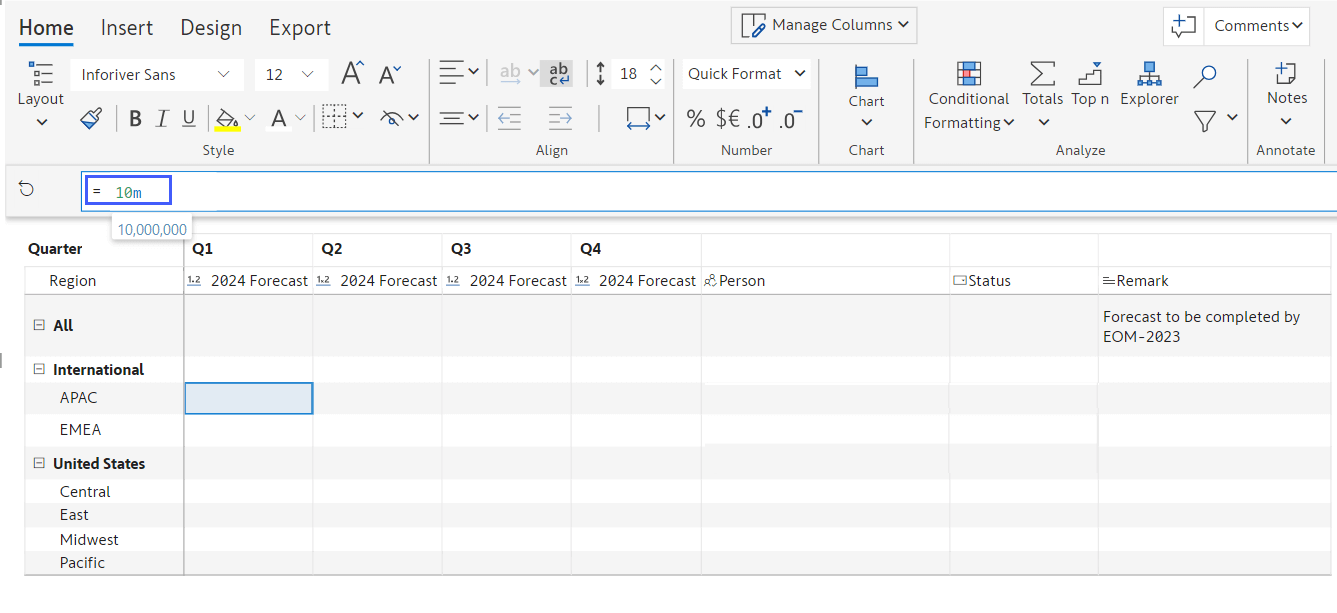
6. Let us start entering our forecasts now. Double-click the value for Q1 for the APAC region. A formula bar appears above the table. Type in ‘10m’ in the formula bar.
7. Press enter, and the APAC values automatically roll up to International region and All (company level). Isn’t it great to have hierarchical budgeting templates without writing formulae at each parent level?
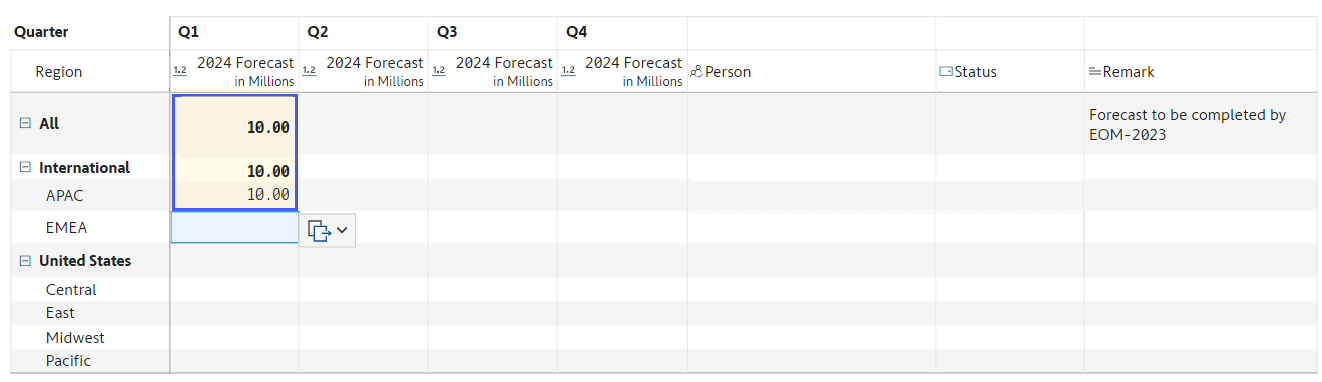
8. Similarly, go ahead & fill out values for the other granular regions. Assign people & status fields to each row.
Note that while we entered all the values ourselves, you can let other users in the organization enter values for their respective regions.
We have created a sales forecast using a blank template in Power BI. In the upcoming blogs, we will explore how to create forecasts in several other ways.
Get your copy of Inforiver Matrix today and try it for yourself. Learn more about Forecasting in Power BI here.

Inforiver helps enterprises consolidate planning, reporting & analytics on a single platform (Power BI). The no-code, self-service award-winning platform has been recognized as the industry’s best and is adopted by many Fortune 100 firms.
Inforiver is a product of Lumel, the #1 Power BI AppSource Partner. The firm serves over 3,000 customers worldwide through its portfolio of products offered under the brands Inforiver, EDITable, ValQ, and xViz.


