
Upcoming webinar on 'Inforiver Charts : The fastest way to deliver stories in Power BI', Aug 29th , Monday, 10.30 AM CST. Register Now
Upcoming webinar on 'Inforiver Charts : The fastest way to deliver stories in Power BI', Aug 29th , Monday, 10.30 AM CST. Register Now
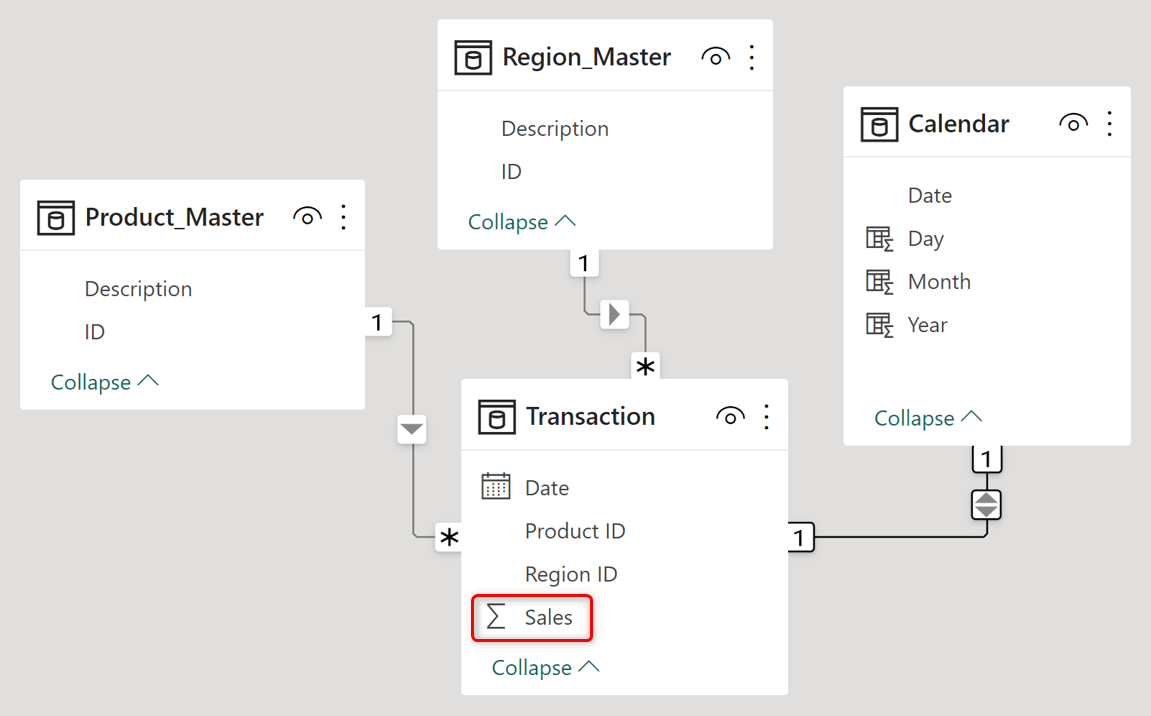
Star schema is one of the most common data warehousing techniques used to organize and structure data for efficient querying and analysis. Shown below in the image is a typical star schema (from a Power BI report), where we have Region, Product and Calendar dimension tables, and one fact/transaction table with measures (we have one measure here – Sales). Such dimensional models work exceptionally well for slice & dice analysis.
Let us assume we need to calculate sales variance across time periods, say 2023 vs 2022. How would you do it?
In Power BI, one accomplishes this by creating additional DAX measures. For example, create 2023 Sales, 2022 Sales, Variance and Variance % as shown below (highlighted in the blue table). These measures are further used in the charts or tables as shown on the right.
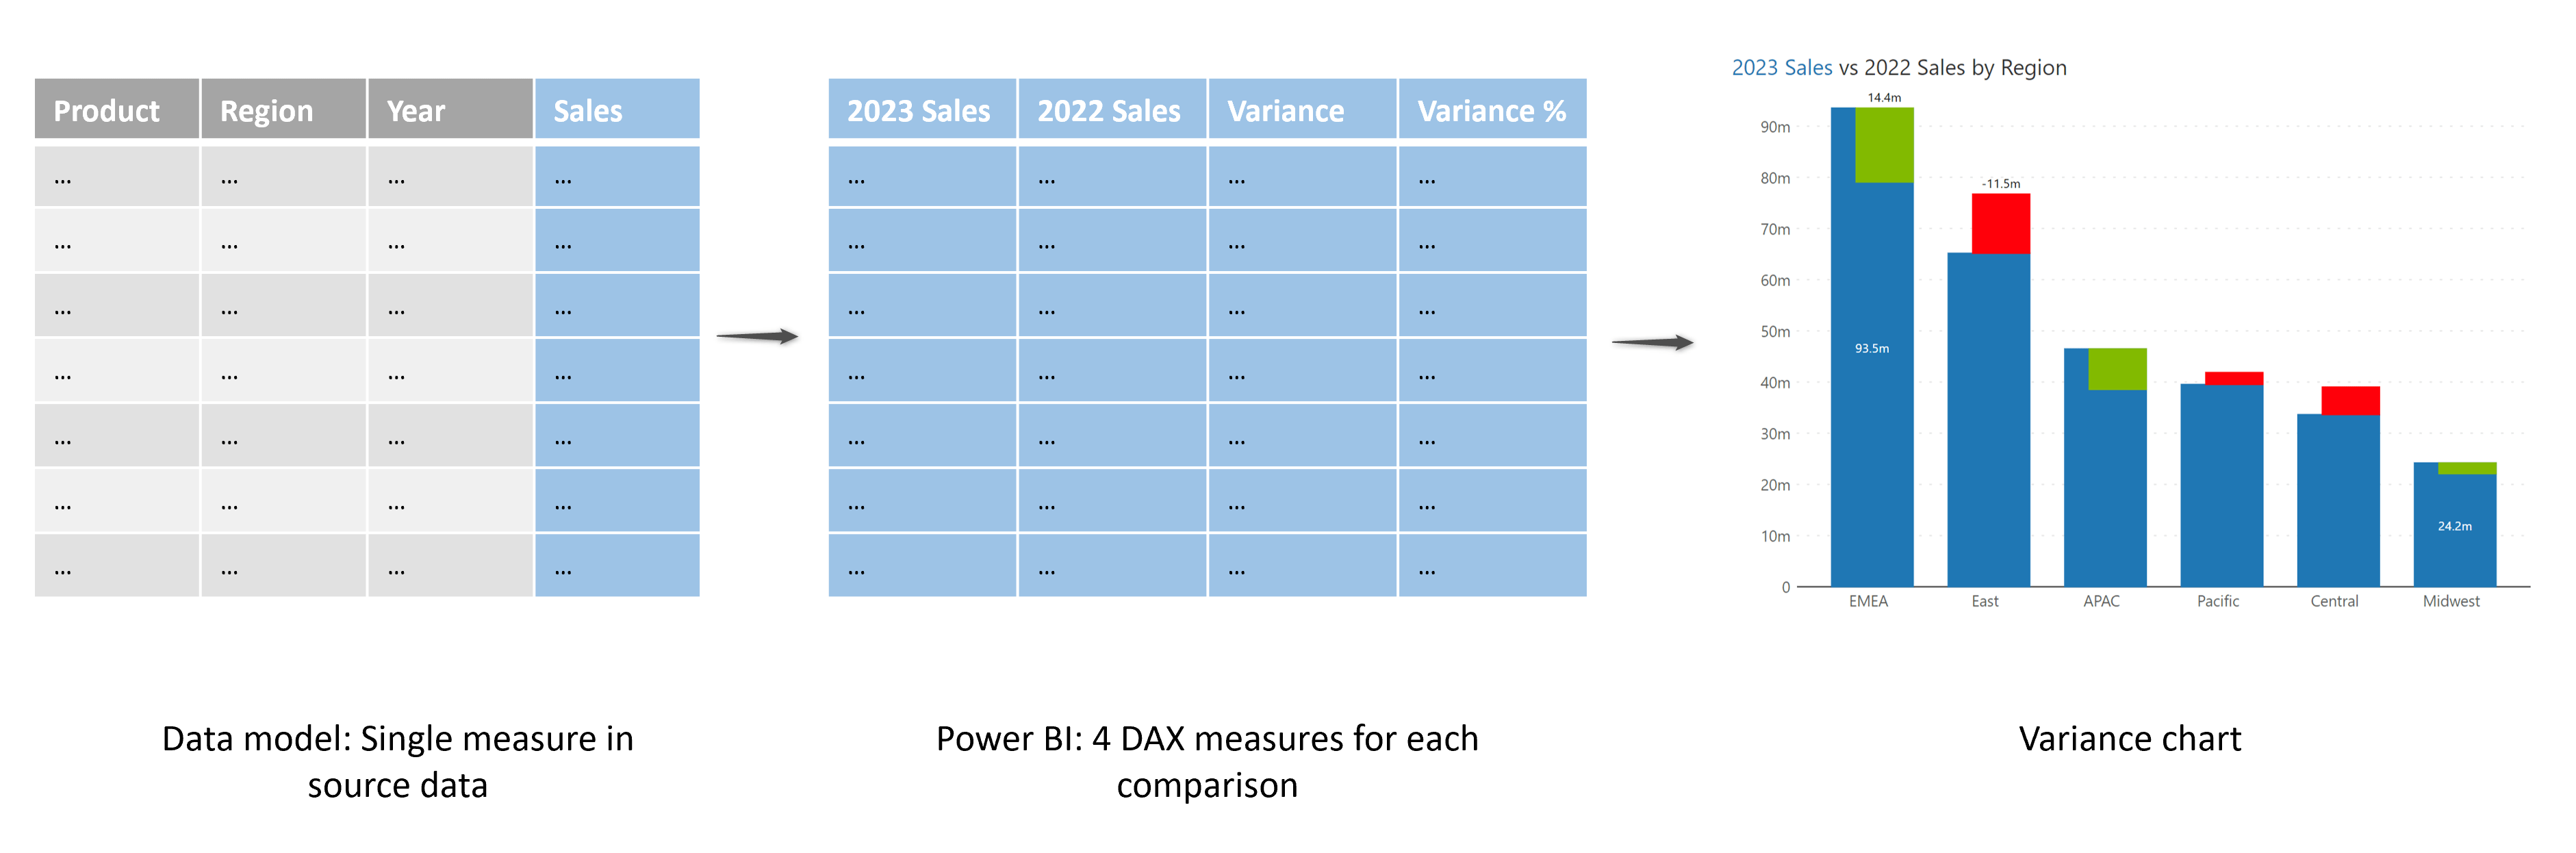
There is one major practical drawback with this approach– it simply does not scale up. For example, if you would like to visualize variances for Q4vs Q3, or 2022 vs. 2021, you need to repeat the process by creating additional measures. When we enter into a new fiscal year, say, 2024, new DAX measures need to be created too.
Come to think of it – such variance measures do not belong in a data warehouse either. A measure like 2023 Sales is a combination of a fact (Sales) and dimension value (2023). In which table would you assign it?
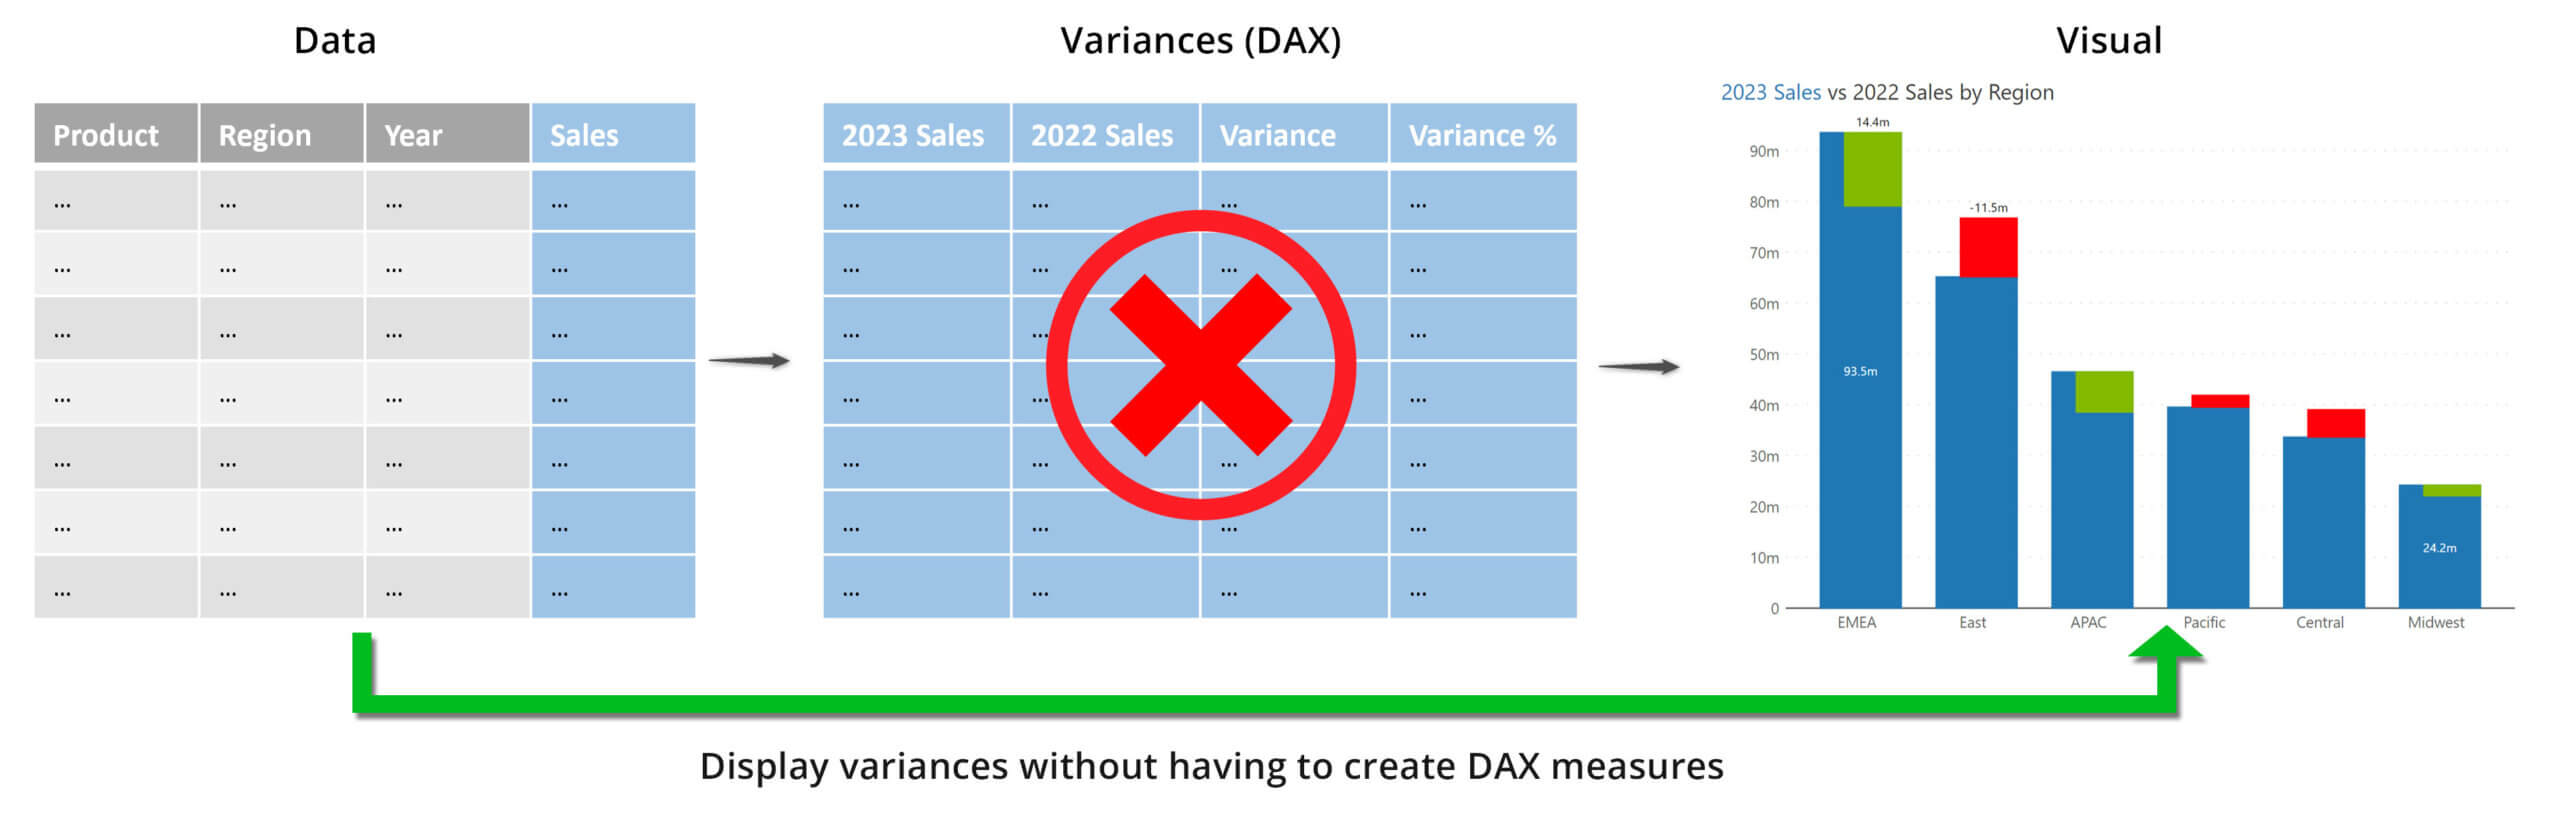
Fortunately, Inforiver simplifies the process for you. You can create variances for any given measure, without the need to create additional DAX measures.
The process using Inforiver looks as follows. You have the original facts and dimensions, and you can directly create variance calculations on the fly.
How does it work?
Well, let us take the following example where we need to perform a YoY variance analysis.
1. Assign the ‘Region’, ‘Year’ and ‘Sales’ fields to Inforiver matrix as shown below. Your table will display data for all the years in the model, one column for each year.

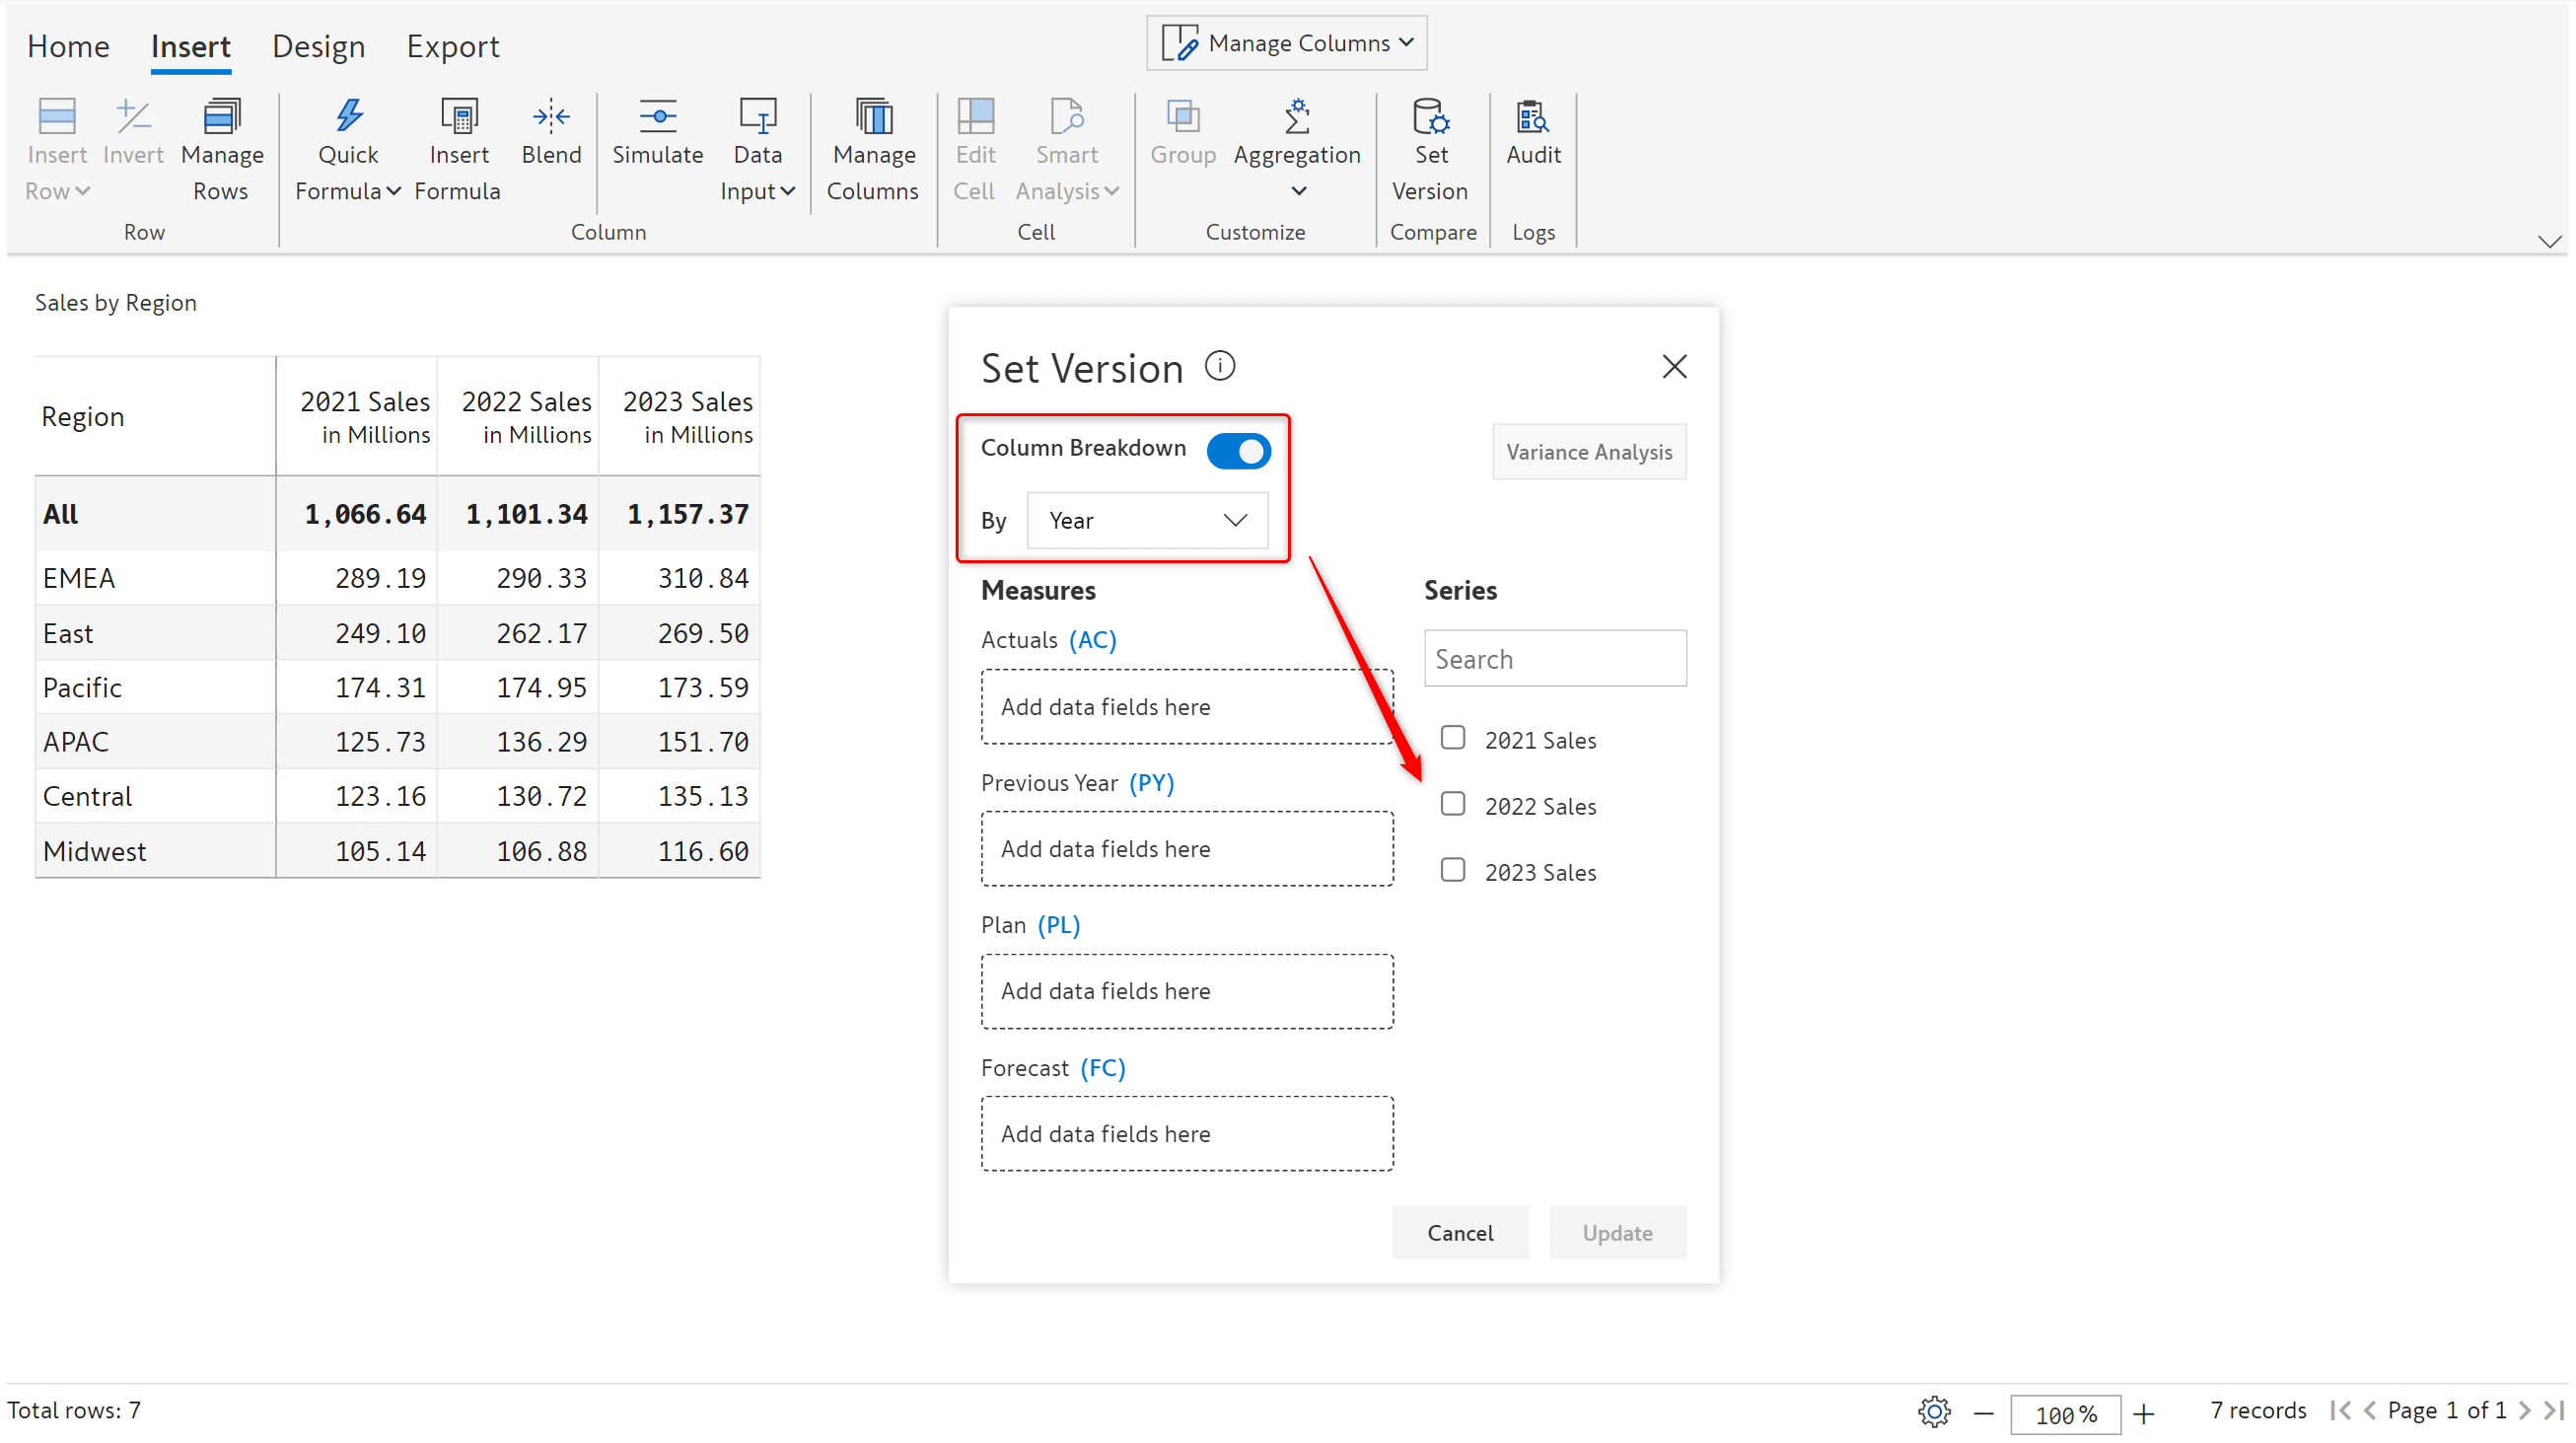
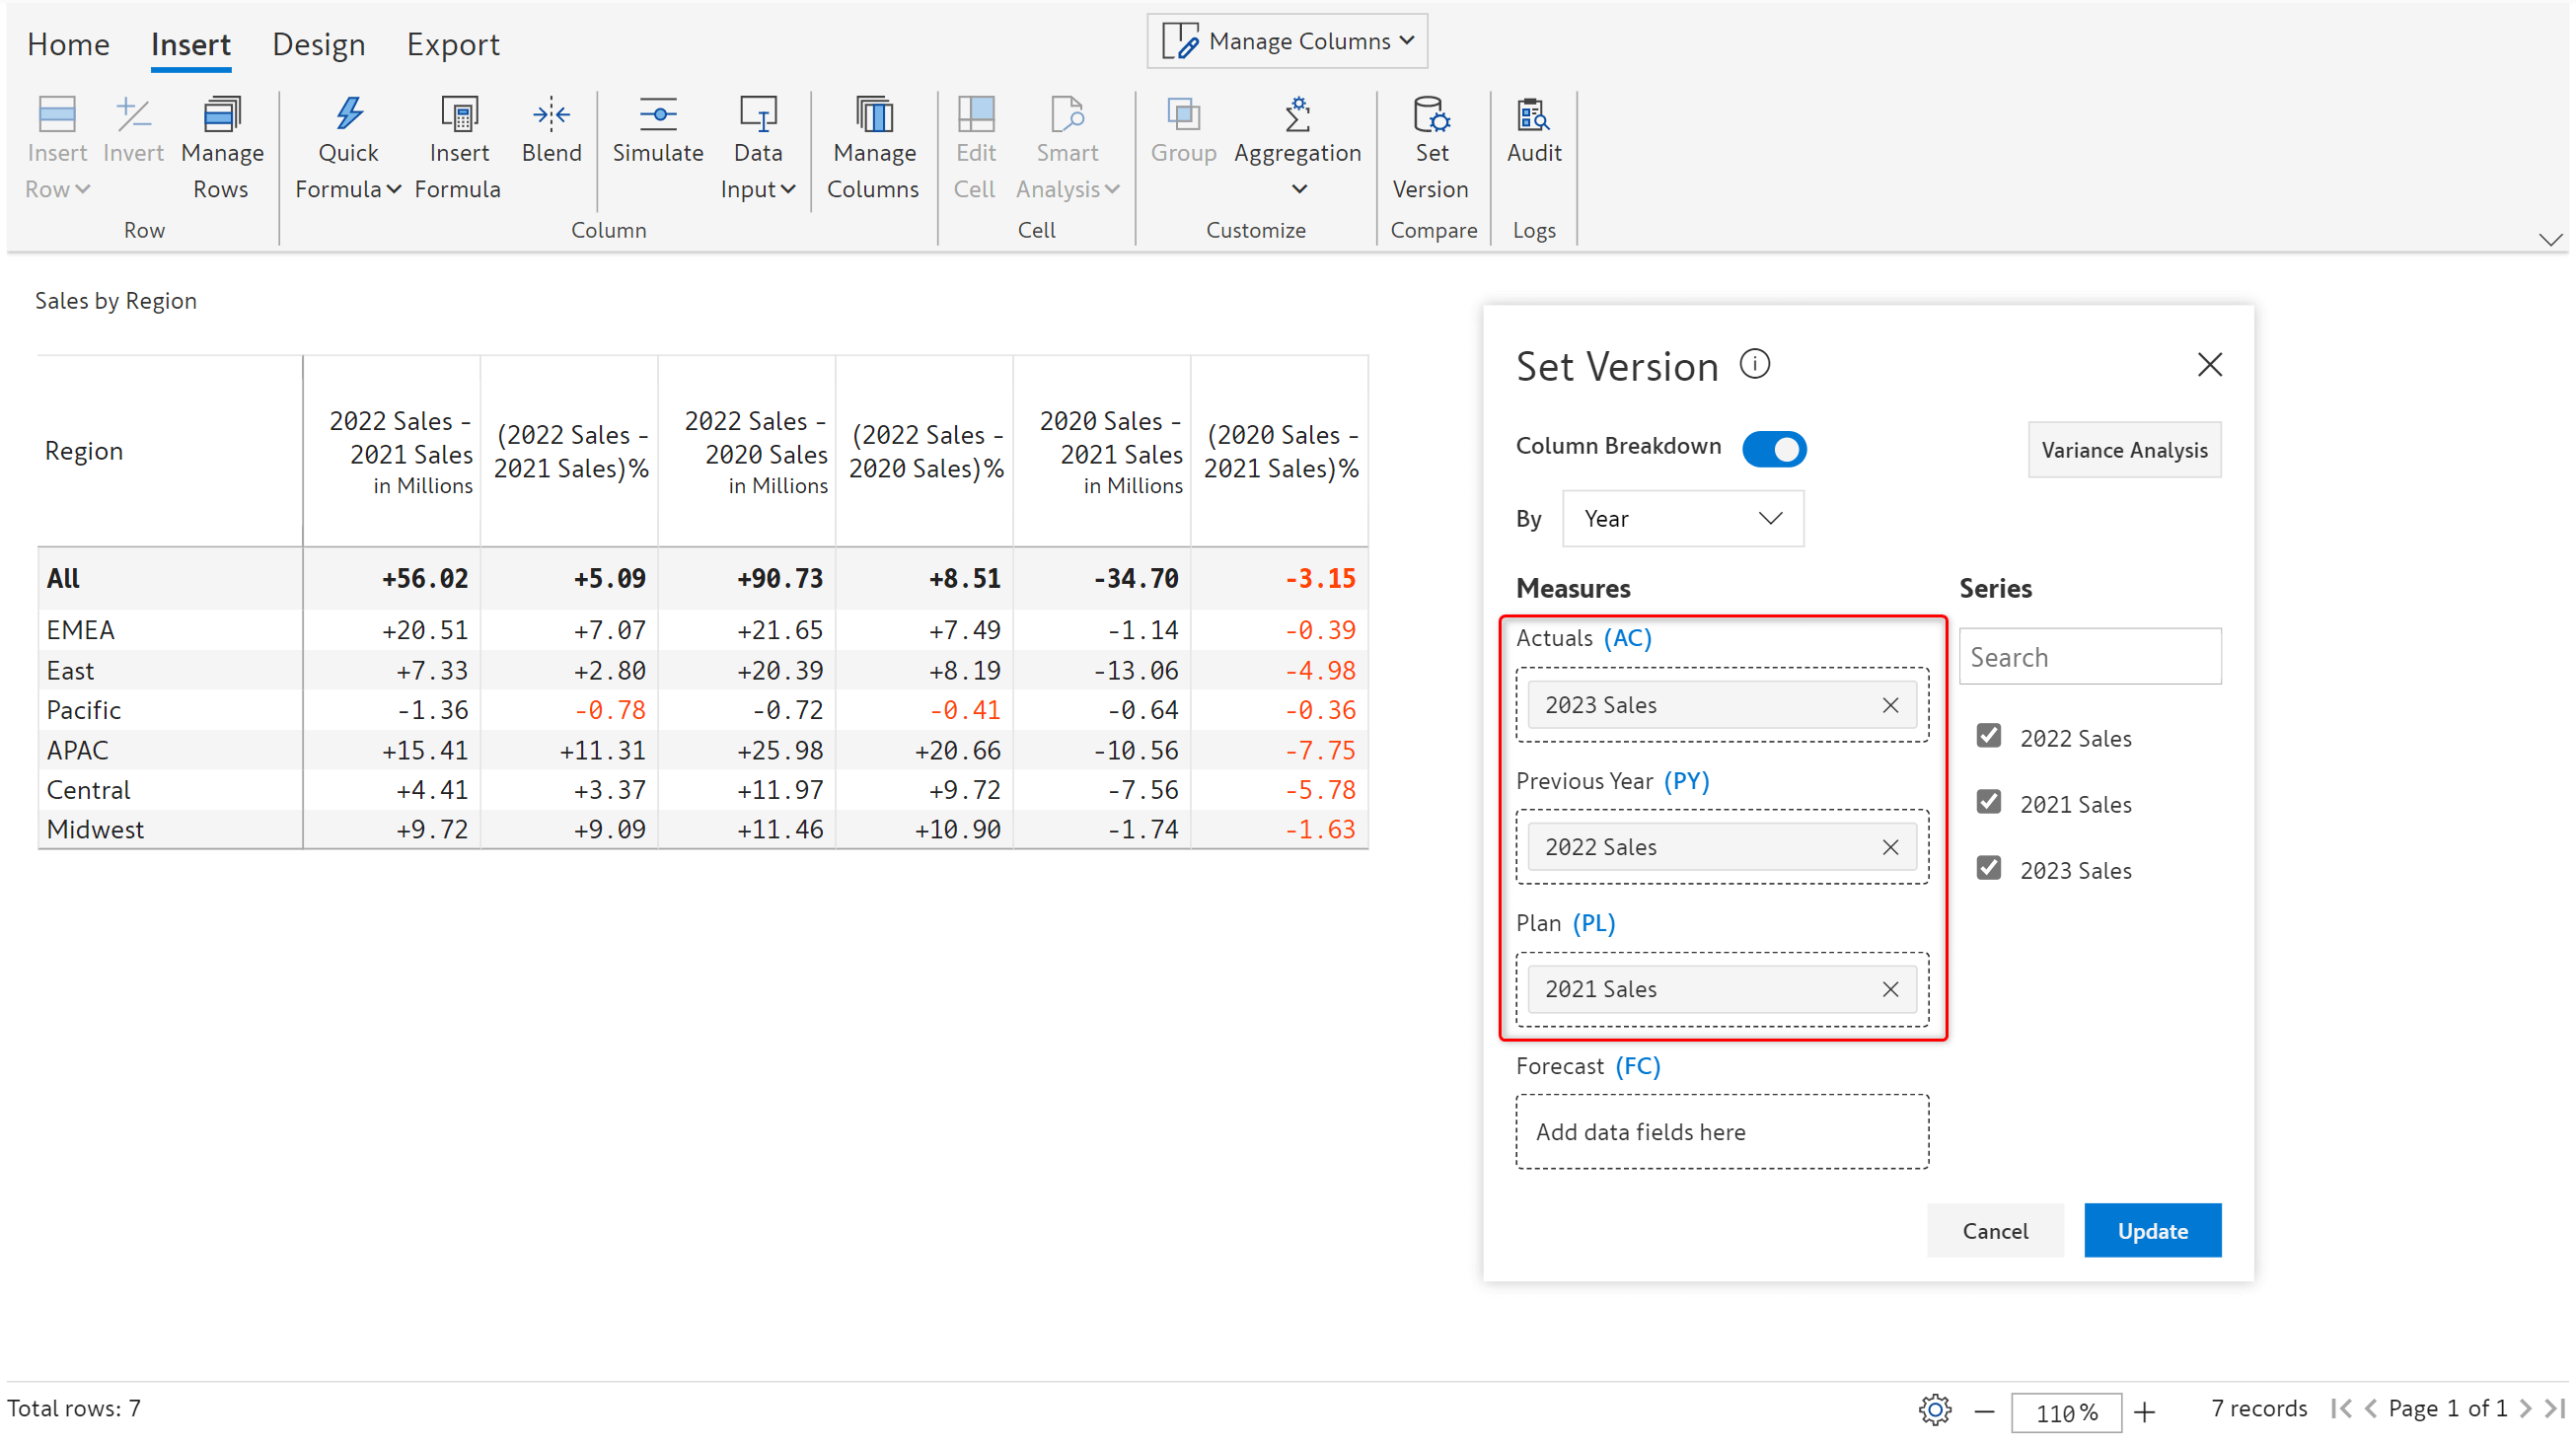
2. Go to the ‘Insert’ tab in the toolbar, click on ‘Set version’. A dialog box opens up.
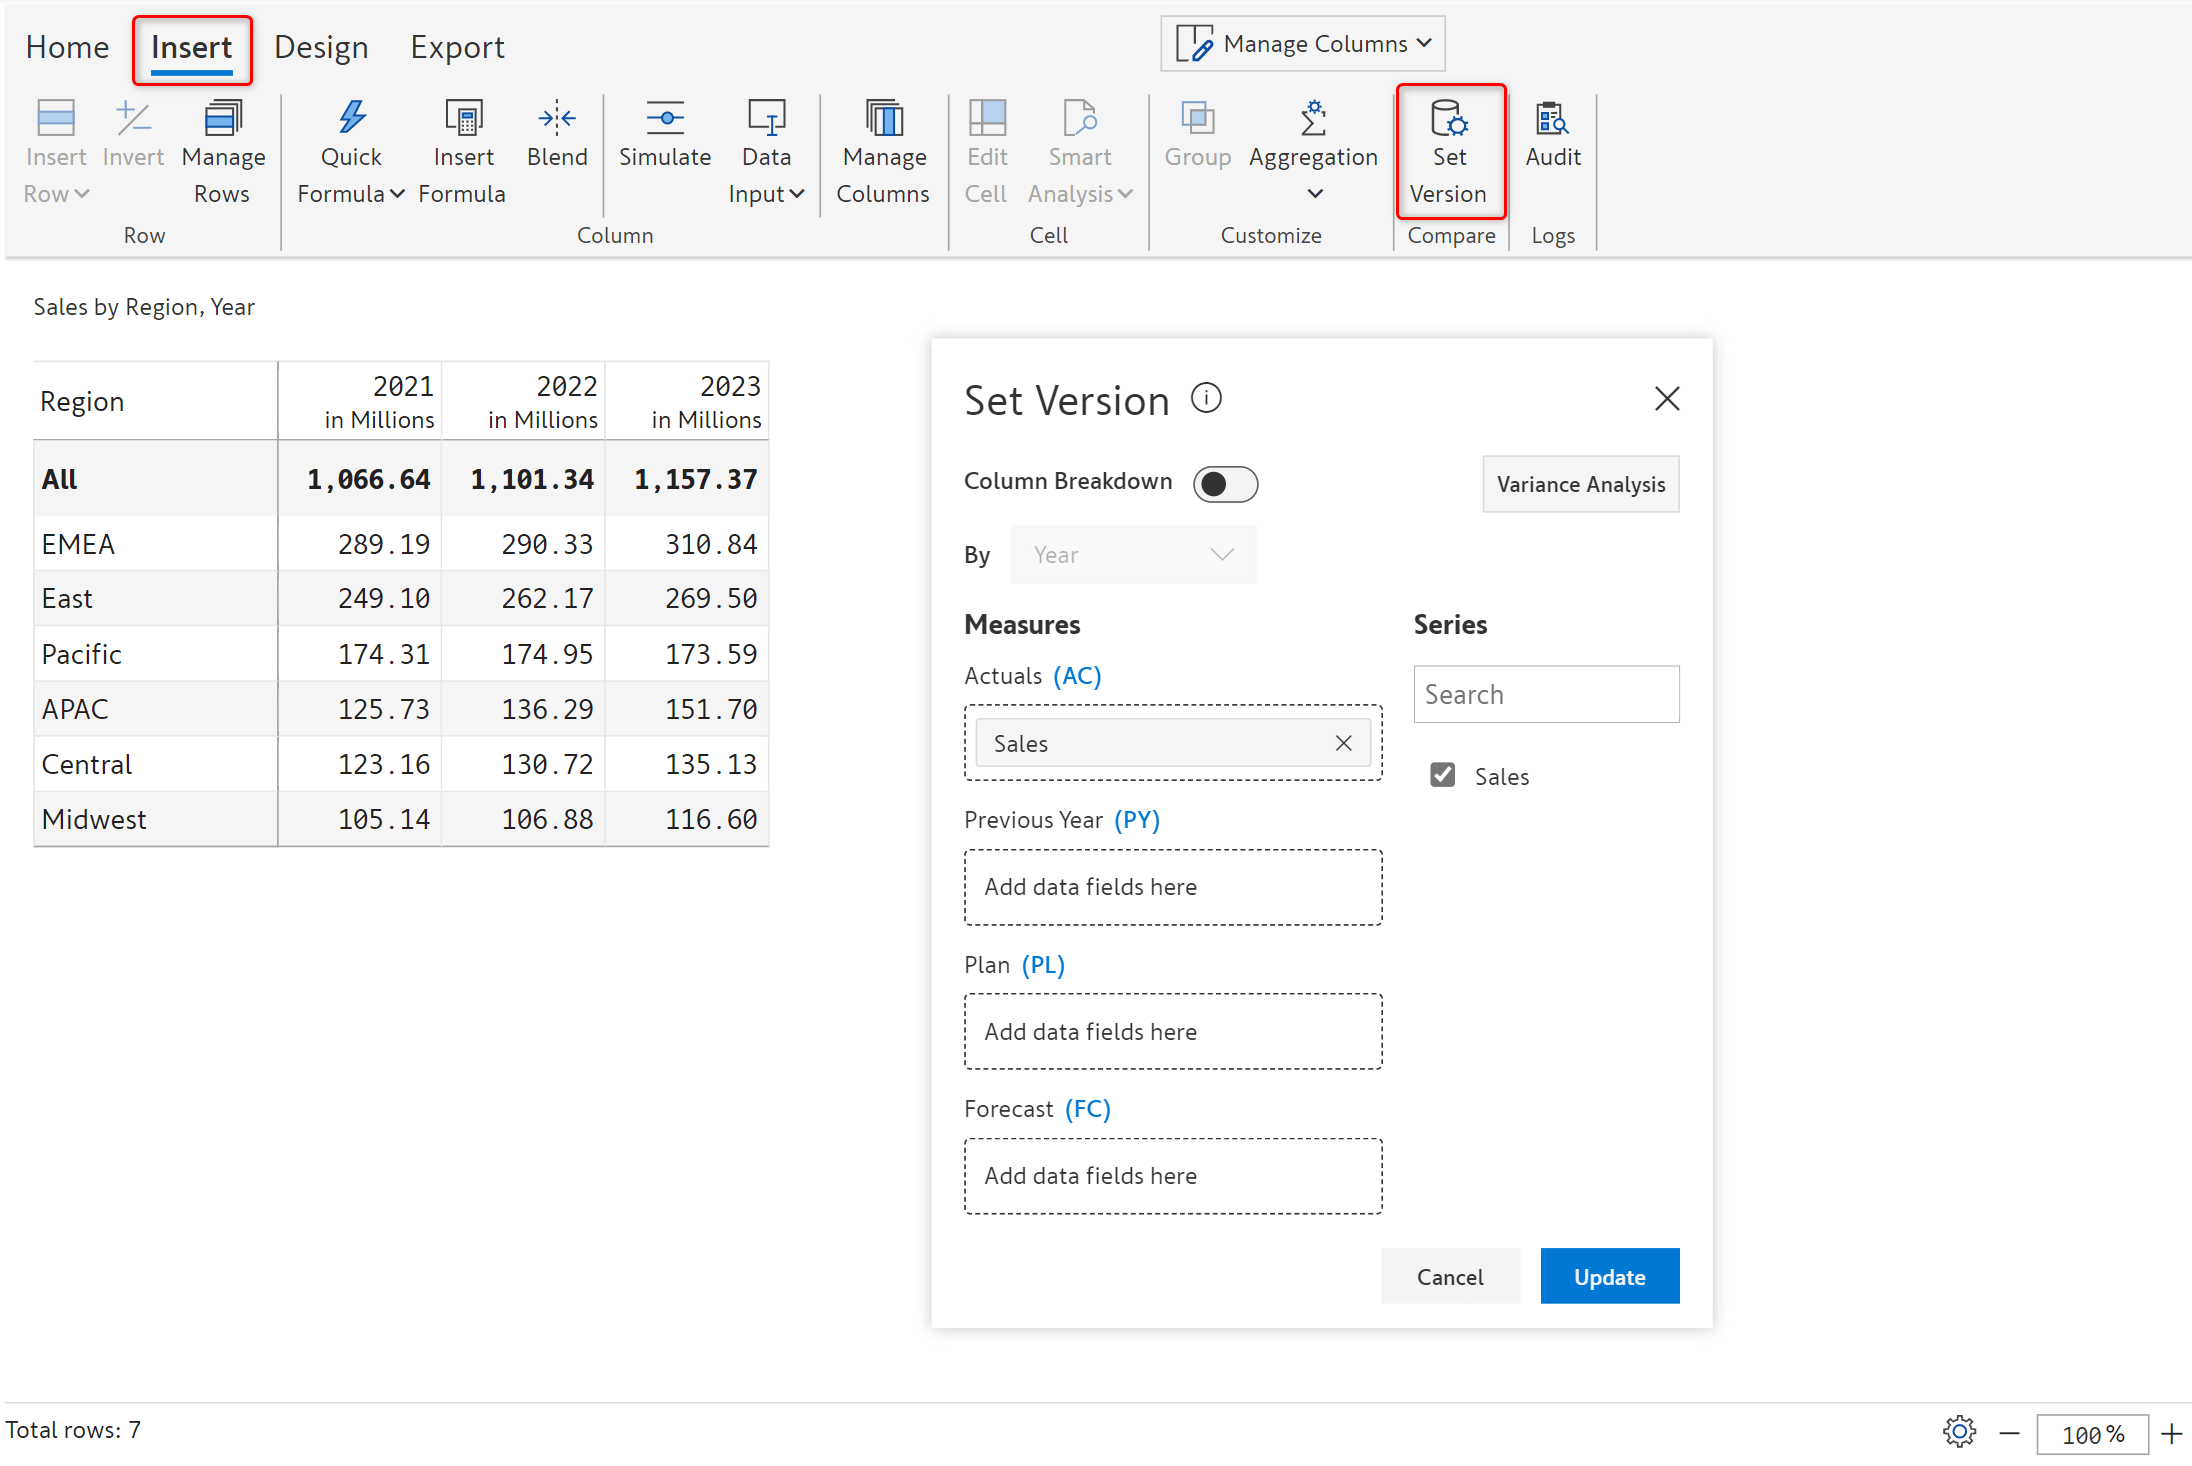
3. By default, the ‘Column Breakdown’ is set to off. Turn it on. Inforiver creates three measures (at the visual level), one for each year. These (virtual and visual-level) measures are also listed on the right below ‘Series’.
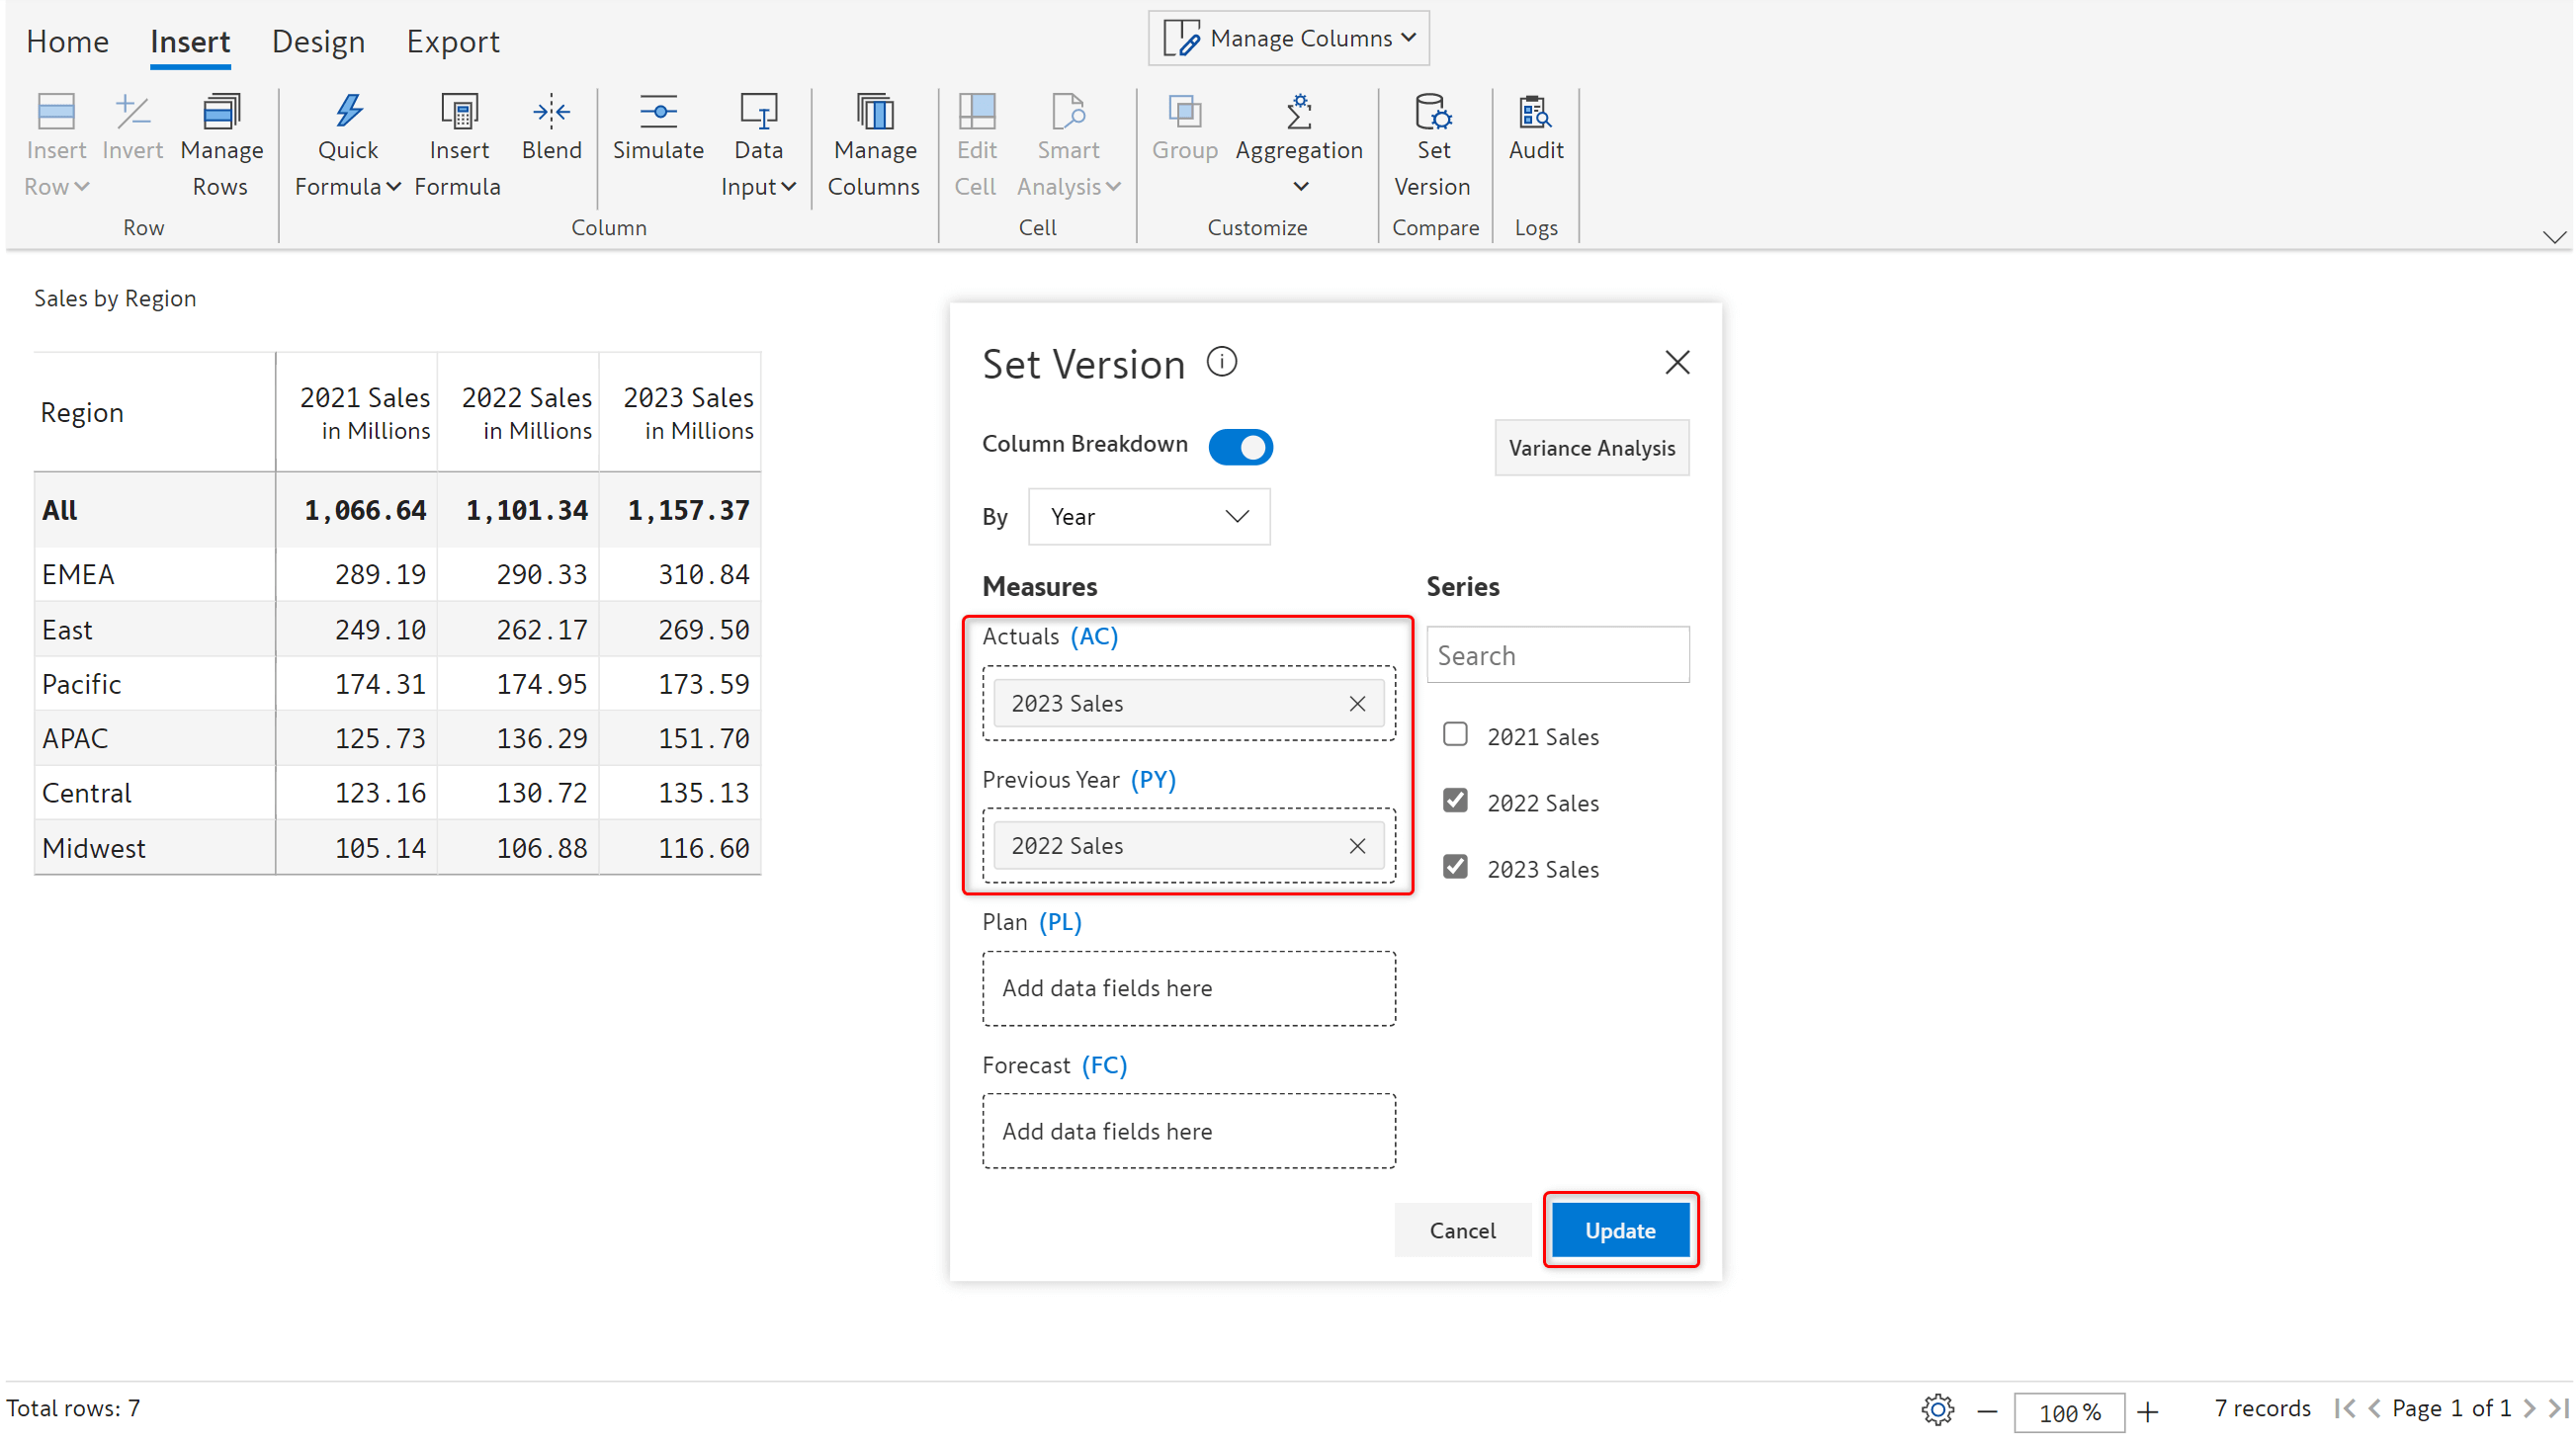
4. To calculate the variance between 2023 Sales and 2022 Sales, assign 2023 Sales to ‘Actuals (AC)’ and 2022 Sales to ‘Previous Year (PY)’. As you assign them, the checkboxes against the measures are turned on.
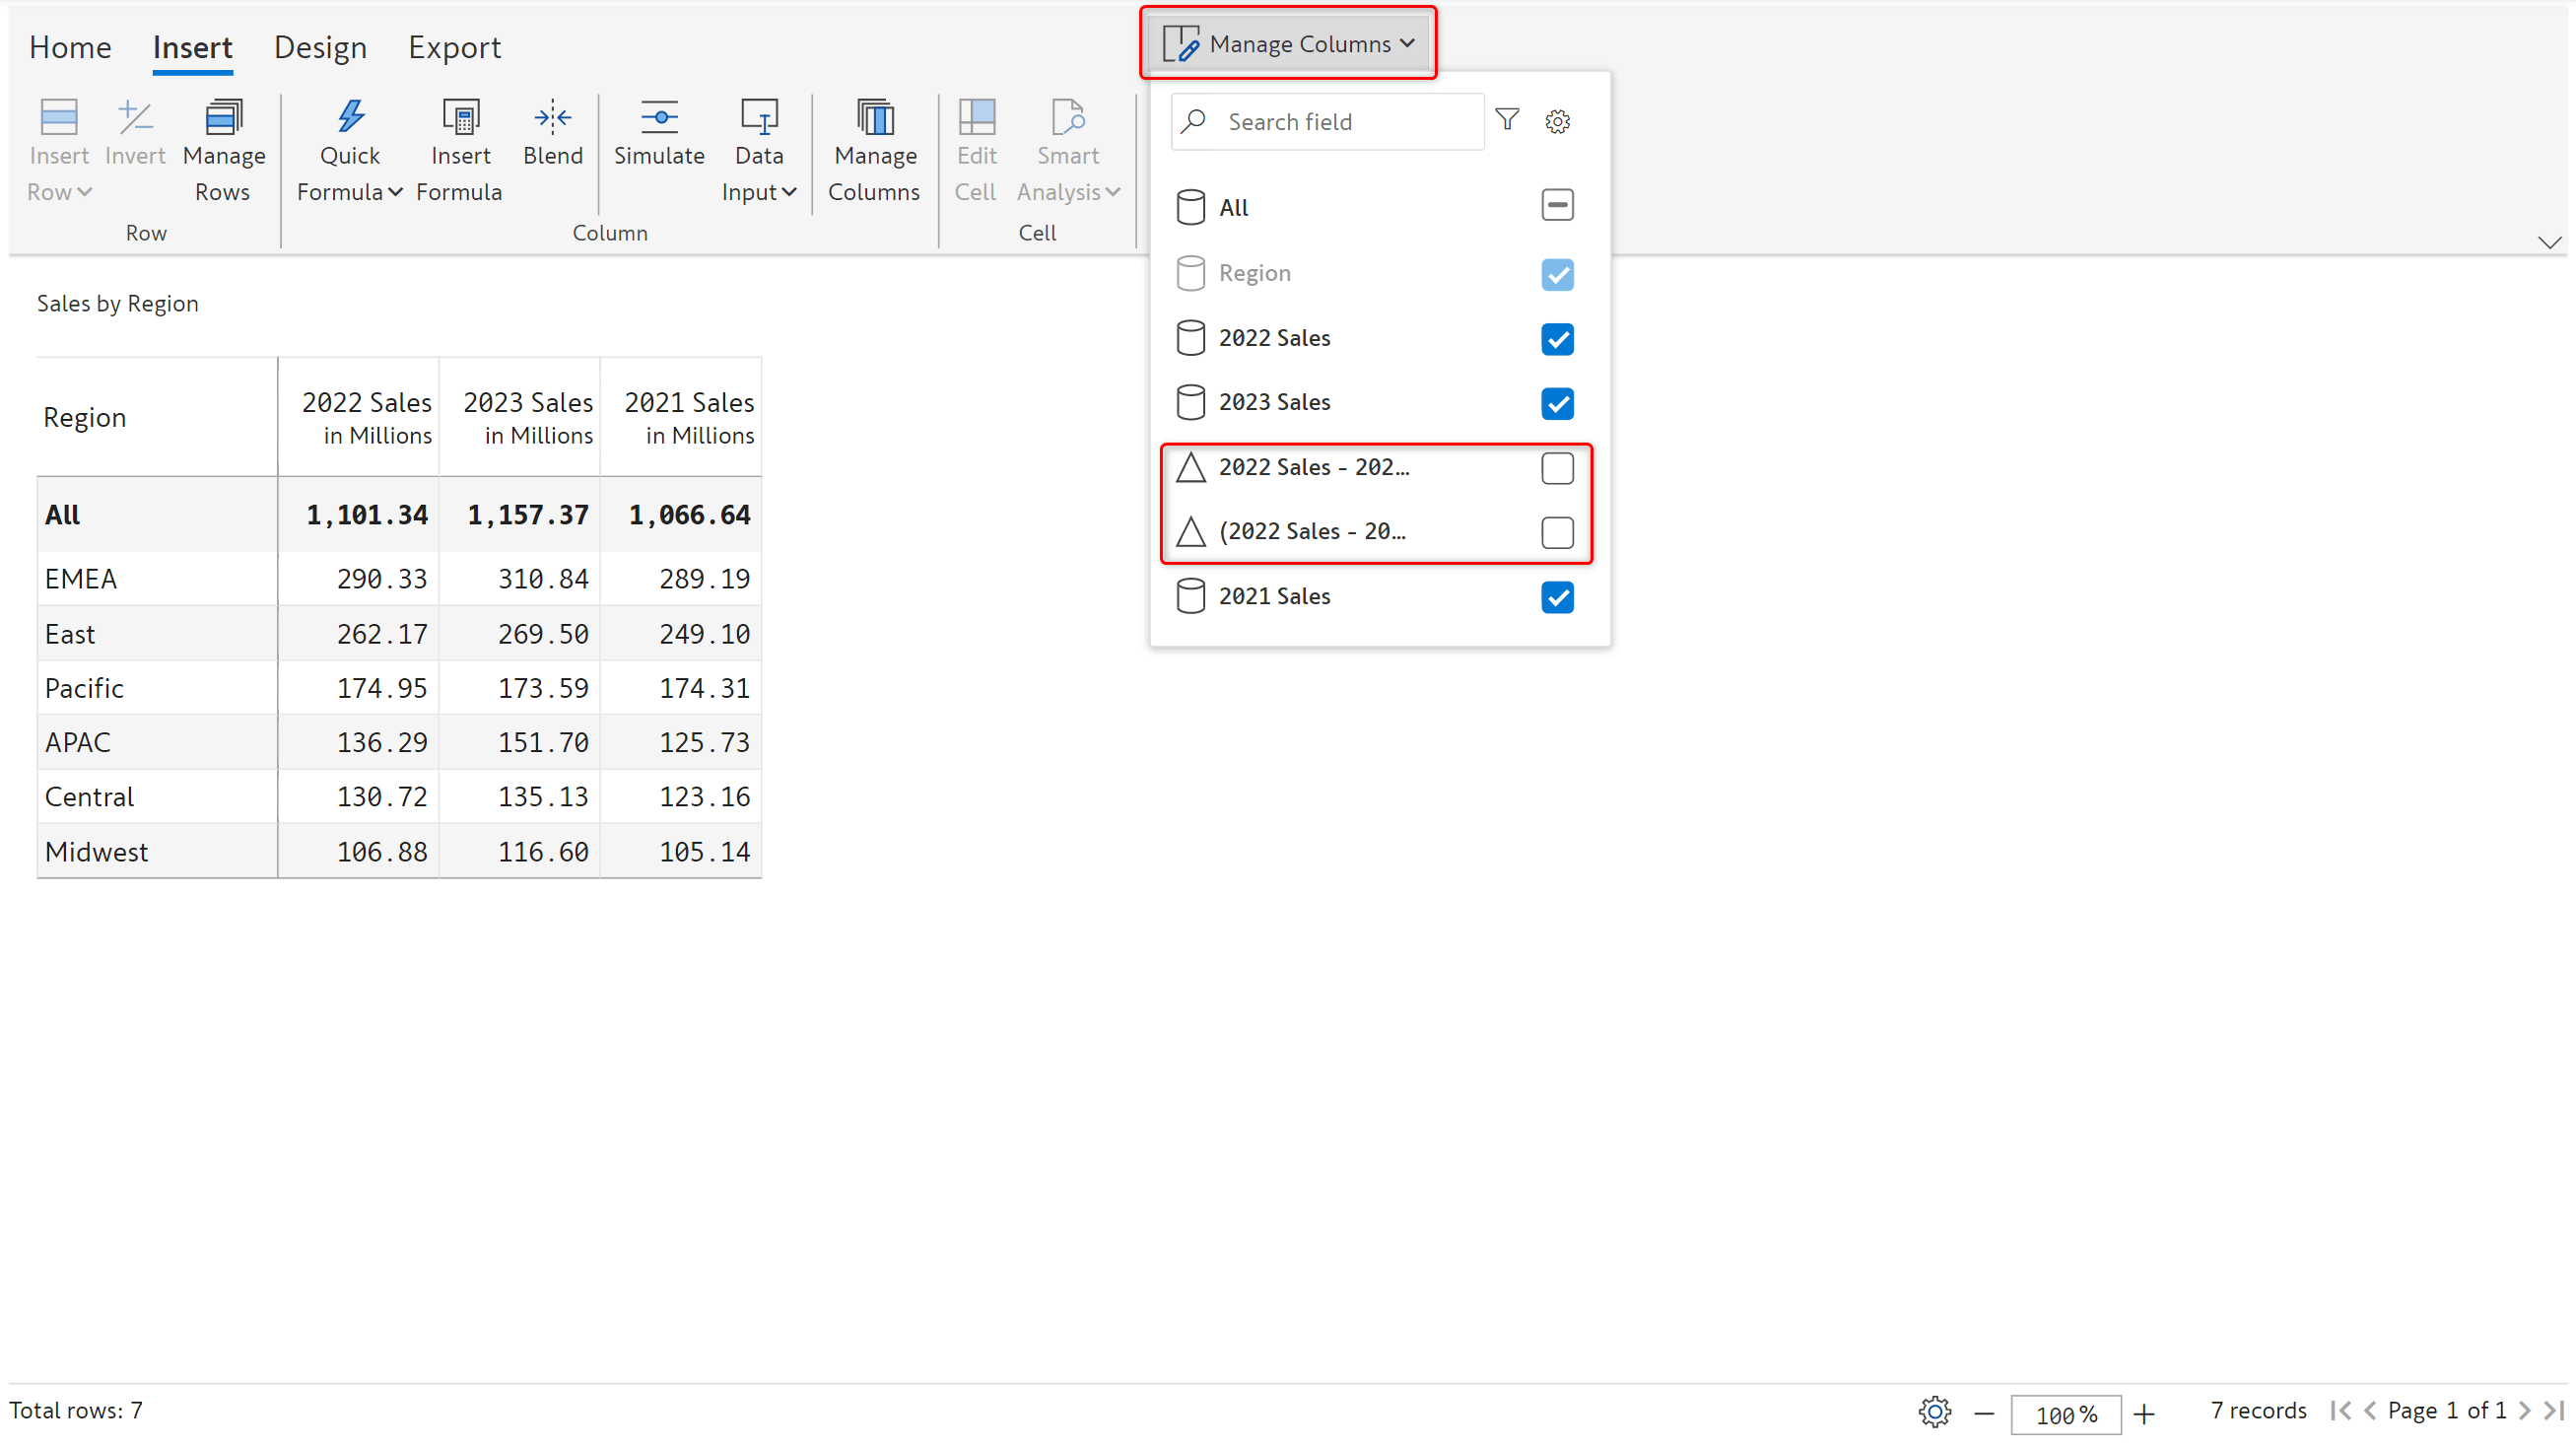
5. The table will not undergo any additional changes for now. However, the preceding steps have automatically created variances and we just need to ‘show’ them in the table. Click on ‘Manage columns’ in the toolbar. You will notice the two variance columns (which are hidden by default).
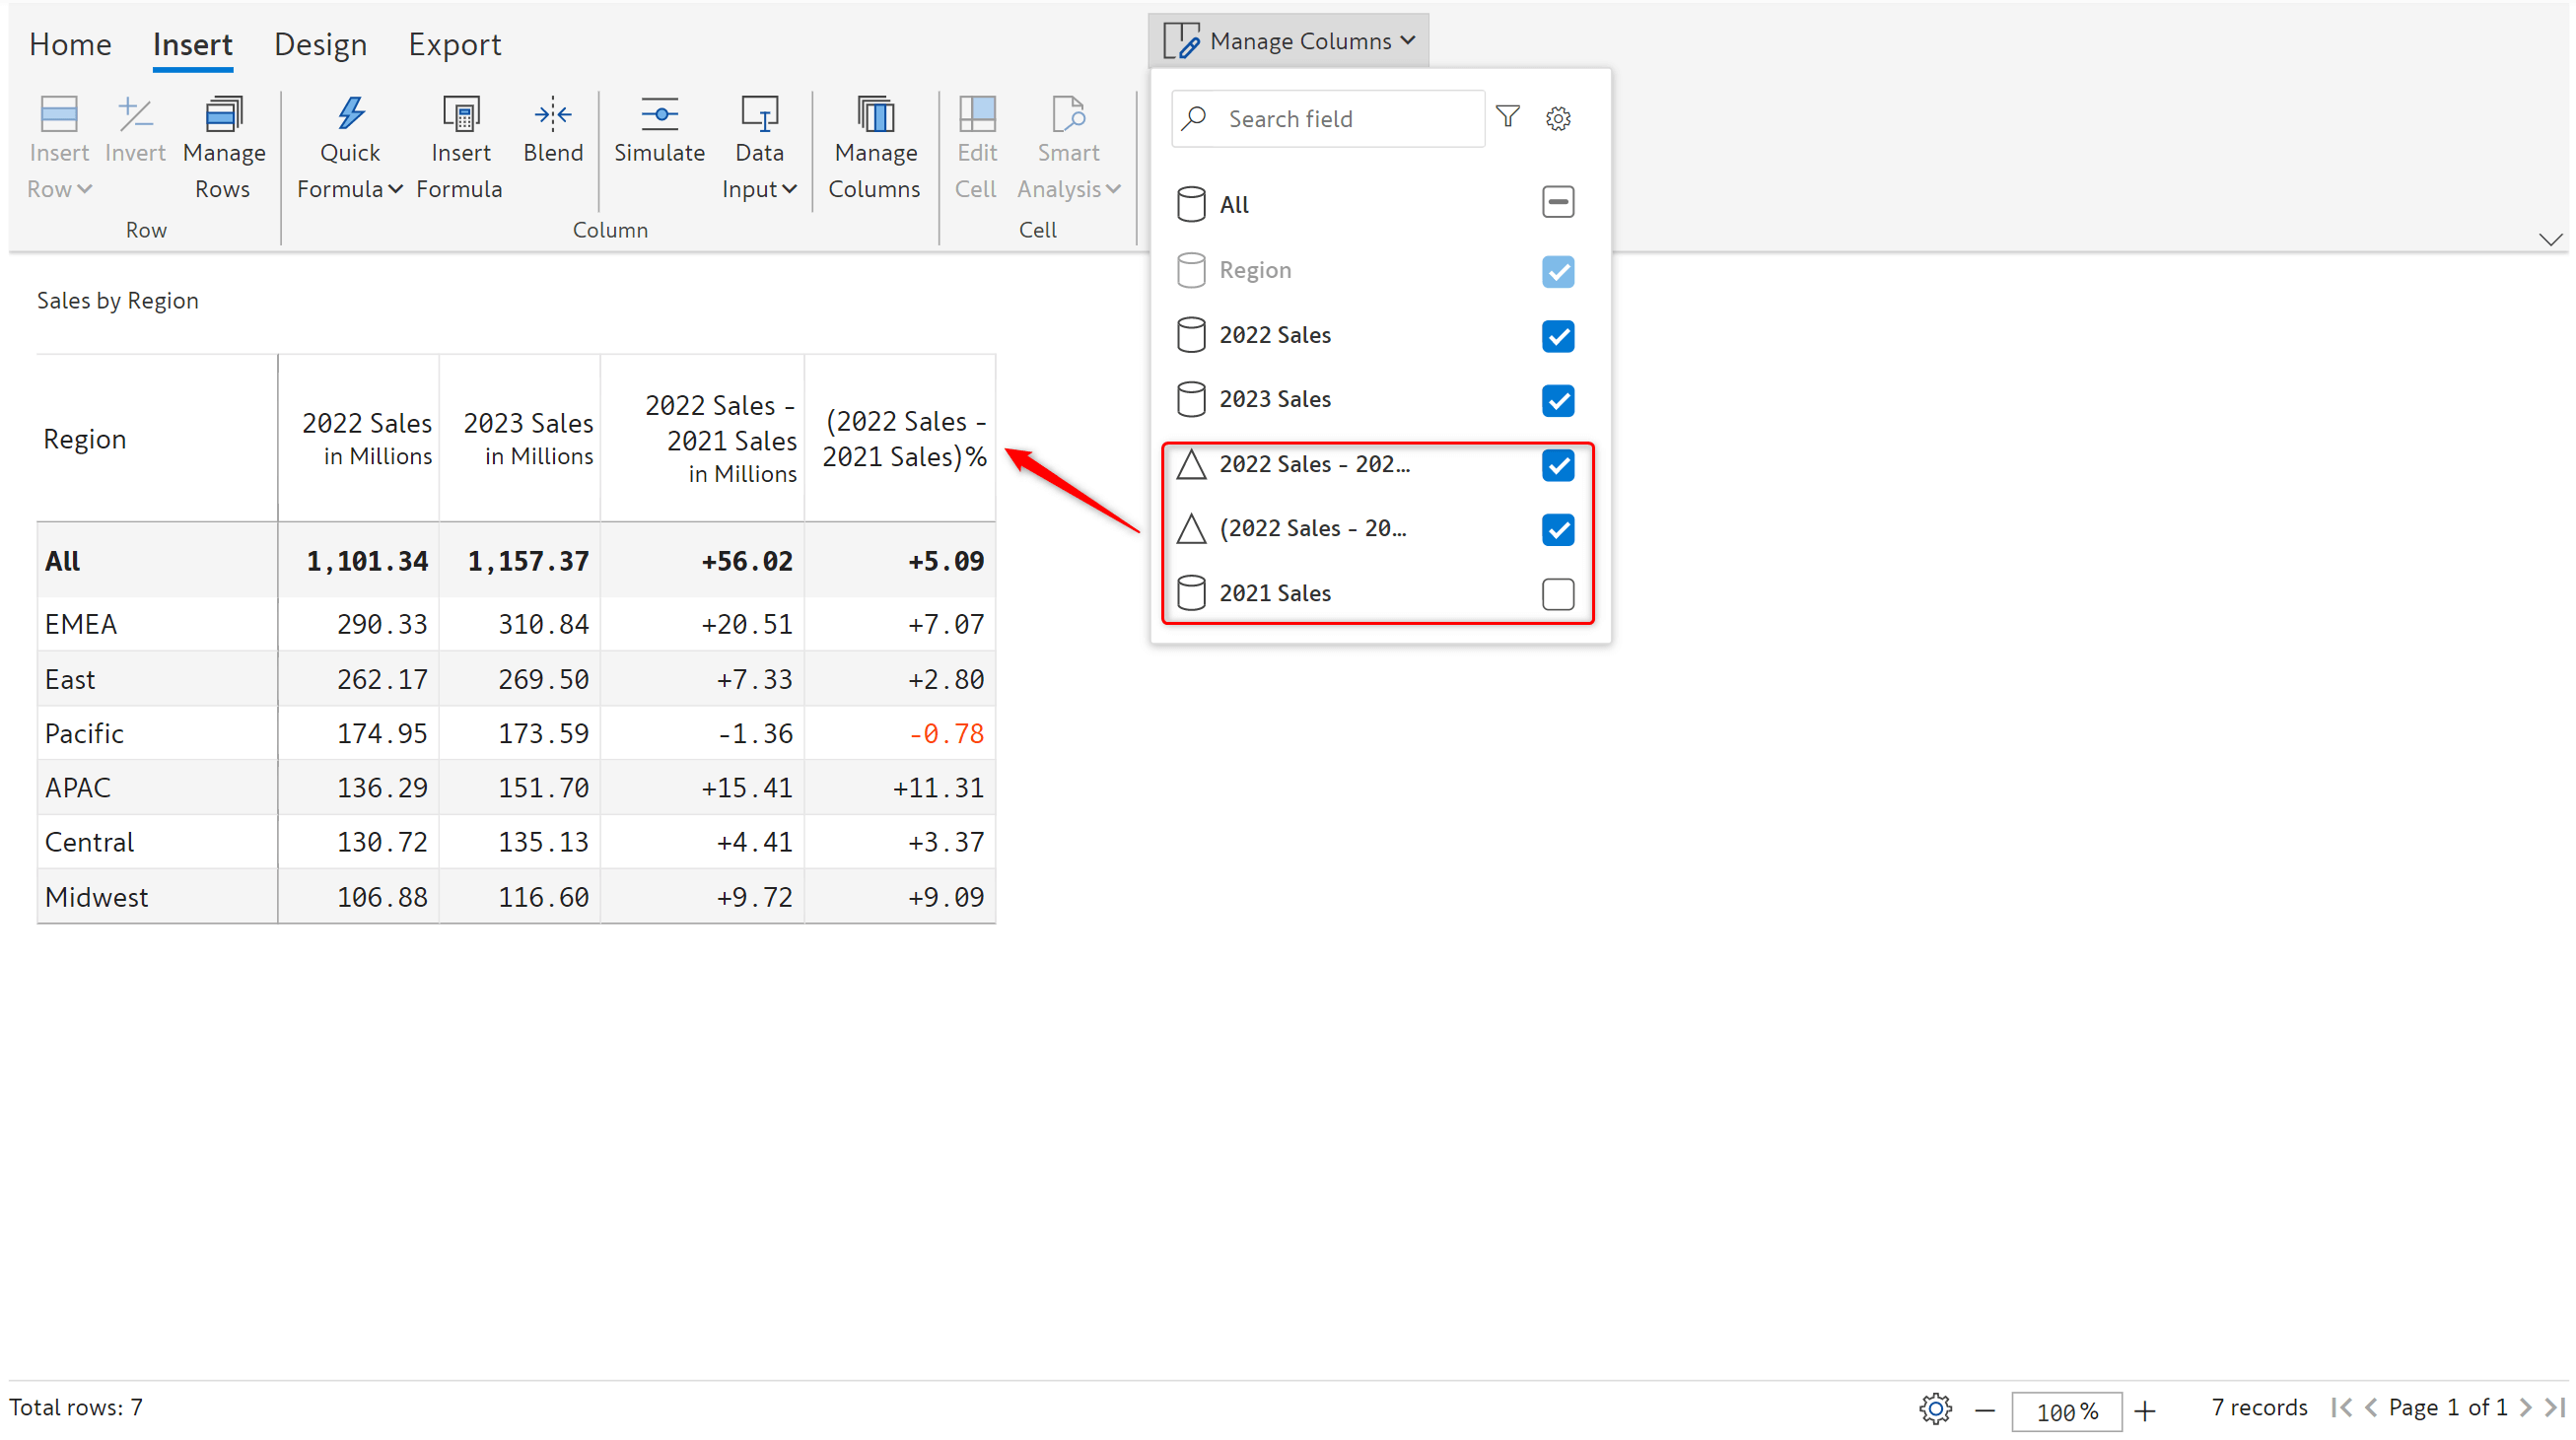
6. Show/hide the columns as you need. In our example, we’ll enable the variance columns and hide the 2021 Sales. The table gets automatically updated.
7. Note that you can create variances for up to 4 measures using ‘Set version’. In this example, if you can assign ‘2021 Sales’ to ‘Plan (PL)’, Inforiver creates 6 variance measures – or 3 pairs (absolute and % variance) with one each for Actuals vs. Prior year, Actuals vs Plan, and Prior Year vs. Plan. All of this without writing a single line of DAX.
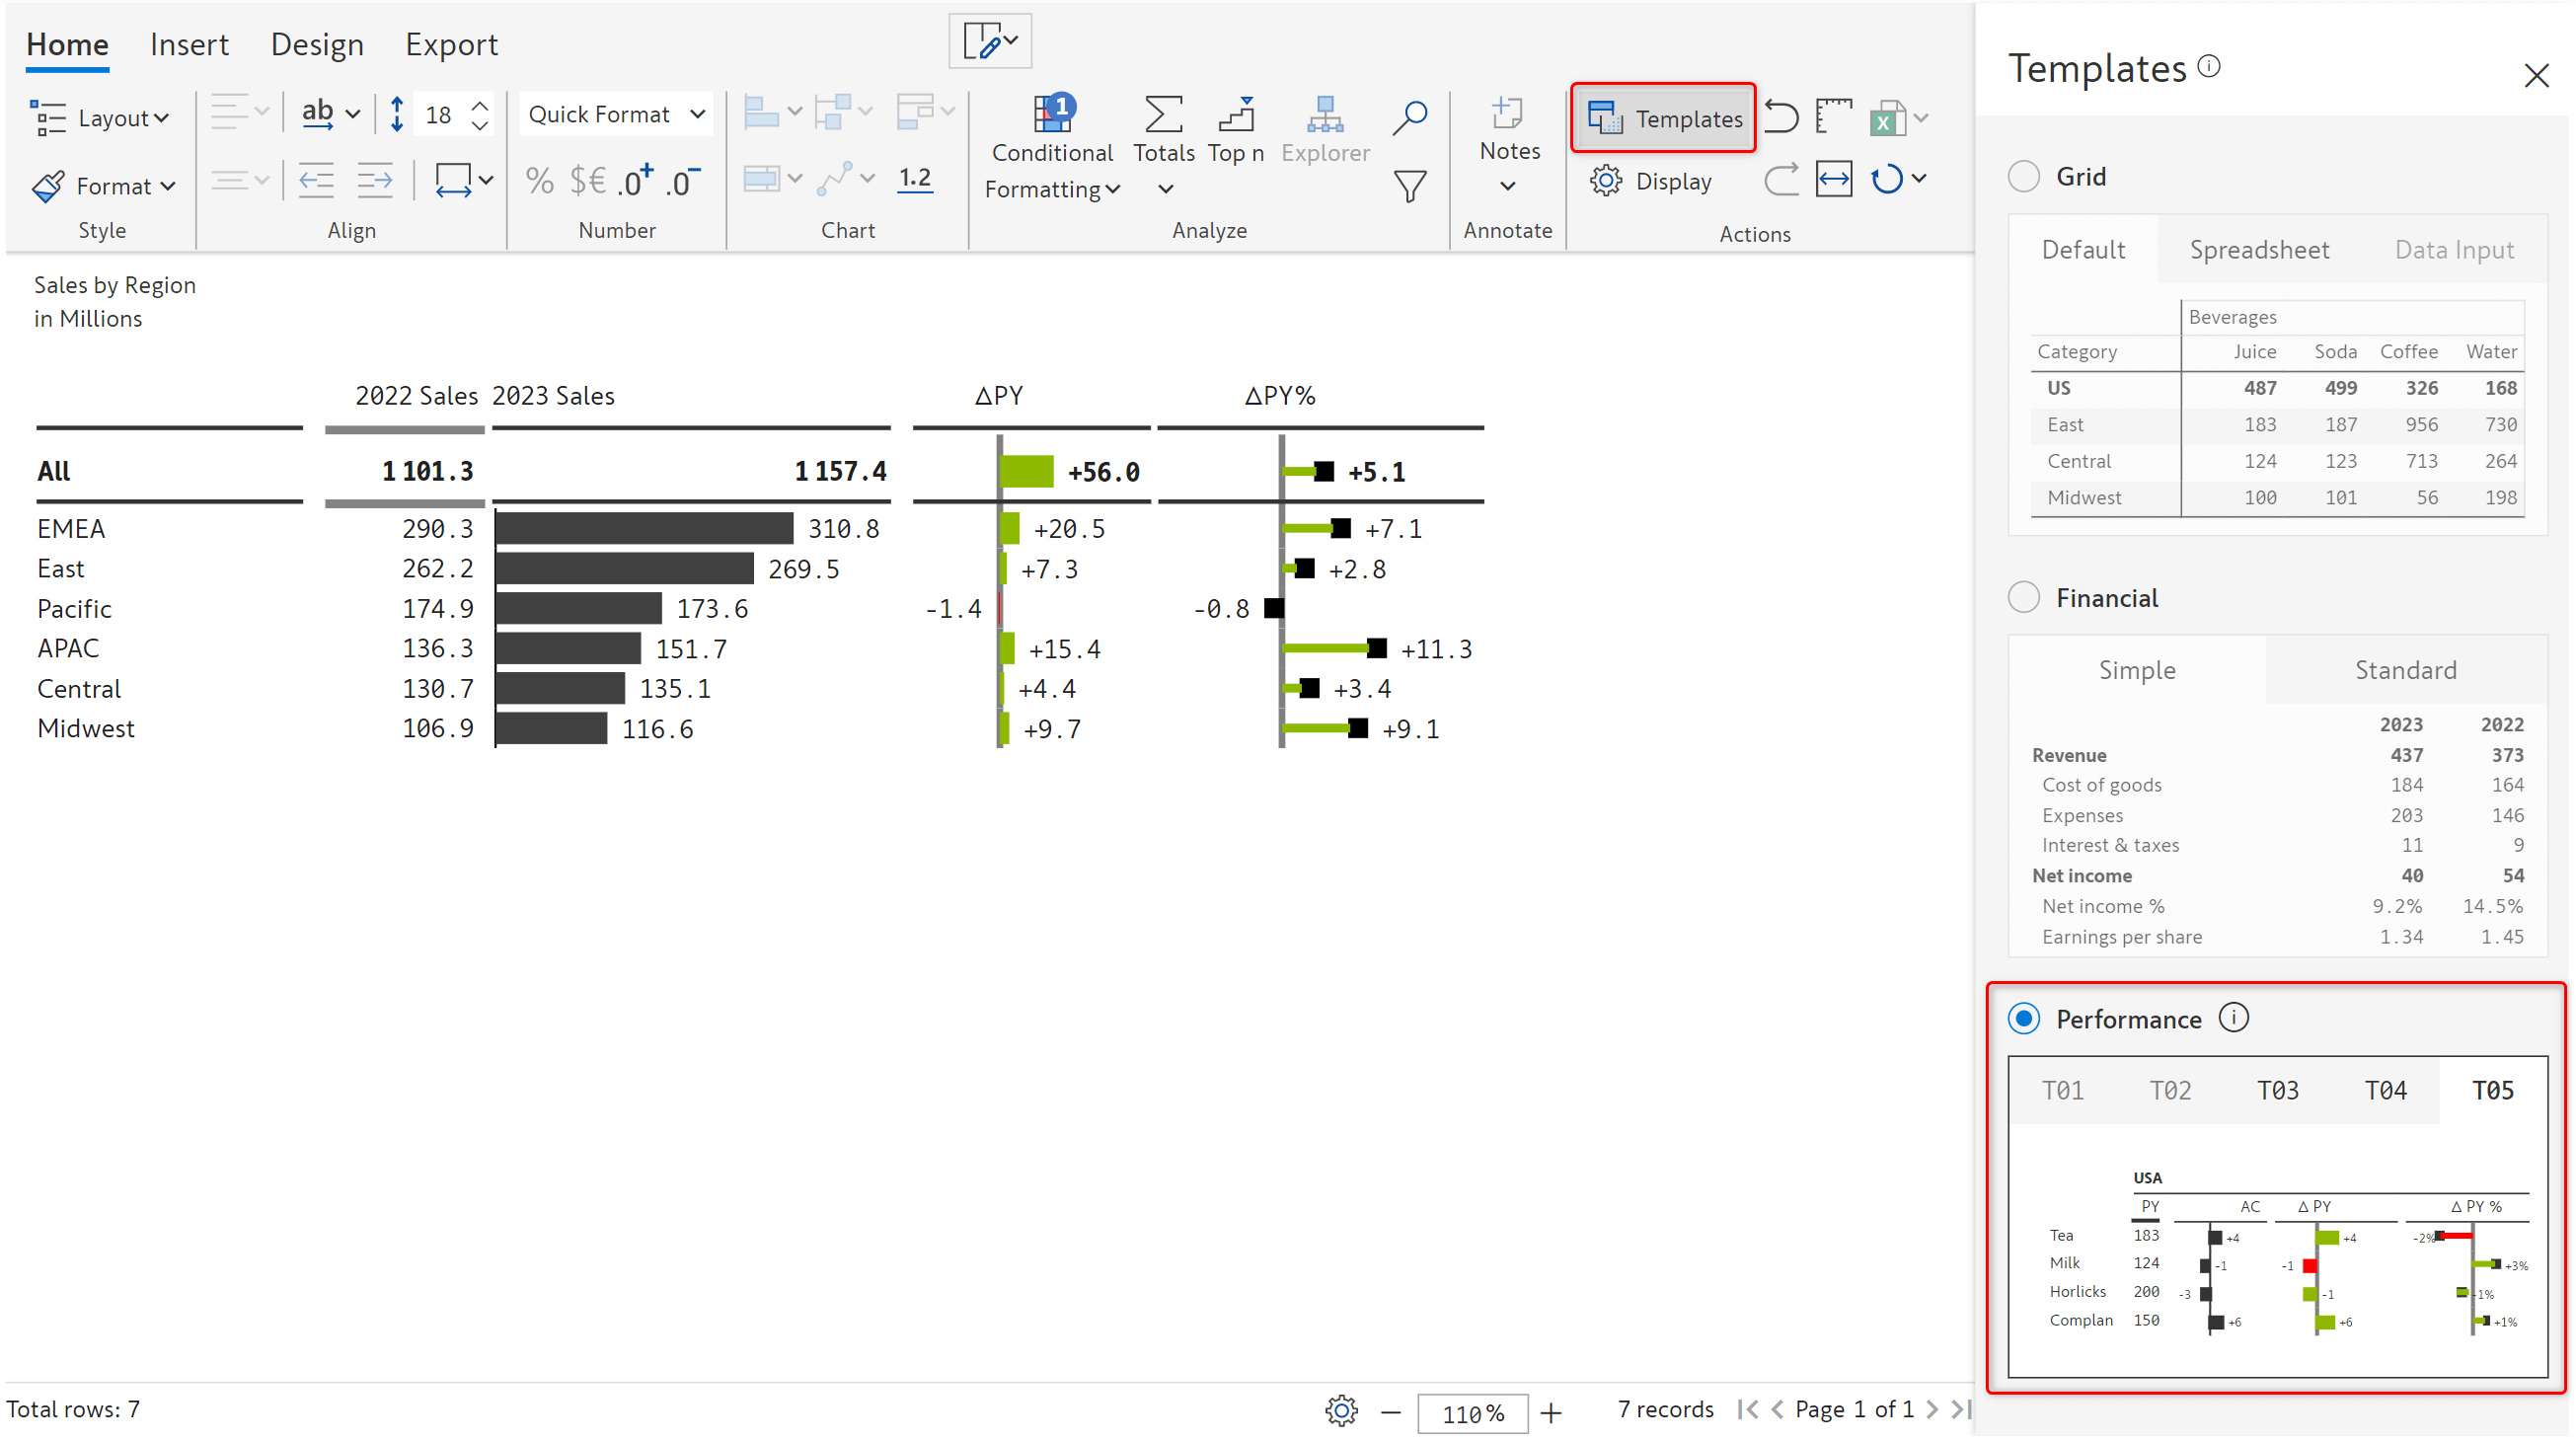
8. You can also use 1-click IBCS templates to visualize these variance measures as per IBCS standards.
Another place where variances are heavily utilized is in planning, forecasting & budgeting. Planning data models typically use a combination of a Version dimension & Sales measure. The version dimension holds several planning & forecasting versions of data, enabling users to create multiple versions of forecasts.
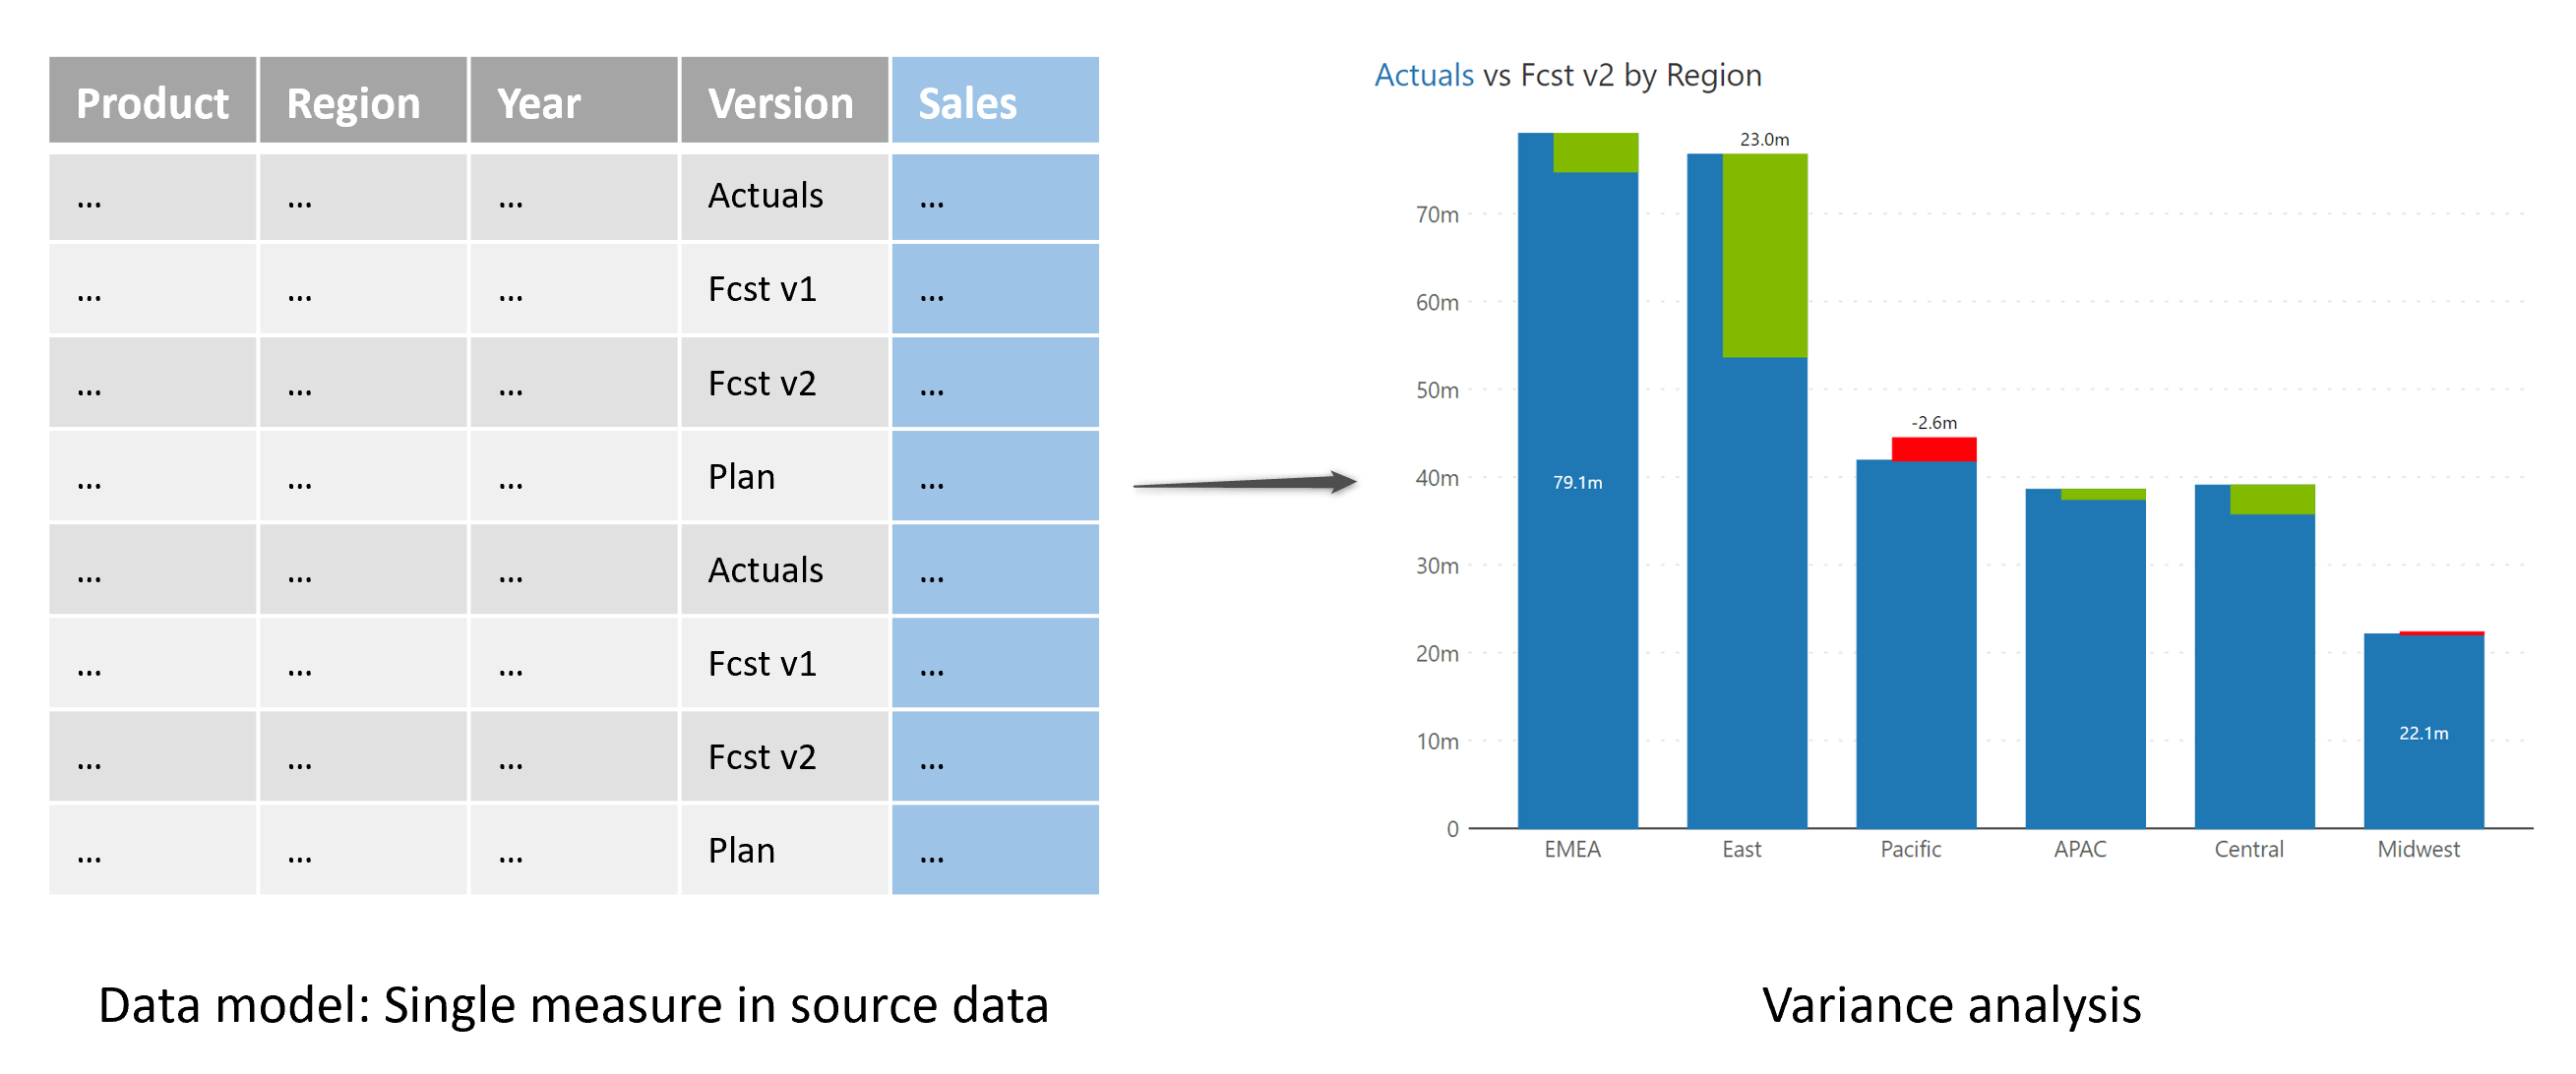
When you want to compare Actuals vs. Forecast data in Inforiver, just assign the Version field to the columns (instead of Year field as shown in the previous example). This approach enables you to visualize variances for any two version pairs, e.g., Forecast v9 vs. Forecast v8, Forecast v9 vs. Budget v3. Imagine having to create variances for all potential combinations using DAX measures.
The powerful variance analysis capabilities combined with manual data input capability, driver-based allocations, what-if simulations, scenarios and more make Inforiver a robust tool for quick & lightweight planning, forecasting & budgeting.
Get a copy of Inforiver Matrix today and create your own variances from a single measure.
Note: Measure management capabilities are also available in Inforiver Analytics+*, learn more in this blog.
Know more about Forecasting in Power BI here.
*Inforiver Charts has been renamed to Inforiver Analytics+, a 3-in-1 visual for dashboards and storyboards. It offers 50+ charts, cards, and tables.

Inforiver helps enterprises consolidate planning, reporting & analytics on a single platform (Power BI). The no-code, self-service award-winning platform has been recognized as the industry’s best and is adopted by many Fortune 100 firms.
Inforiver is a product of Lumel, the #1 Power BI AppSource Partner. The firm serves over 3,000 customers worldwide through its portfolio of products offered under the brands Inforiver, EDITable, ValQ, and xViz.


