Inforiver

Upcoming webinar on 'Inforiver Charts : The fastest way to deliver stories in Power BI', Aug 29th , Monday, 10.30 AM CST.    Register Now

Build a P&L / income statement report in Power BI in less than 5 minutes

by Inforiver | Oct 28, 2021 | ,

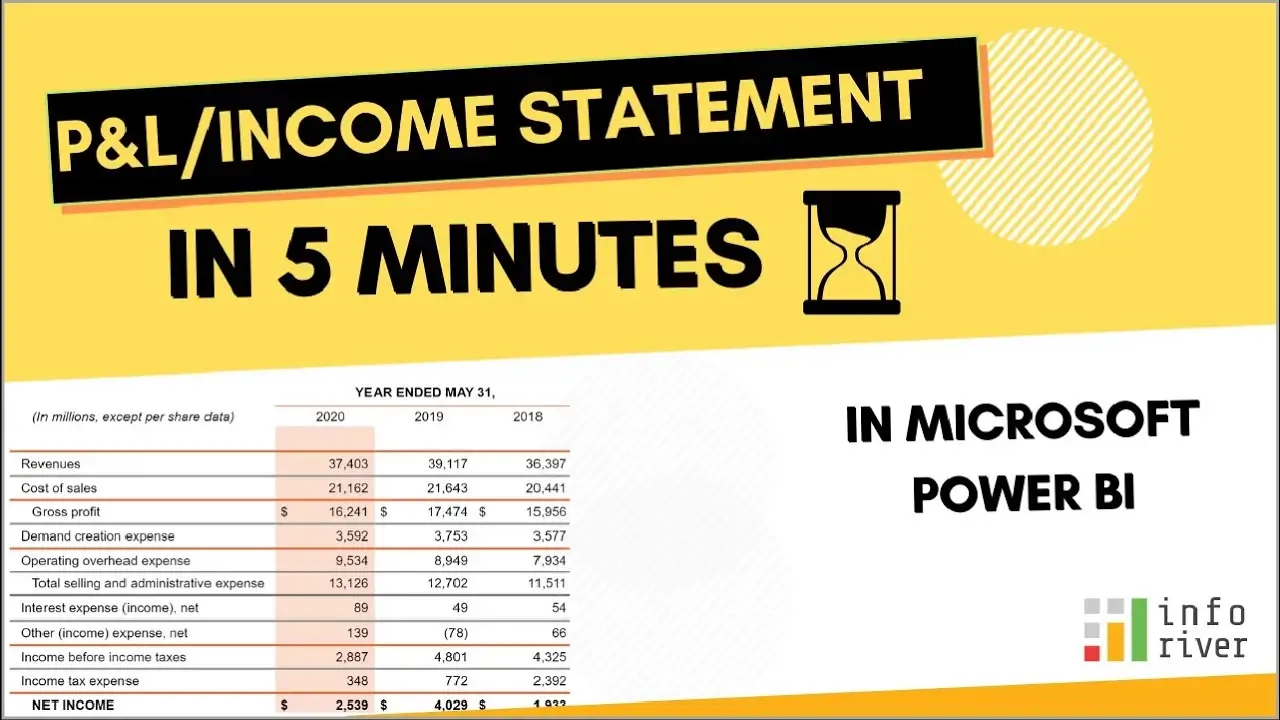
Anyone who has attempted building financial statements, including a P&L statement report, or an income statement in Power BI using the native table or matrix visual knows how time-consuming the task can be. The complication comes from several reasons, including but not limited to (a) having to encode a custom sort order for accounts in the data model (b) using DAX to not only perform calculations but also to conditionally populate rows based on GL accounts/subtotals (c) formatting limitations (d) limitations in handling accounting signs (+/-), and more.

Let’s take a quick look at how Inforiver can deliver a financial statement in less than five minutes in Power BI, without using DAX.

Build a P&L / income statement report in Power BI in less than 5 minutes

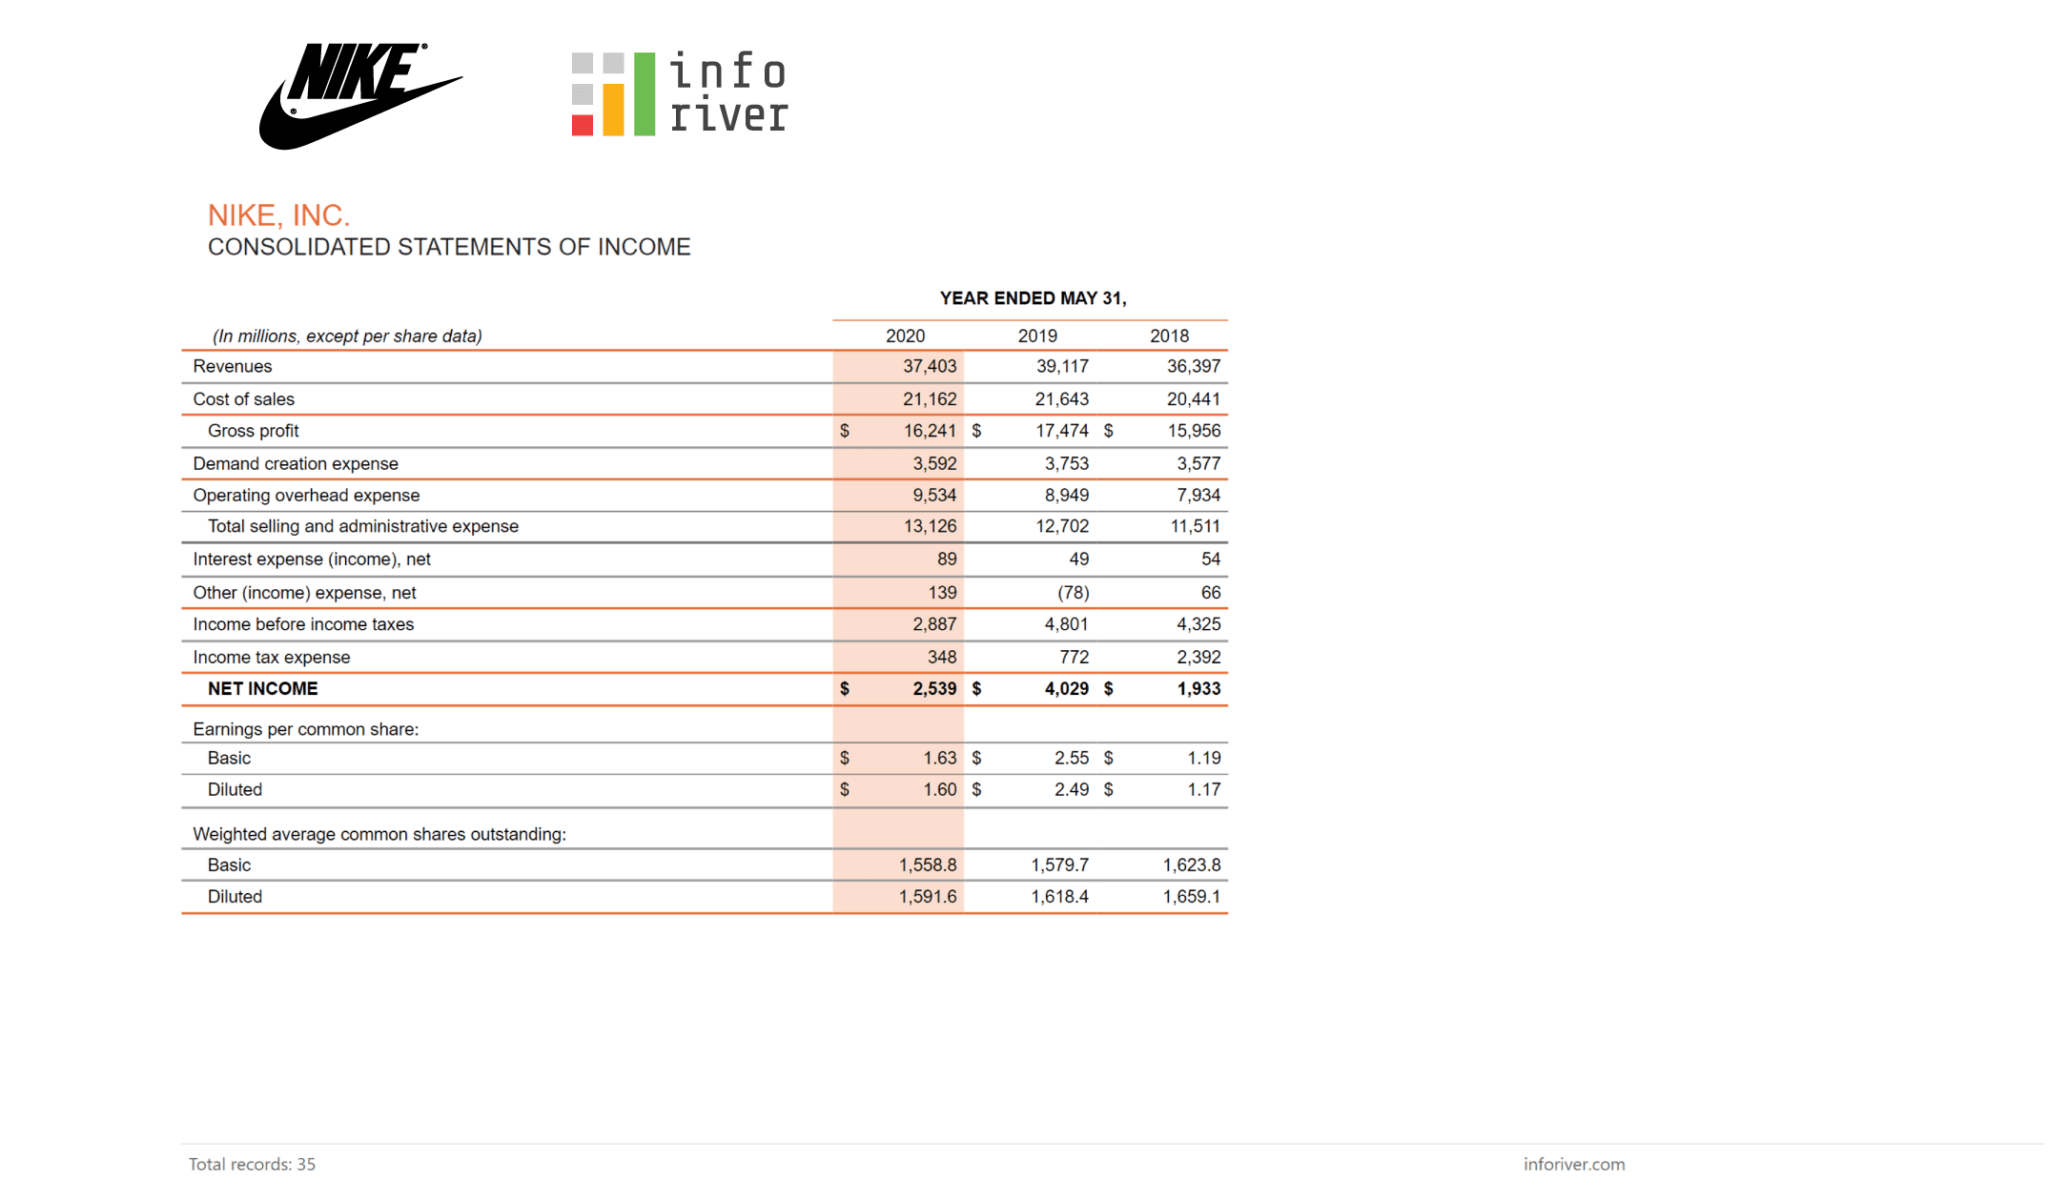
Once you have mapped your accounts (categories) and values (measures) to Inforiver, you can perform extensive formatting changes to get the desired format that you want in your profit & loss / income statement reports.

  • Format and indent GL account headers
  • Add single-line and double-line borders above/below specific values & rows
  • Add a vertical analysis column to show everything as a % of Revenue in a single click
  • Bring in budget or prior period performance data and calculate variances
  • Group column headers, something that is often common in profit & loss statements
  • Insert calculated rows to show derivative KPIs such as Gross Margin % or Earnings Per Share (EPS)
  • Add a static record to capture values not often found in your financial database - such as number of shares outstanding. This can be further used EPS calculation as listed above.
  • Add footnotes & annotations for specific accounts
    … and more

Sample P&L / Income Statements in Power BI

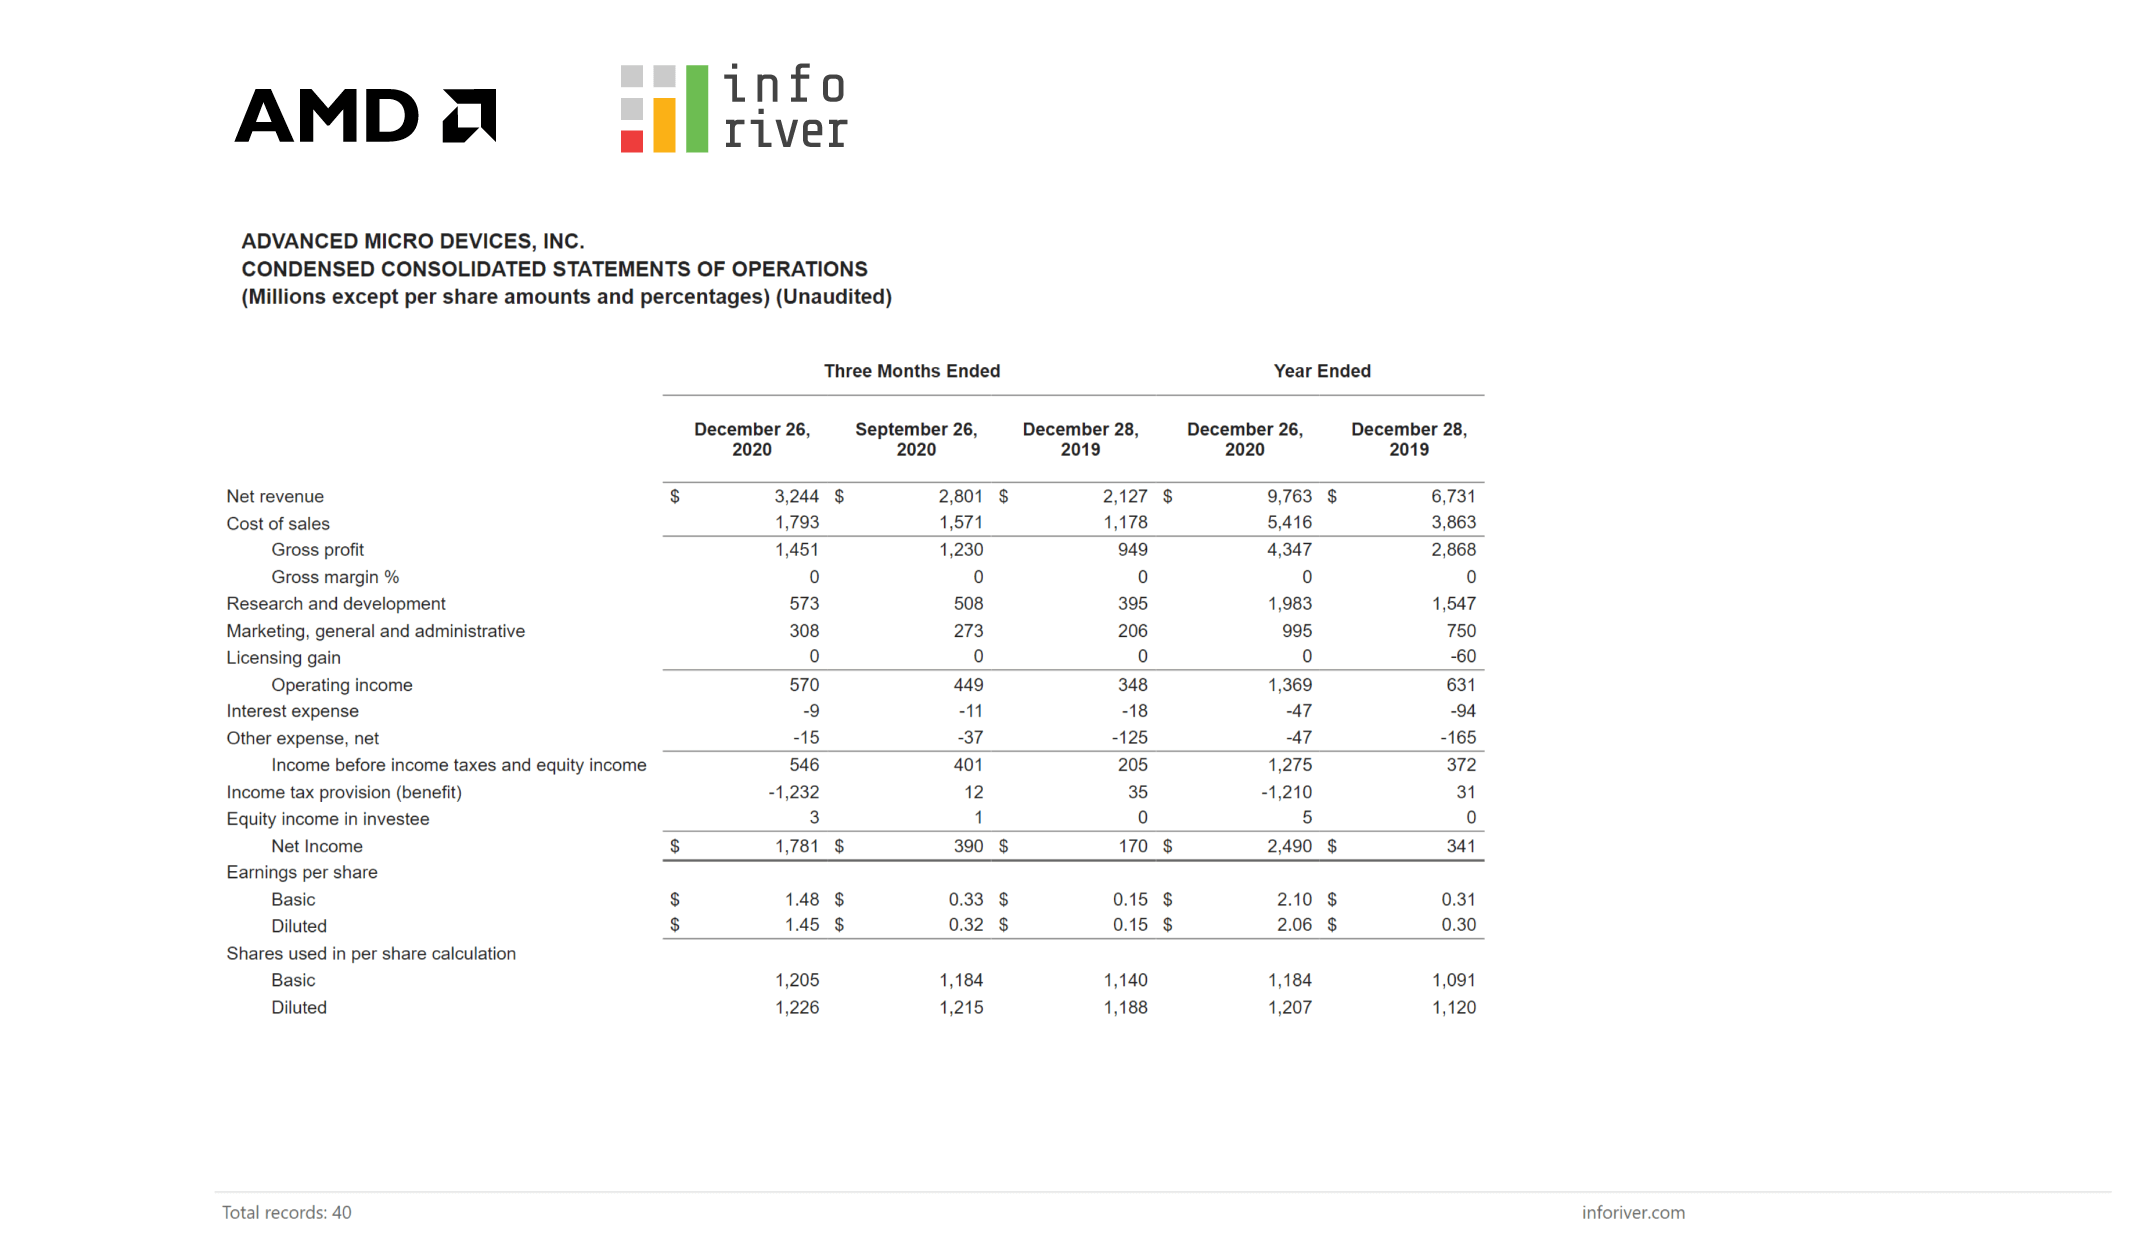
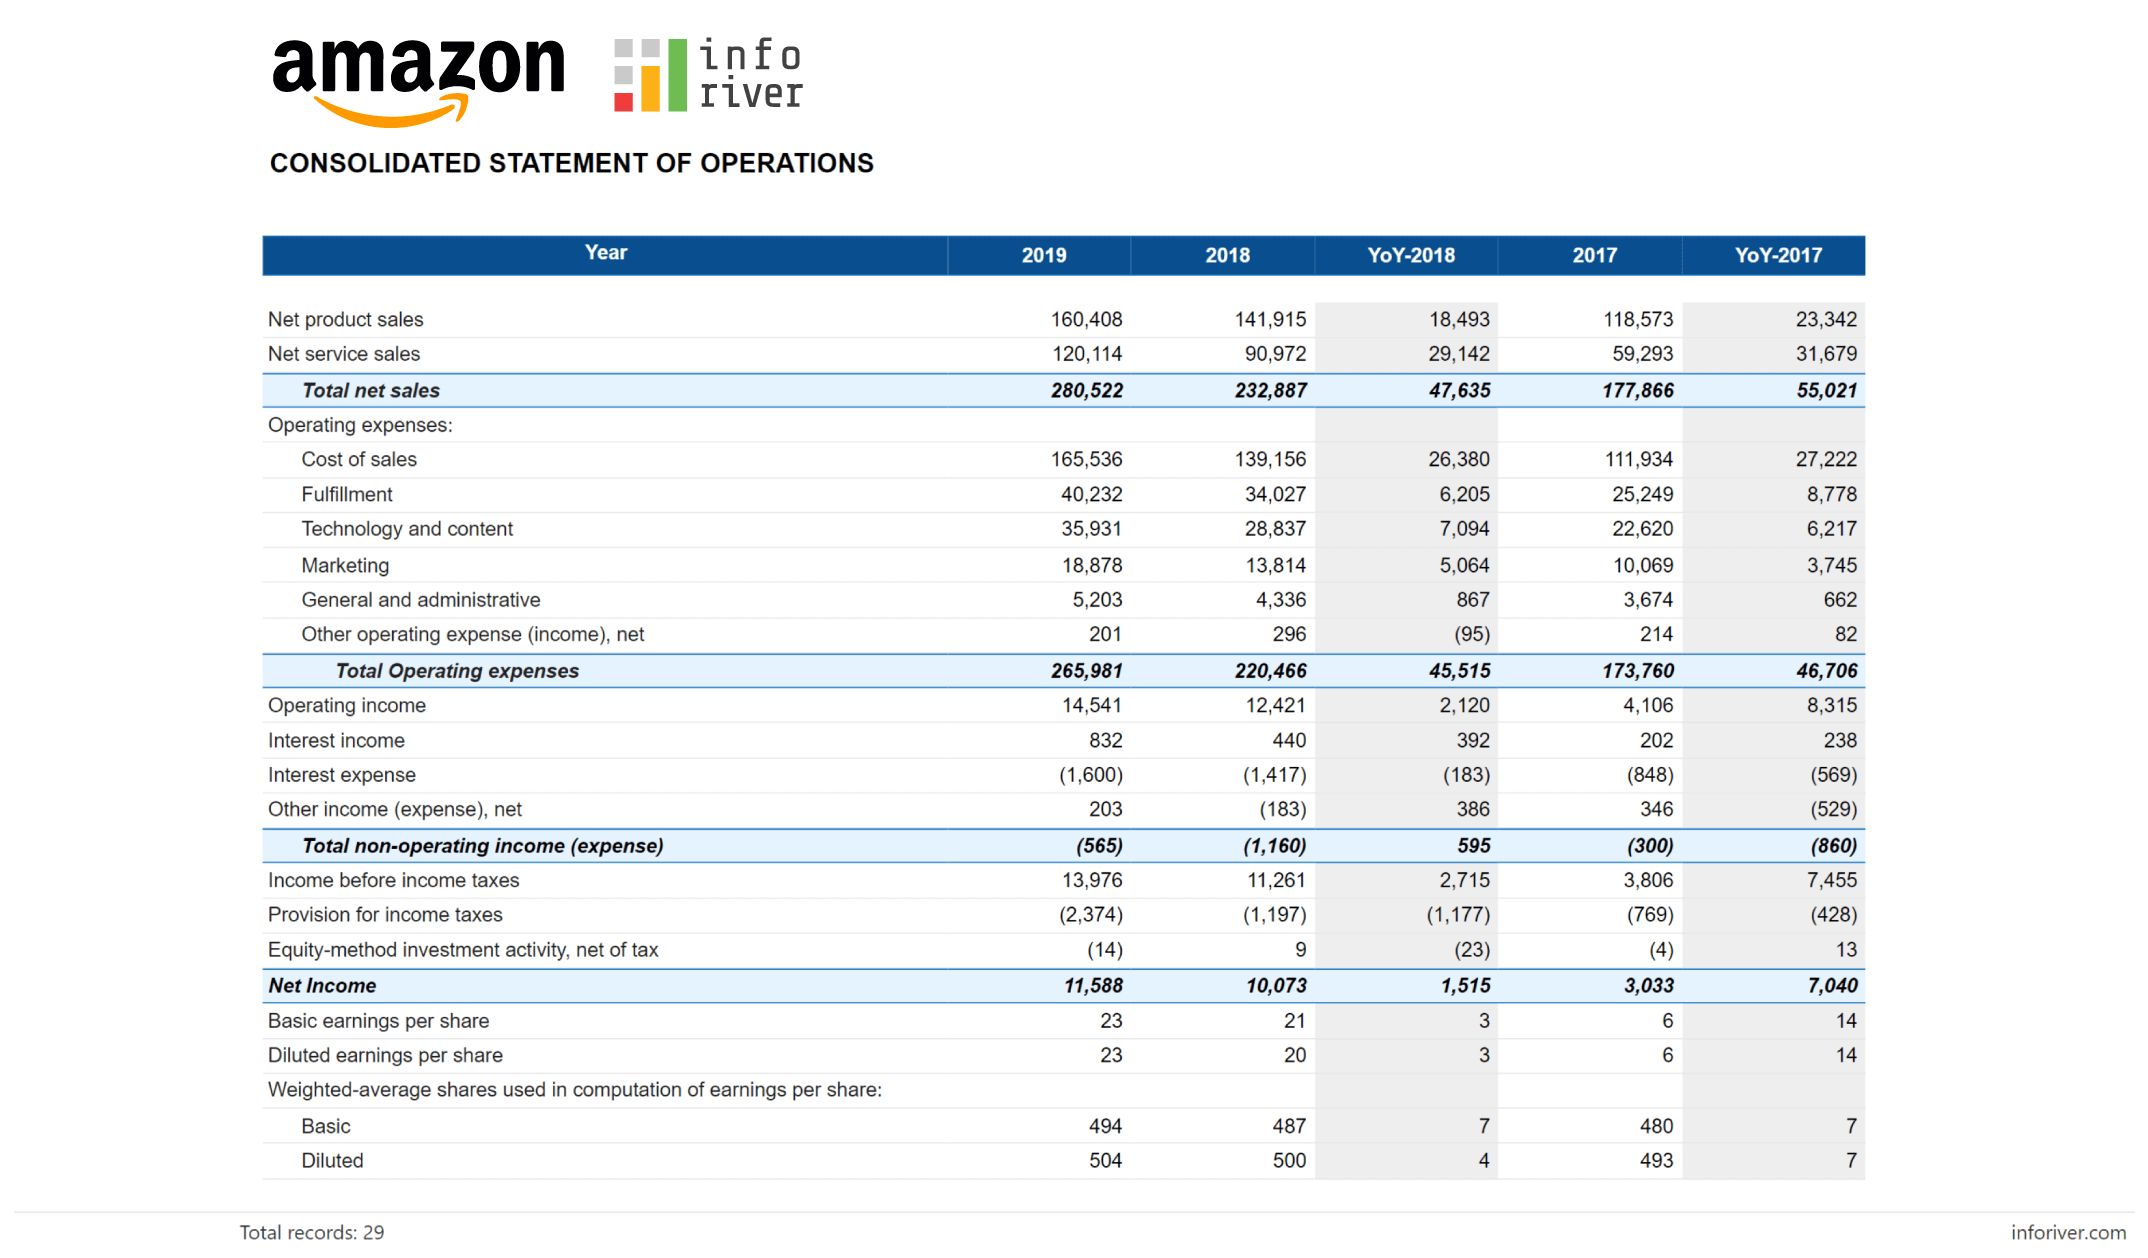
Here are some sample formatted financial statement reports built in Power BI. Click on the images to explore the interactive demo.

financial-income-statement-reporting-table-matrix-power-bi


Financial Reporting in Power BI using matrix/table - AMD
Financial Reporting in Power BI using matrix/table - Amazon
Financial Reporting in Power BI using matrix/table - Chevron
Financial Reporting in Power BI using matrix/table - GE

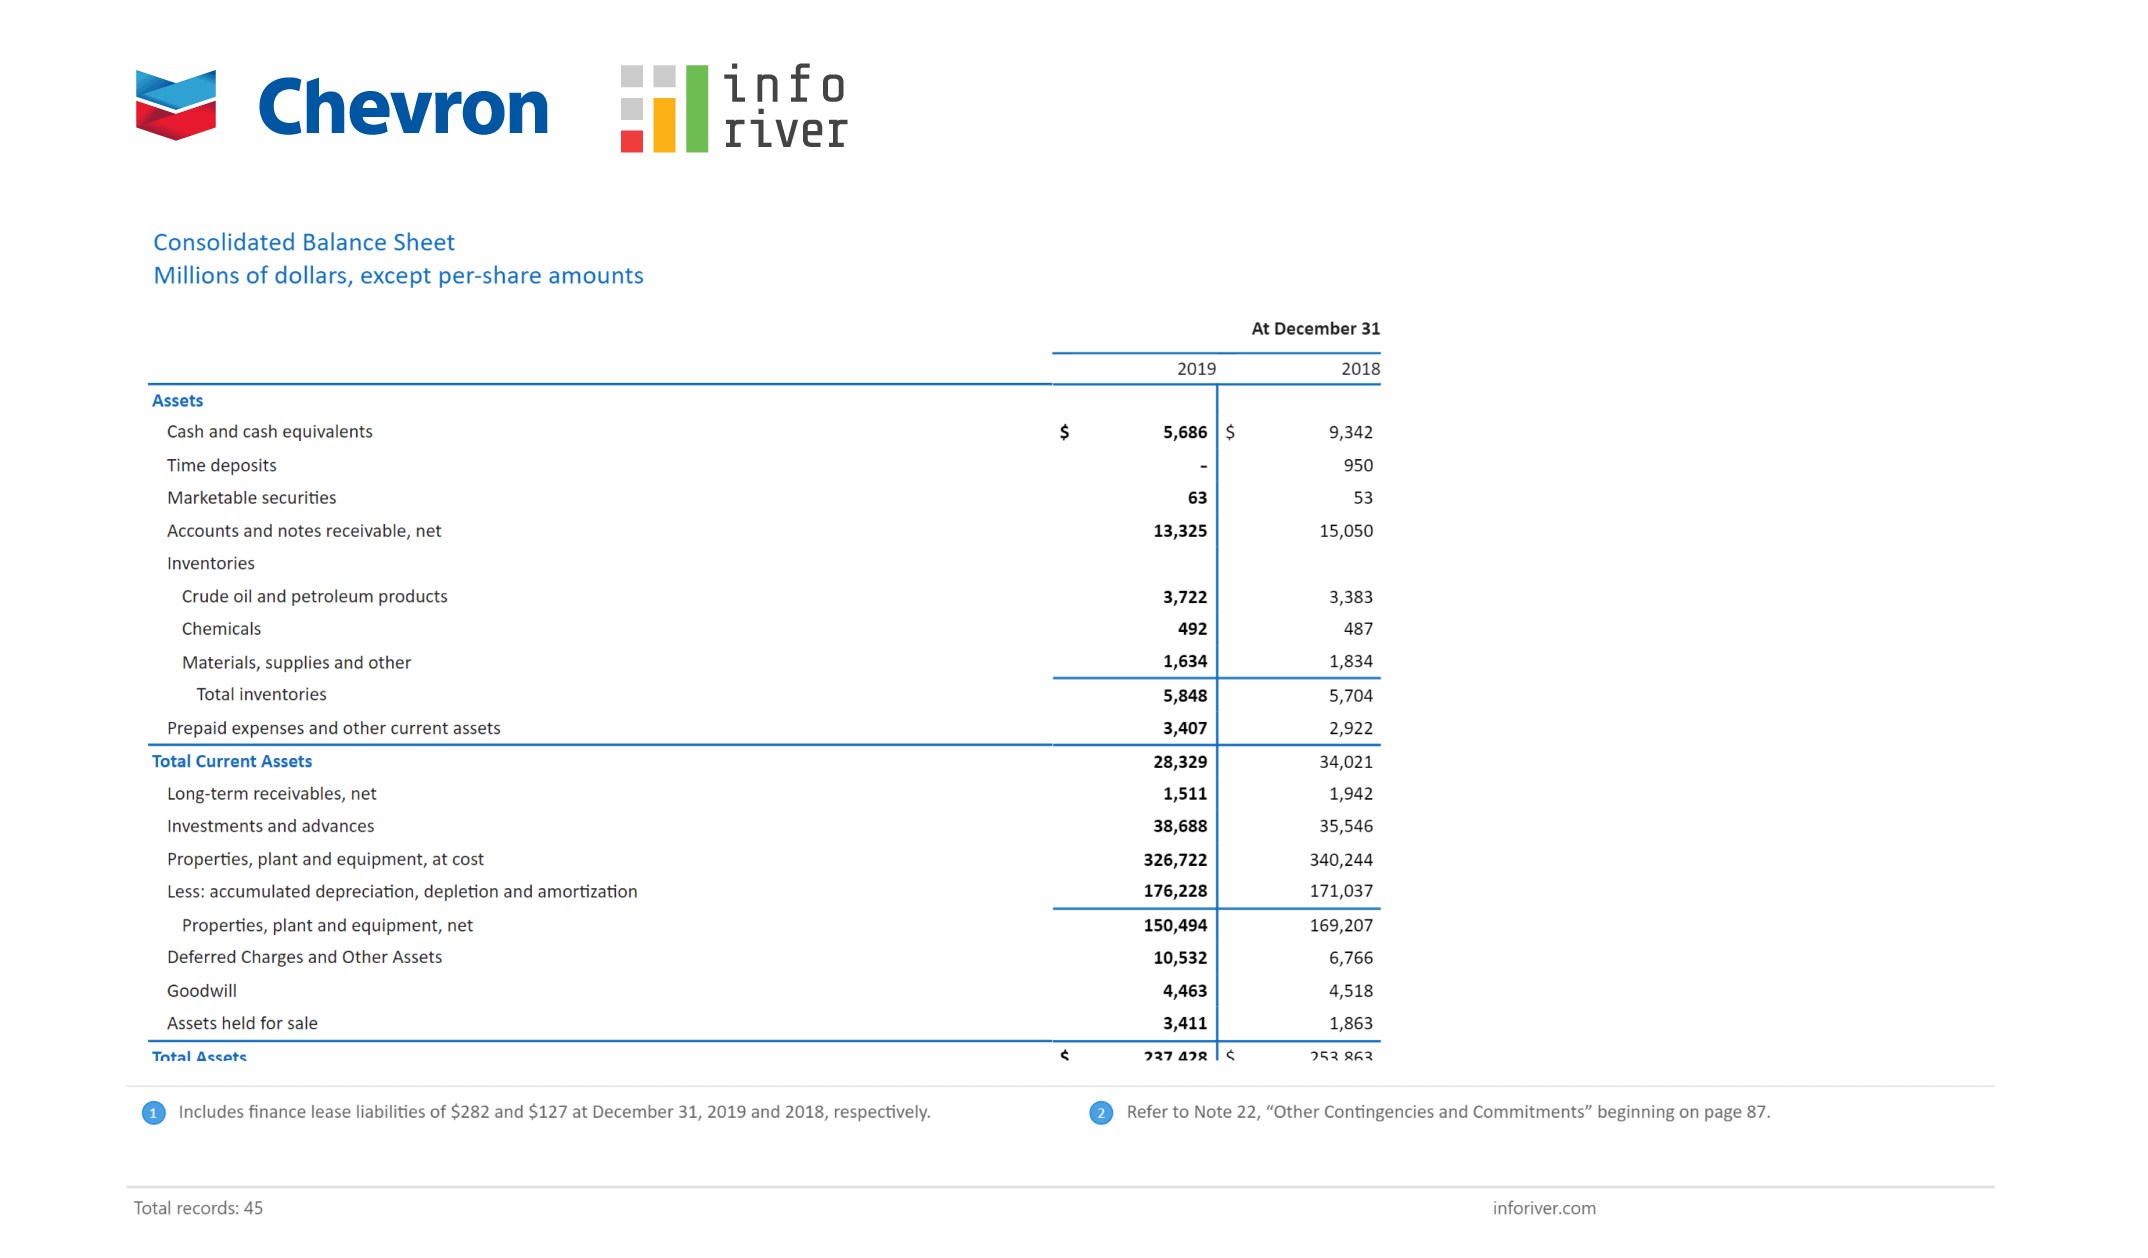
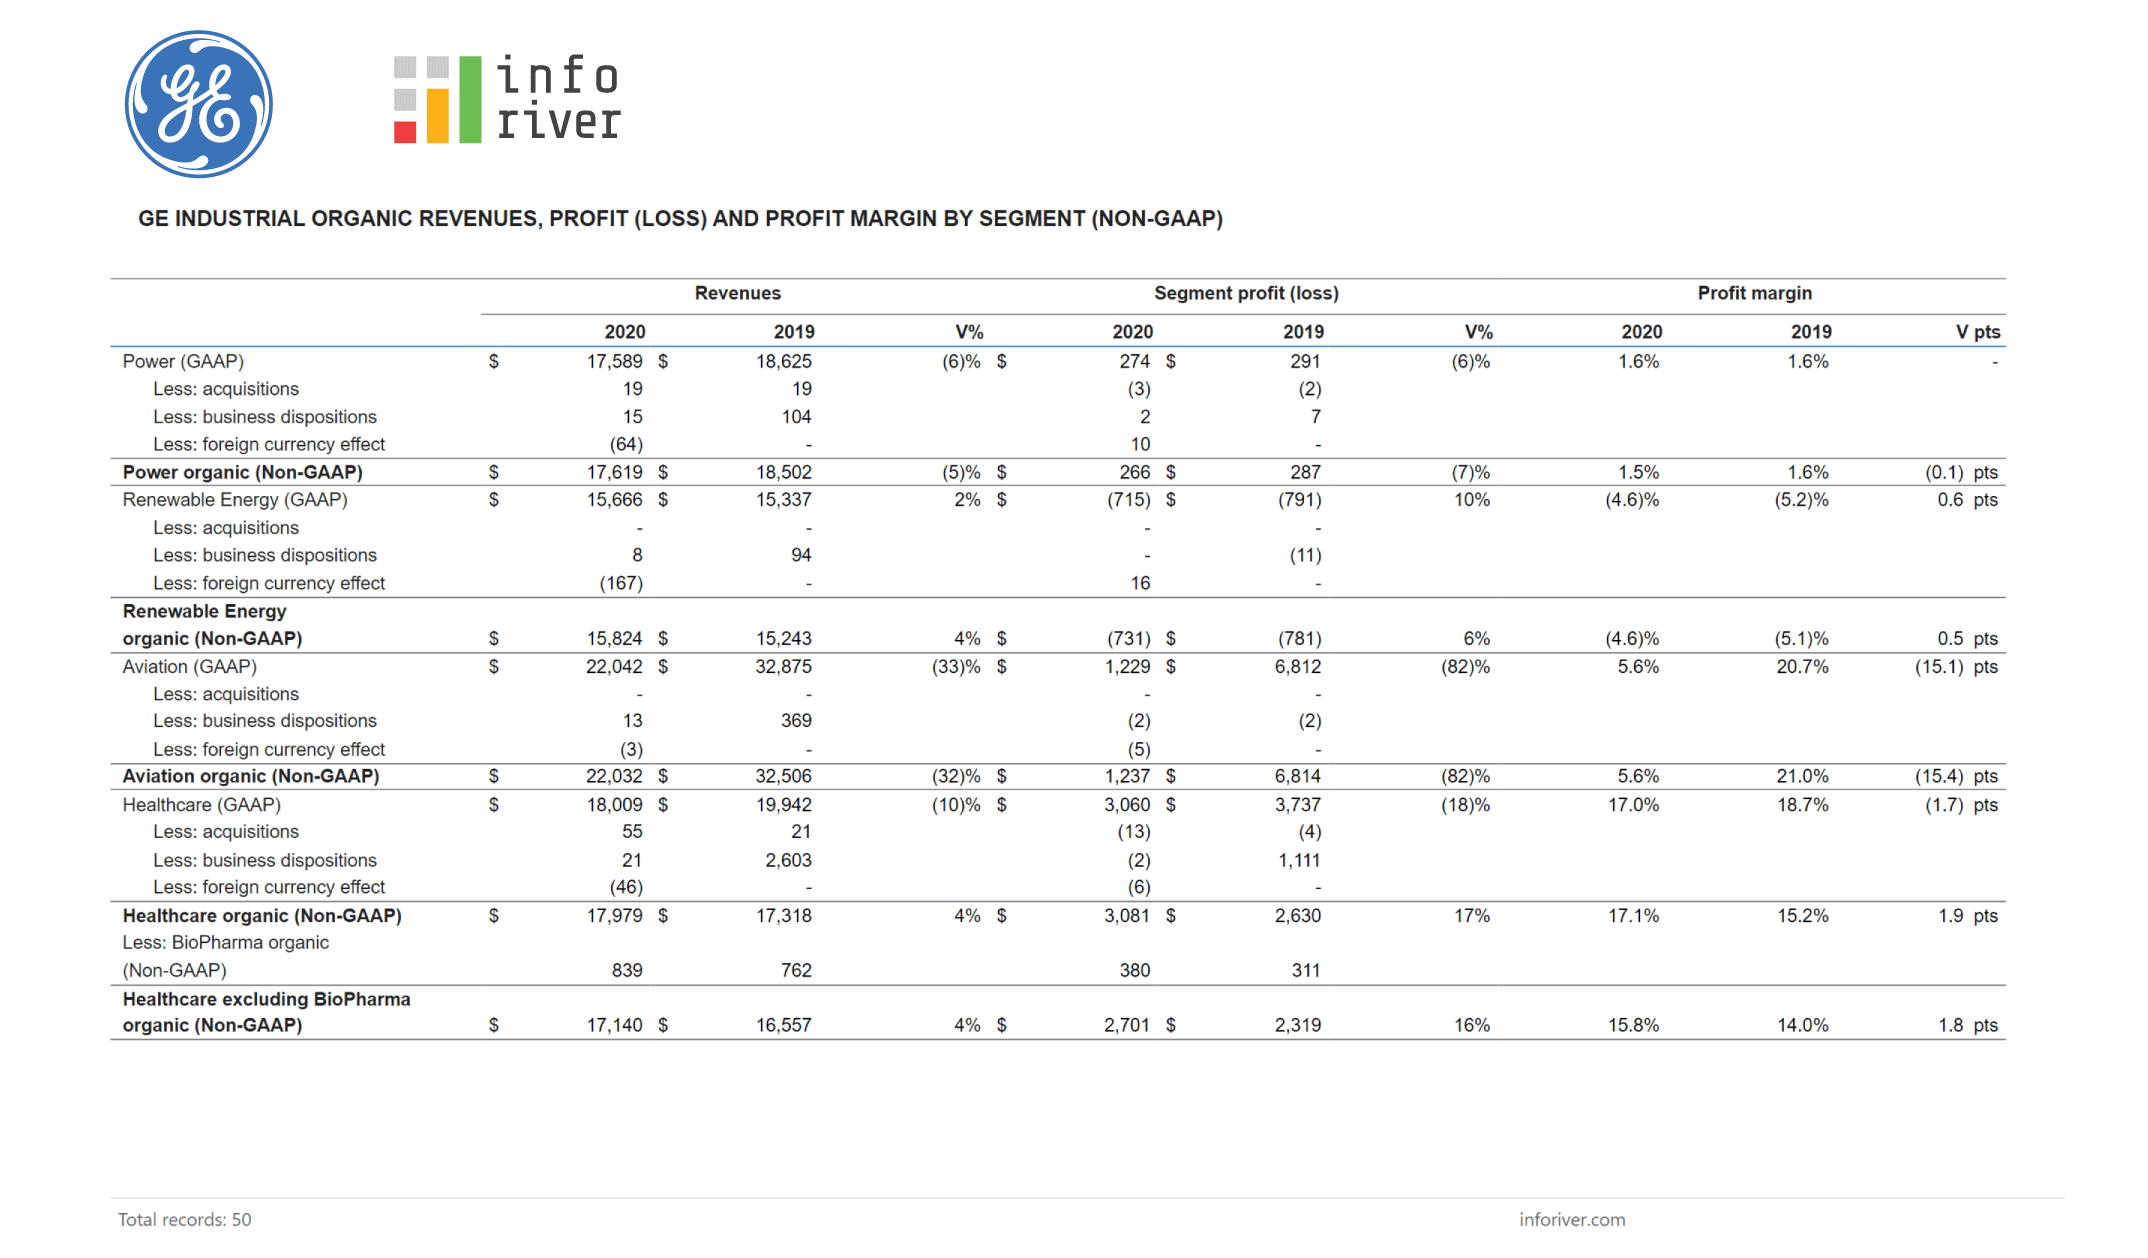
To download these demo files (.pbix) in Power BI, visit our demo page here.

Related content (Part 2 of the video): Formatting P&L/Financial Statements in Power BI


Share this on:

Get Inforiver brochure

Maximize your business potential with Inforiver's paginated reporting, data entry, planning & budgeting capabilities
Download now
Inforiver
About Inforiver!
Inforiver is the fastest way to do everything in Power BI. It enables citizen developer productivity and unleashes true self-service with our intuitive and interactive no-code data app suite for Microsoft Power BI. The product is developed by Lumel Technologies Inc, who are #1 Power BI Visuals AppSource Partner serving over 3,000+ customers worldwide with their xViz, Inforiver, and ValQ offerings.
Other Products
Inforiver Logo
IBCS Certified
Power BI certified

About Inforiver!

Inforiver is the fastest way to do everything in Power BI. It enables citizen developer productivity and unleashes true self-service with our intuitive and interactive no-code data app suite for Microsoft Power BI. The product is developed by Lumel Technologies Inc, who are #1 Power BI Visuals AppSource Partner serving over 3,000+ customers worldwide with their xViz, Inforiver, and ValQ offerings.

Headquarters
5920 Windhaven Pkwy, #130
Plano TX 75093
ValQ
xViz
BI Hub
linkedin facebook pinterest youtube rss twitter instagram facebook-blank rss-blank linkedin-blank pinterest youtube twitter instagram