
Upcoming webinar on 'Inforiver Charts : The fastest way to deliver stories in Power BI', Aug 29th , Monday, 10.30 AM CST. Register Now
Upcoming webinar on 'Inforiver Charts : The fastest way to deliver stories in Power BI', Aug 29th , Monday, 10.30 AM CST. Register Now
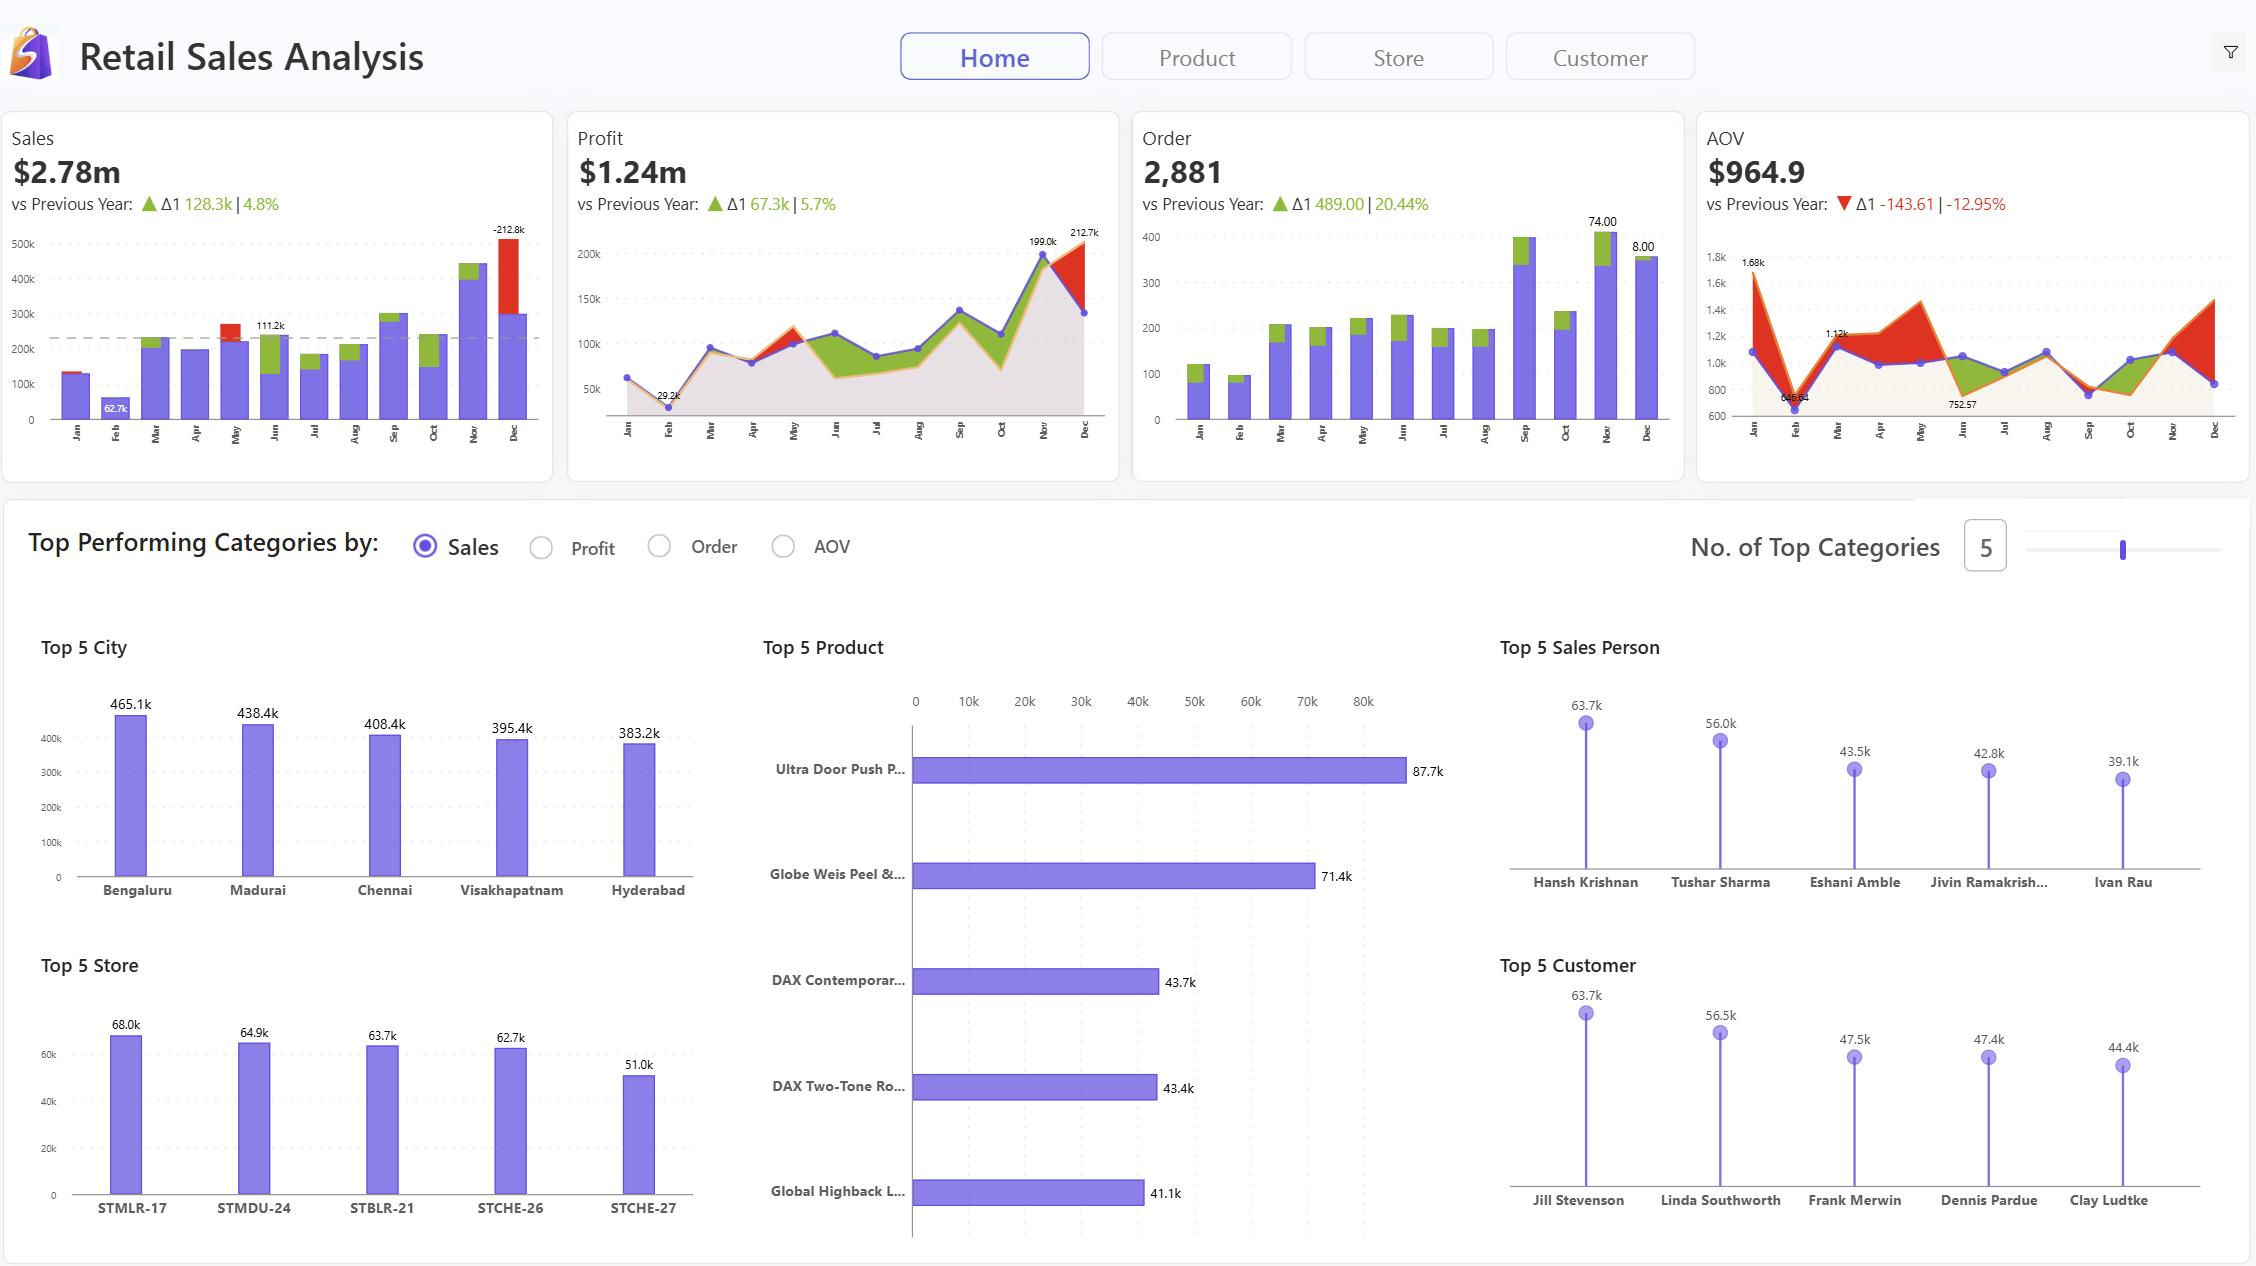
Transform your retail reporting with Inforiver Analytics+. It is a powerful Power BI visual designed for dynamic, interactive sales analysis. This all-in-one retail dashboard lets you track sales performance, profit margins, product trends, and YoY growth in a single, intuitive view.
With built-in sparklines, variance indicators, and in-cell metrics, you can uncover insights, highlight key shifts, and compare performance across categories or regions without switching visuals.
Ideal for monthly reviews, forecasting, and executive reporting, the Inforiver Analytics+ visual brings clarity, speed, and storytelling together in one powerful solution.
to try advance features
[demo_download_modal title="Retail Sales Dashboard with Inforiver Analytics+" link="https://inforiver.com/wp-content/uploads/UseCase_Retail-Sales-Analytics.zip"]
Inforiver helps enterprises consolidate planning, reporting & analytics on a single platform (Power BI). The no-code, self-service award-winning platform has been recognized as the industry’s best and is adopted by many Fortune 100 firms.
Inforiver is a product of Lumel, the #1 Power BI AppSource Partner. The firm serves over 3,000 customers worldwide through its portfolio of products offered under the brands Inforiver, EDITable, ValQ, and xViz.


