Inforiver

Upcoming webinar on 'Inforiver Charts : The fastest way to deliver stories in Power BI', Aug 29th , Monday, 10.30 AM CST.    Register Now

Power BI KPI Cards with Self-Colouring RAG Status and Momentum Tracking

Download PBIX File

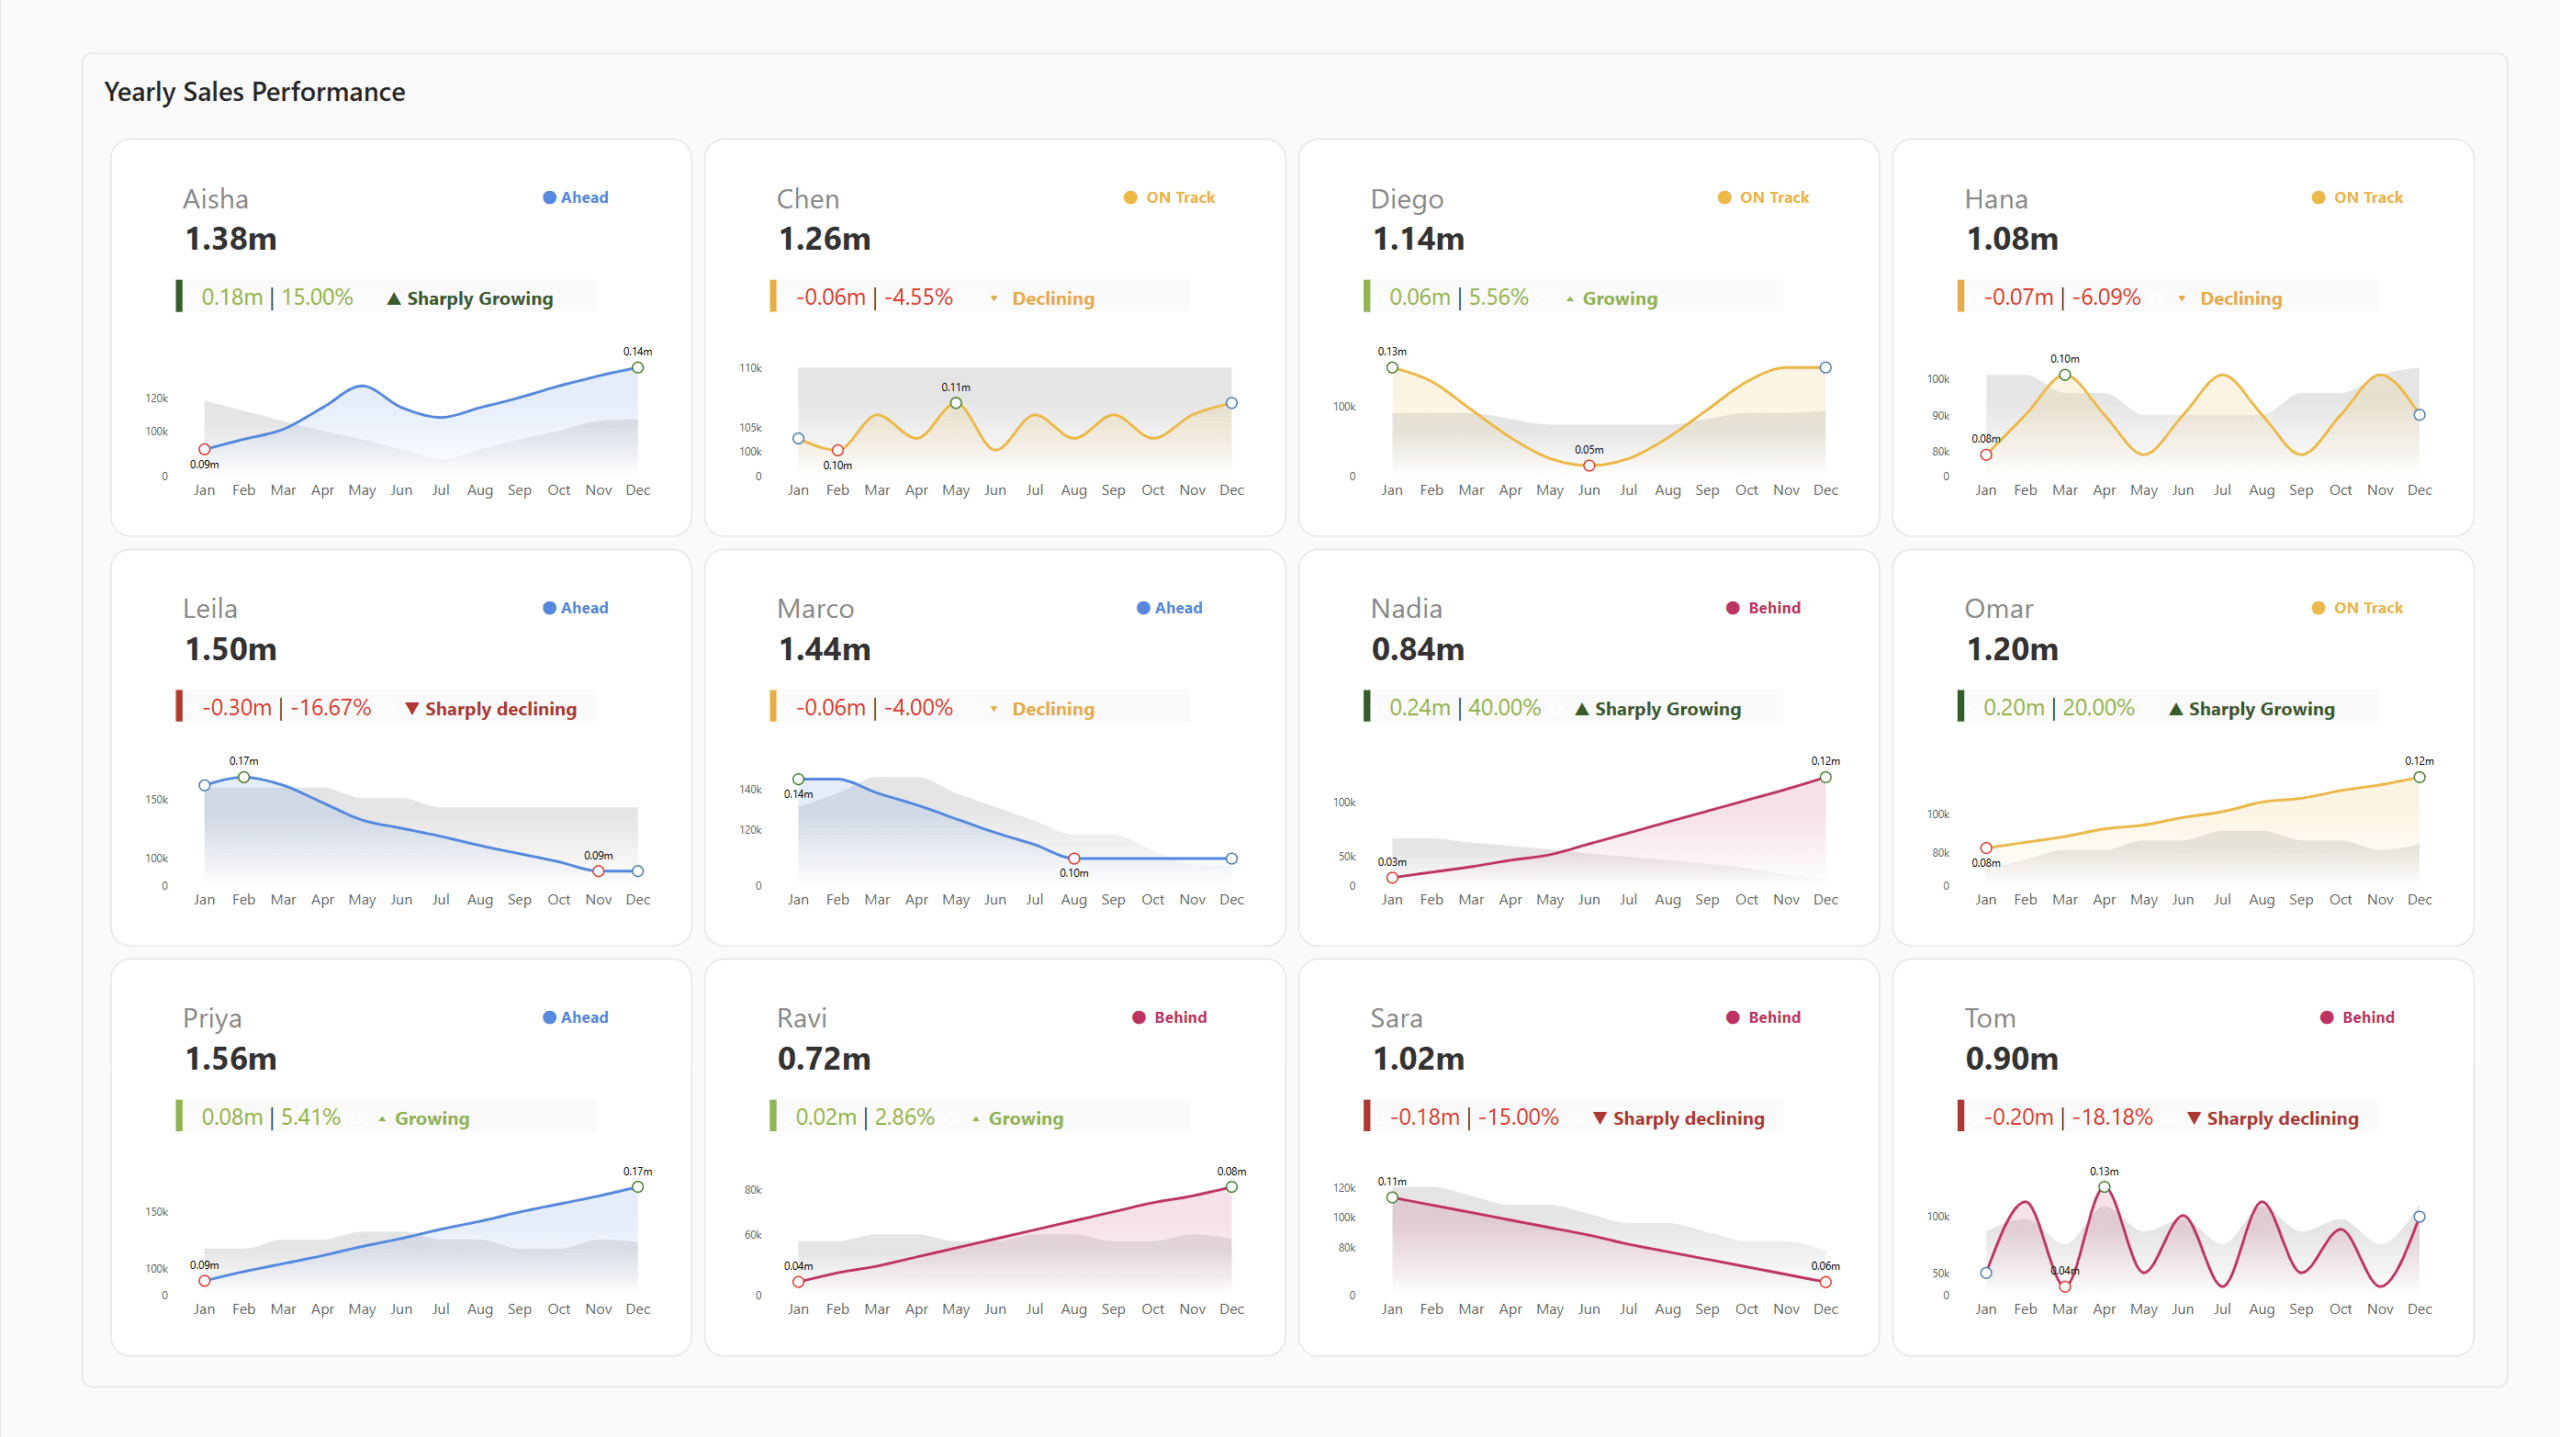
This Sales Performance dashboard showcases a small-multiple KPI card visual built using Inforiver Analytics+. It tracks 12 sales reps across a full year, showing each rep's sales, year-on-year variance, and a monthly trend, with two automatic status verdicts on every card.

The report acts as a dynamic Sales Scorecard in Power BI, combining KPI cards, sparklines, and conditional formatting in a single trellis. Using Variable Conditional Formatting in Power BI, each card colors itself: a Standing RAG compares the rep to the team average (Ahead, On Track, Behind), while a Momentum RAG reads the year-on-year change (Sharply Growing, Growing, Declining, Sharply Declining). Both the verdict text and its colour are driven by a single reusable rule, with no extra DAX.

Designed as a modern Sales Performance Tracker, this KPI Card Visualization helps sales leaders and RevOps teams see at a glance not just where each rep stands, but where they are heading, so the exceptions surface on their own.

Download the dashboard and explore self-coloring KPI cards and Variable Conditional Formatting with Inforiver Analytics+.

iframe preview
View interactive content

Power BI KPI Cards with Self-Colouring RAG Status and Momentum Tracking

This Sales Performance dashboard showcases a small-multiple KPI card visual built using Inforiver Analytics+. It tracks 12 sales reps across a full year, showing each rep's sales, year-on-year variance, and a monthly trend, with two automatic status verdicts on every card. The report acts as a dynamic Sales Scorecard in Power BI, combining KPI cards, sparklines, and conditional formatting in a single trellis. Using Variable Conditional Formatting in Power BI, each card colors itself: a Standing RAG compares the rep to the team average (Ahead, On Track, Behind), while a Momentum RAG reads the year-on-year change (Sharply Growing, Growing, Declining, Sharply Declining). Both the verdict text and its colour are driven by a single reusable rule, with no extra DAX. Designed as a modern Sales Performance Tracker, this KPI Card Visualization helps sales leaders and RevOps teams see at a glance not just where each rep stands, but where they are heading, so the exceptions surface on their own. Download the dashboard and explore self-coloring KPI cards and Variable Conditional Formatting with Inforiver Analytics+.
iframe preview
View interactive content

Download Report for Free

to try advance features

[demo_download_modal title="Power BI KPI Cards with Self-Colouring RAG Status and Momentum Tracking" link="https://inforiver.com/wp-content/uploads/sales_performance_using_variable_cf_inforiver_analytics_plus.zip"]

Other Demos

Power BI KPI Cards with Self-Colouring RAG Status and Momentum Tracking

Build a dynamic Sales Performance Tracker in Power BI with self-colouring KPI cards, RAG status, year-on-year momentum, sparklines, and Variable Conditional Formatting using Inforiver Analytics+.

Gantt Chart for New Product Launch Timeline and Milestone Tracking

Plan and track complex product launches in Power BI using an interactive Gantt Chart with milestone visibility, budget monitoring, and progress insights.

Migrating Tableau KPI Reports

Explore how a Tableau KPI report can be transformed into an interactive Power BI dashboard using Inforiver Analytics+, combining visual storytelling, year-over-year insights, and scalable KPI analytics.

Advanced SaaS P&L & Financial Reporting

Interactive P&L dashboard in Power BI for SaaS financial reporting. Analyze revenue, costs, margins, and profitability with variance vs prior year, plan, and forecast using Inforiver Analytics+.

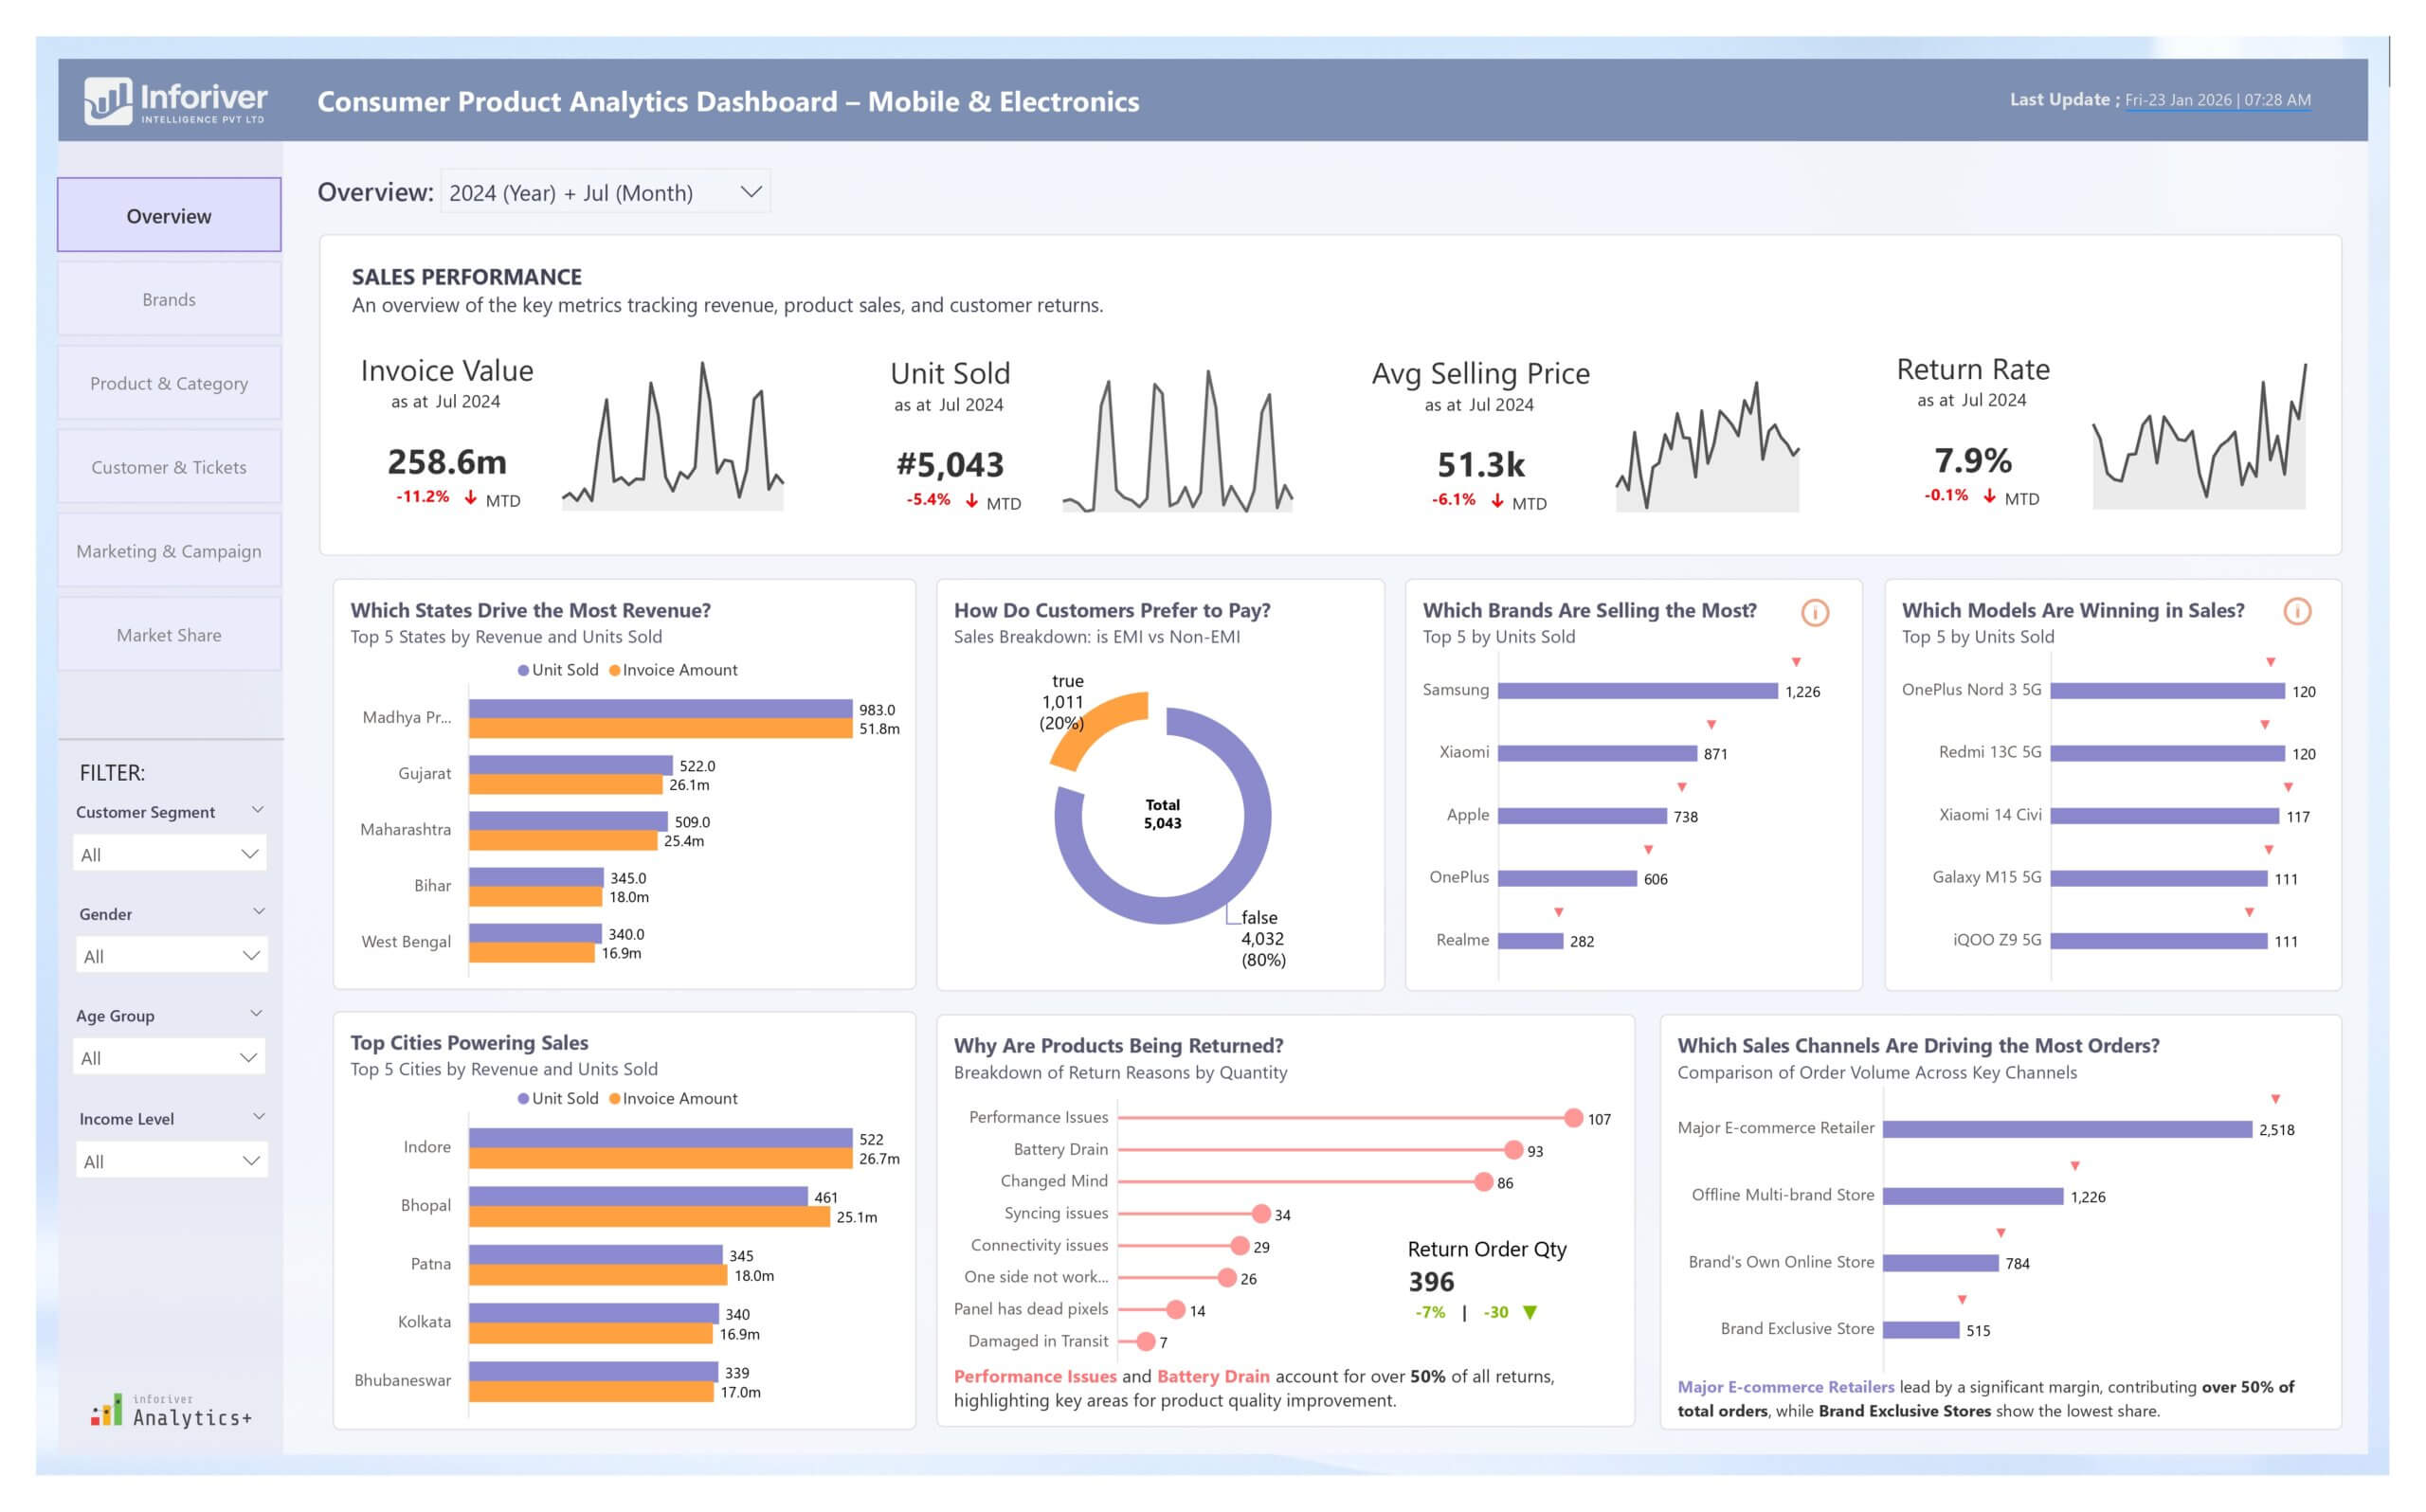
Consumer Product Analytics Dashboard: Unlocking Insights in Mobile & Electronics

Drive growth in mobile & electronics with our Power BI Consumer Product Analytics Dashboard. Experience advanced data storytelling with Inforiver.

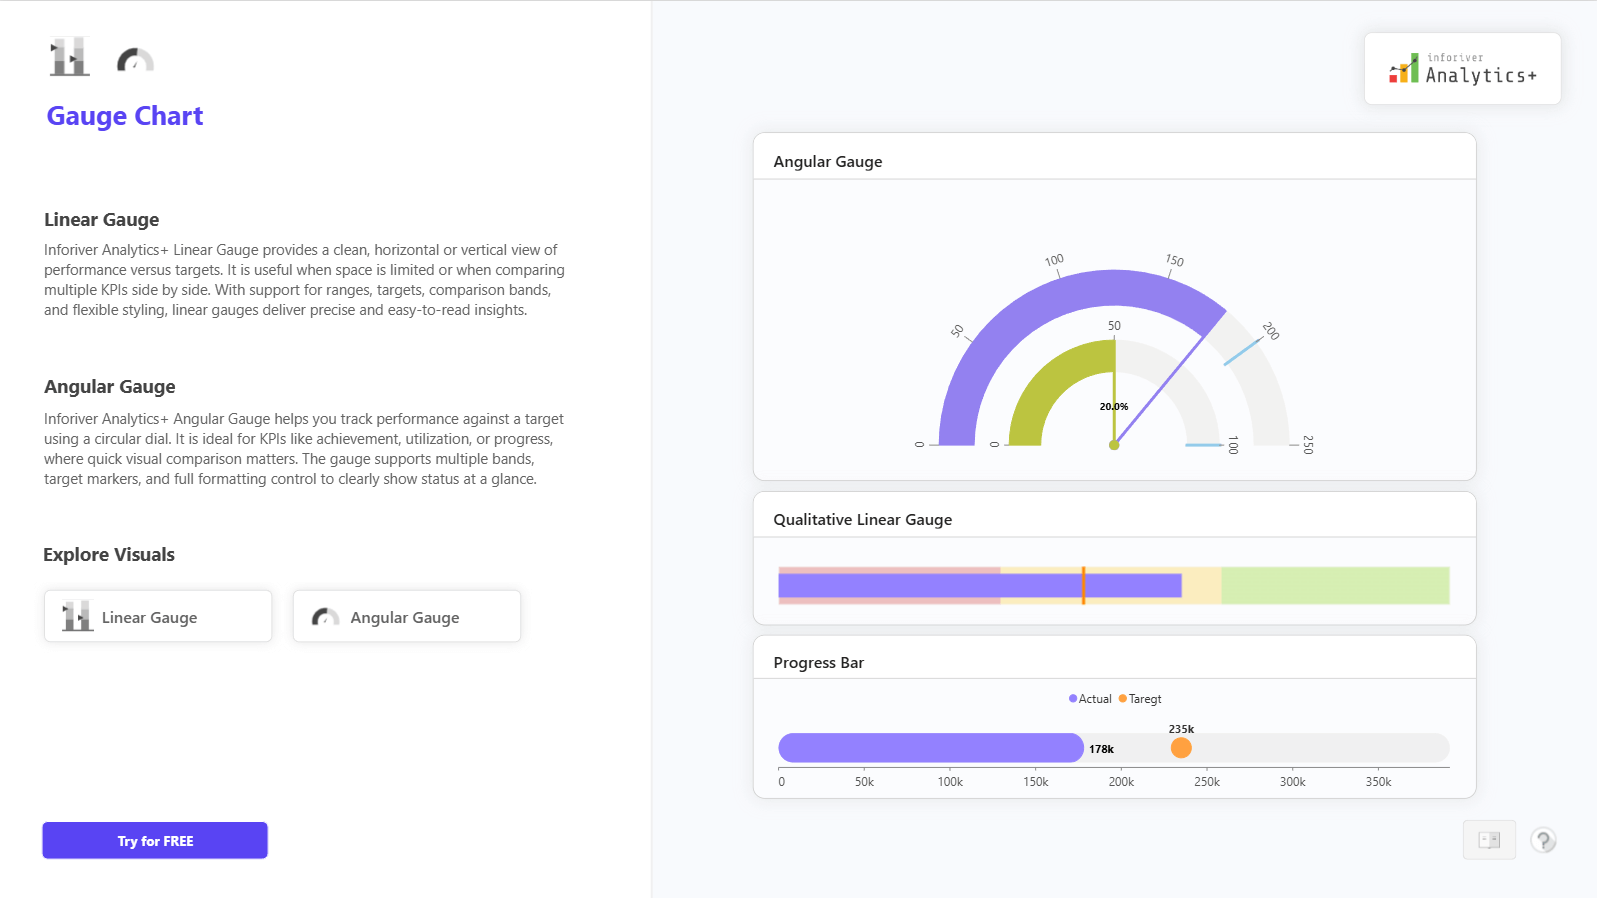
Gauge Chart

Track KPI progress against targets using Linear and Angular Gauge Charts in Power BI. Get instant visibility into performance status for executive dashboards

Download Power BI KPI Cards with Self-Colouring RAG Status and Momentum Tracking

By clicking on Download PBIX File you agree to our terms and conditions and you acknowledge having read our EULAThe PBIX file is available only for limited duration

Get Inforiver brochure

Maximize your business potential with Inforiver's paginated reporting, data entry, planning & budgeting capabilities
Download now
Inforiver

Inforiver helps enterprises consolidate planning, reporting & analytics on a single platform (Power BI). The no-code, self-service award-winning platform has been recognized as the industry’s best and is adopted by many Fortune 100 firms.

Inforiver is a product of Lumel, the #1 Power BI AppSource Partner. The firm serves over 3,000 customers worldwide through its portfolio of products offered under the brands Inforiver, EDITable, ValQ, and xViz.

homemagnifiercross linkedin facebook pinterest youtube rss twitter instagram facebook-blank rss-blank linkedin-blank pinterest youtube twitter instagram