Inforiver

Upcoming webinar on 'Inforiver Charts : The fastest way to deliver stories in Power BI', Aug 29th , Monday, 10.30 AM CST.    Register Now

Power BI Box Plots for Demurrage Risk: IBCS Quarterly Port Performance Report with Forecast

Download PBIX File

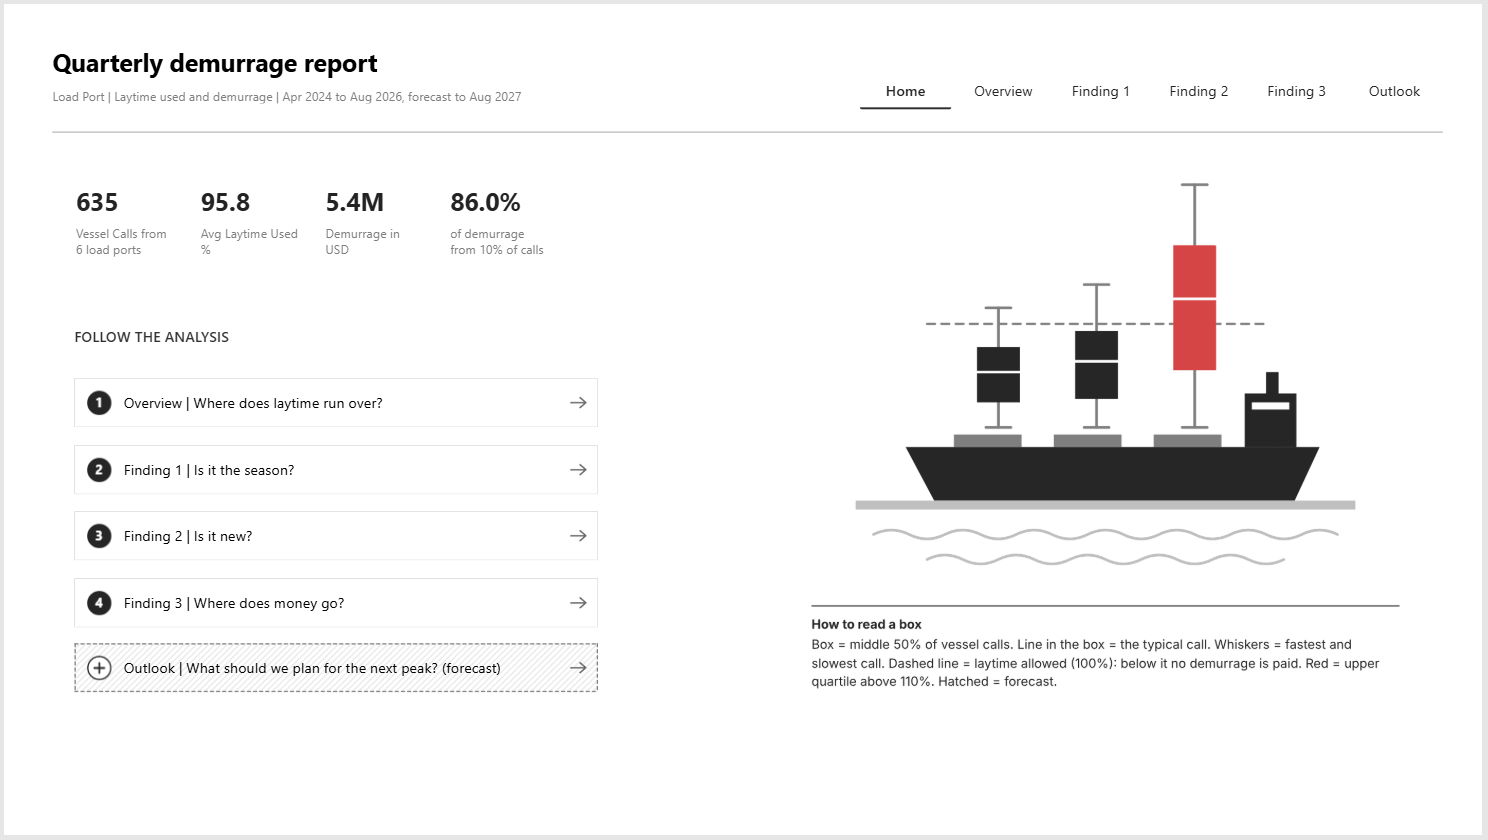
This Quarterly Demurrage Report showcases box and whisker plots built using Inforiver Analytics+. It tracks 635 vessel calls across 6 load ports from April 2024 to August 2026, showing the full spread of laytime used at each port, the demurrage it costs, and a forecast for the next peak season. Illustrative data, real port names. 

The report acts as a Port Performance Scorecard in Power BI, combining box plots, small multiples and conditional formatting in an IBCS-compliant layout. Five pre-calculated DAX measures draw each box, and a single rule turns any port red when its upper quartile runs past 110% of laytime. Overlapped box plots compare this season with last season, and forecast box plots show the expected spread for 2027 in hatched IBCS scenario notation. 

Designed as a guided analytics report, it follows one question per page: Where does laytime run over? Is it the season? Is it new? Where does the money go? Each page pairs the chart with a summary table, numbered comments and an action, so chartering, claims and trading teams can see what is driving the bill, not only how big it is. 

Download the report and explore box plots, overlapped and forecast box plots, and IBCS storytelling with Inforiver Analytics+.


iframe preview
View interactive content

Power BI Box Plots for Demurrage Risk: IBCS Quarterly Port Performance Report with Forecast

This Quarterly Demurrage Report showcases box and whisker plots built using Inforiver Analytics+. It tracks 635 vessel calls across 6 load ports from April 2024 to August 2026, showing the full spread of laytime used at each port, the demurrage it costs, and a forecast for the next peak season. Illustrative data, real port names.  The report acts as a Port Performance Scorecard in Power BI, combining box plots, small multiples and conditional formatting in an IBCS-compliant layout. Five pre-calculated DAX measures draw each box, and a single rule turns any port red when its upper quartile runs past 110% of laytime. Overlapped box plots compare this season with last season, and forecast box plots show the expected spread for 2027 in hatched IBCS scenario notation.  Designed as a guided analytics report, it follows one question per page: Where does laytime run over? Is it the season? Is it new? Where does the money go? Each page pairs the chart with a summary table, numbered comments and an action, so chartering, claims and trading teams can see what is driving the bill, not only how big it is.  Download the report and explore box plots, overlapped and forecast box plots, and IBCS storytelling with Inforiver Analytics+.

iframe preview
View interactive content

Download Report for Free

to try advance features

[demo_download_modal title="Power BI Box Plots for Demurrage Risk: IBCS Quarterly Port Performance Report with Forecast" link="https://inforiver.com/wp-content/uploads/quarterly-demurrage-report-shipping-demo.zip"]

Other Demos

Power BI Box Plots for Demurrage Risk: IBCS Quarterly Port Performance Report with Forecast

Explore a quarterly demurrage report built with Inforiver Analytics+ in Power BI. Analyze laytime usage across six load ports using box plots, seasonal comparisons, conditional formatting, and 2027 forecasts in an IBCS-compliant report layout.

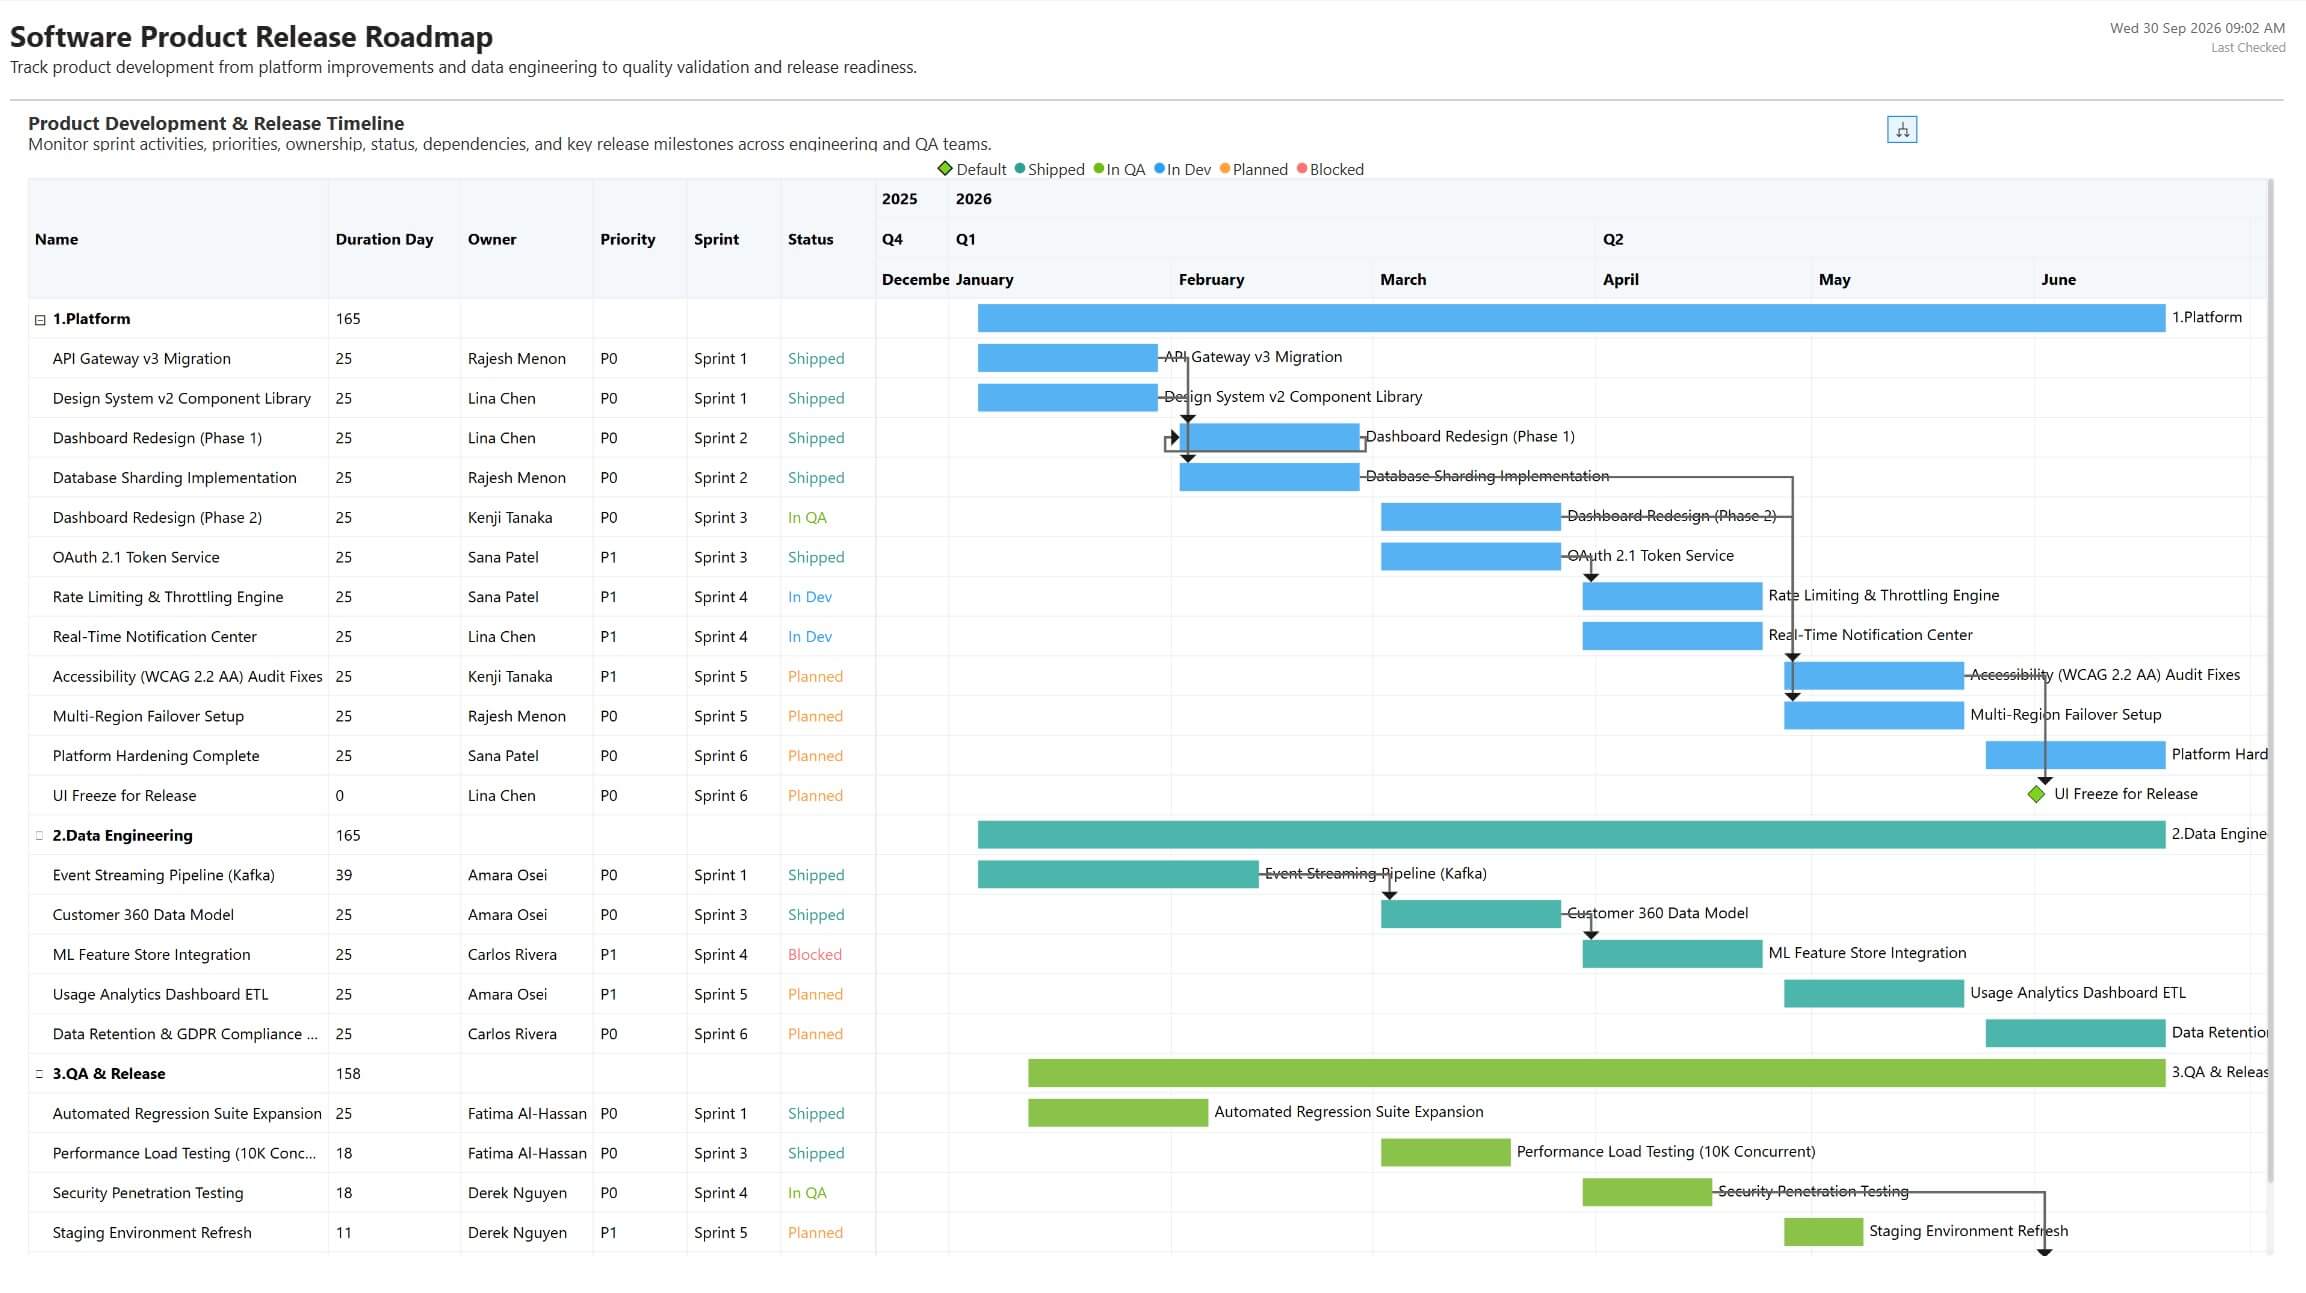
Gantt Chart for Software Product Release Roadmap in Power BI

Plan software releases with sprint timelines, task priorities, status tracking, dependencies, and release milestones in Power BI with Inforiver Analytics+.

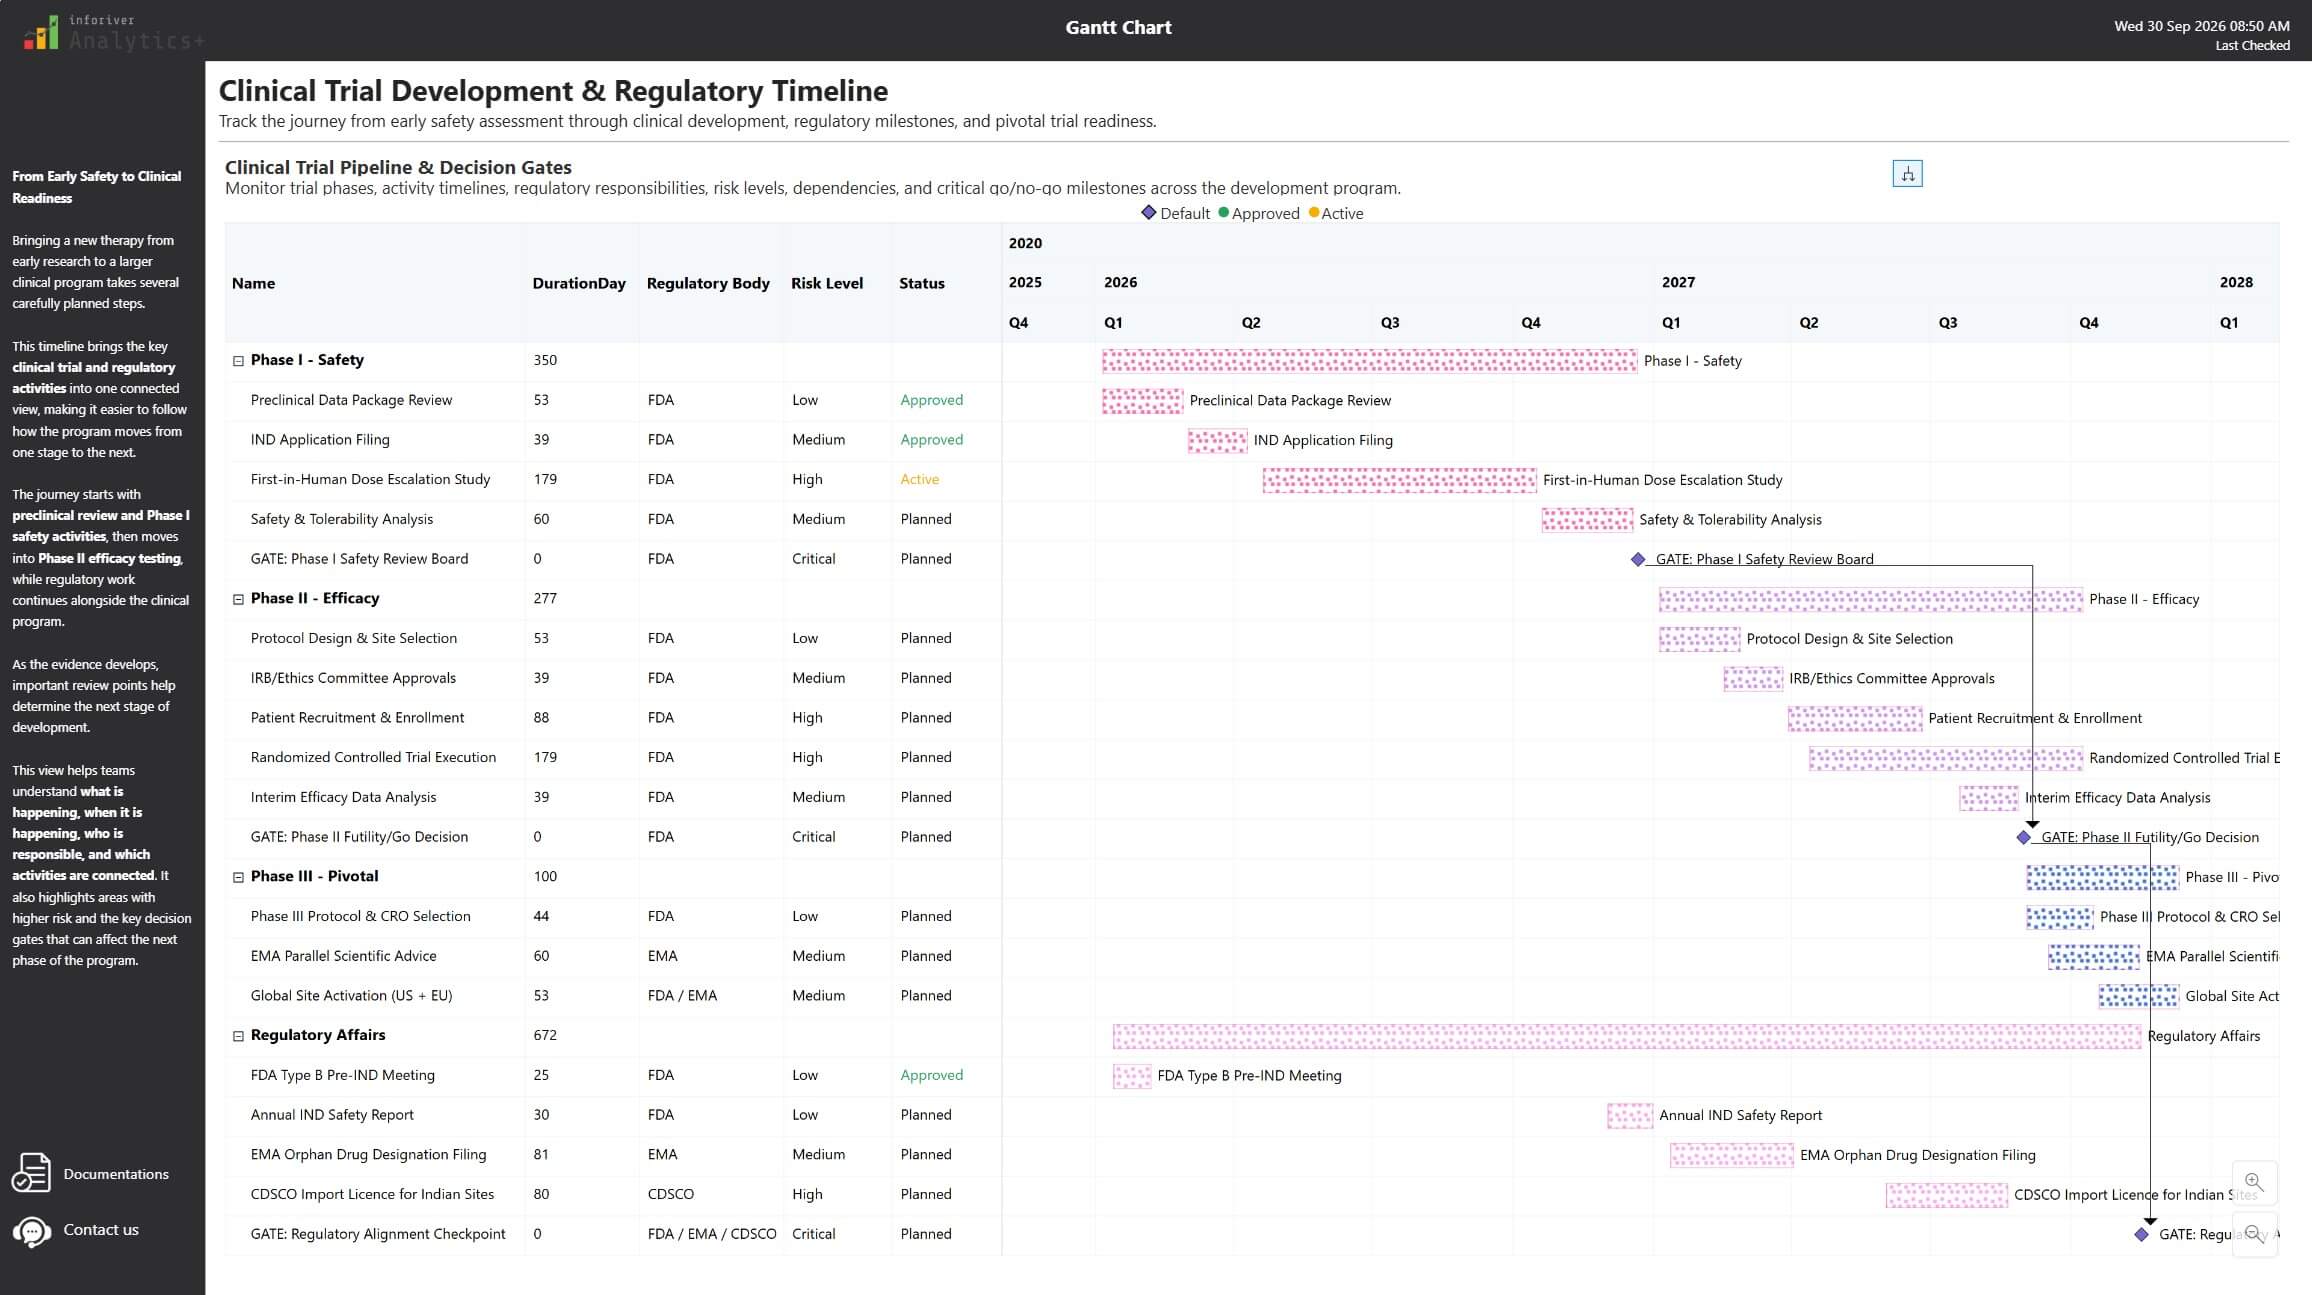
Gantt Chart for Clinical Trial Development & Regulatory Timeline

Manage clinical trial timelines with phase tracking, regulatory activities, risk visibility, dependencies, and critical decision gates in Power BI with Inforiver Analytics+.

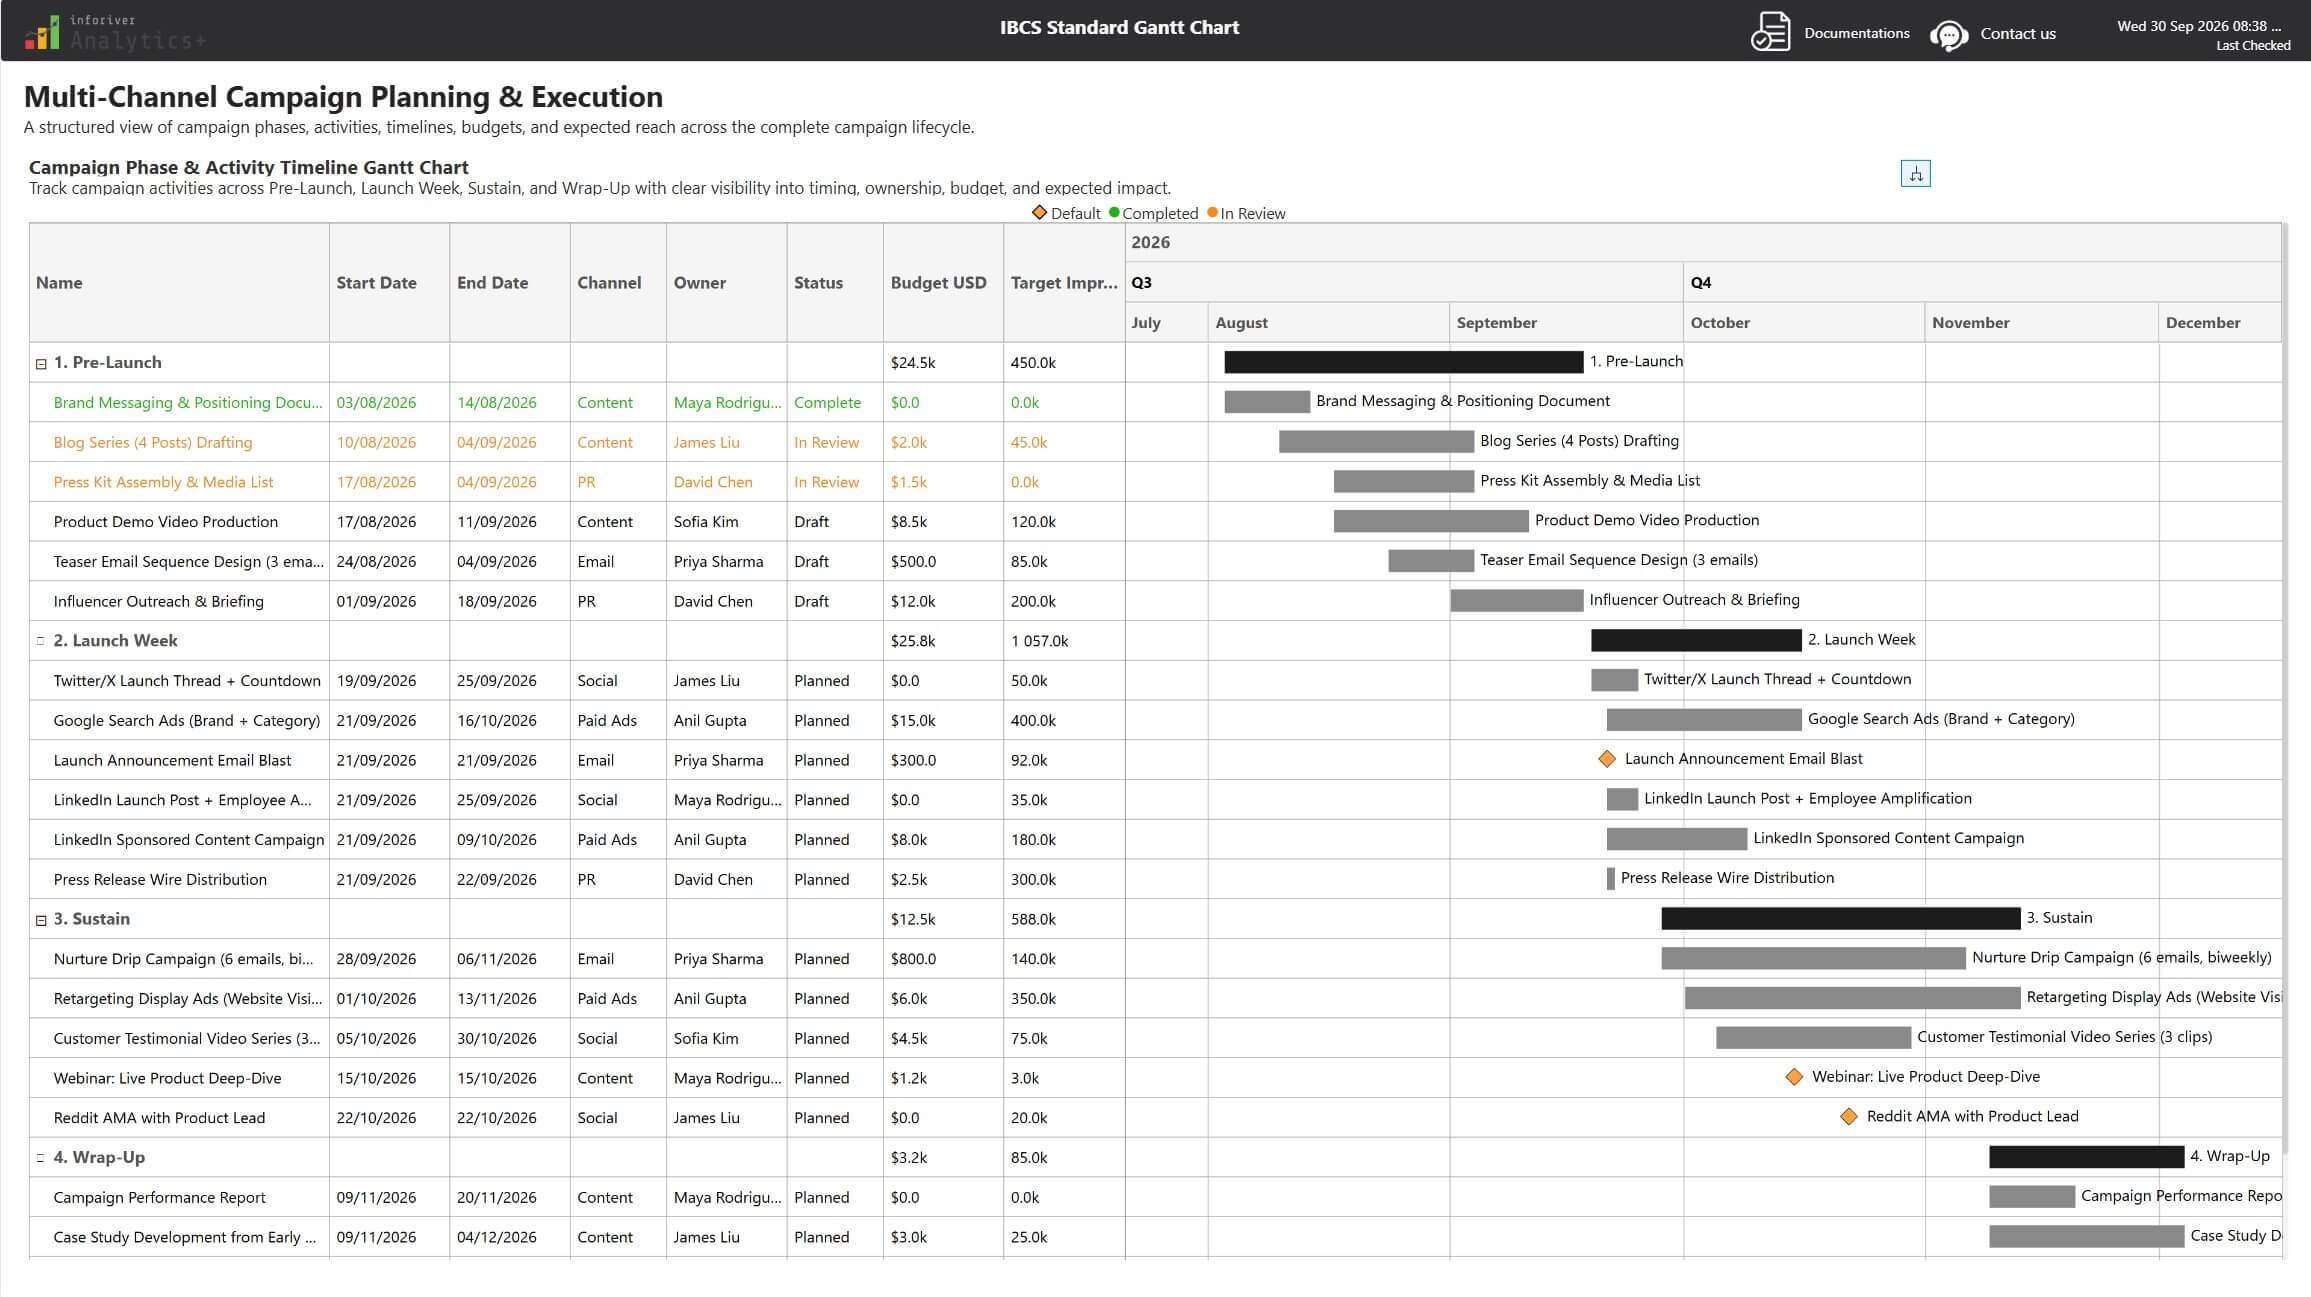
IBCS Gantt Chart for Multi-Channel Campaign Planning & Execution

Plan multi-channel campaigns with an IBCS-standard Gantt Chart, structured timelines, budgets, activities, and campaign phase tracking in Power BI.

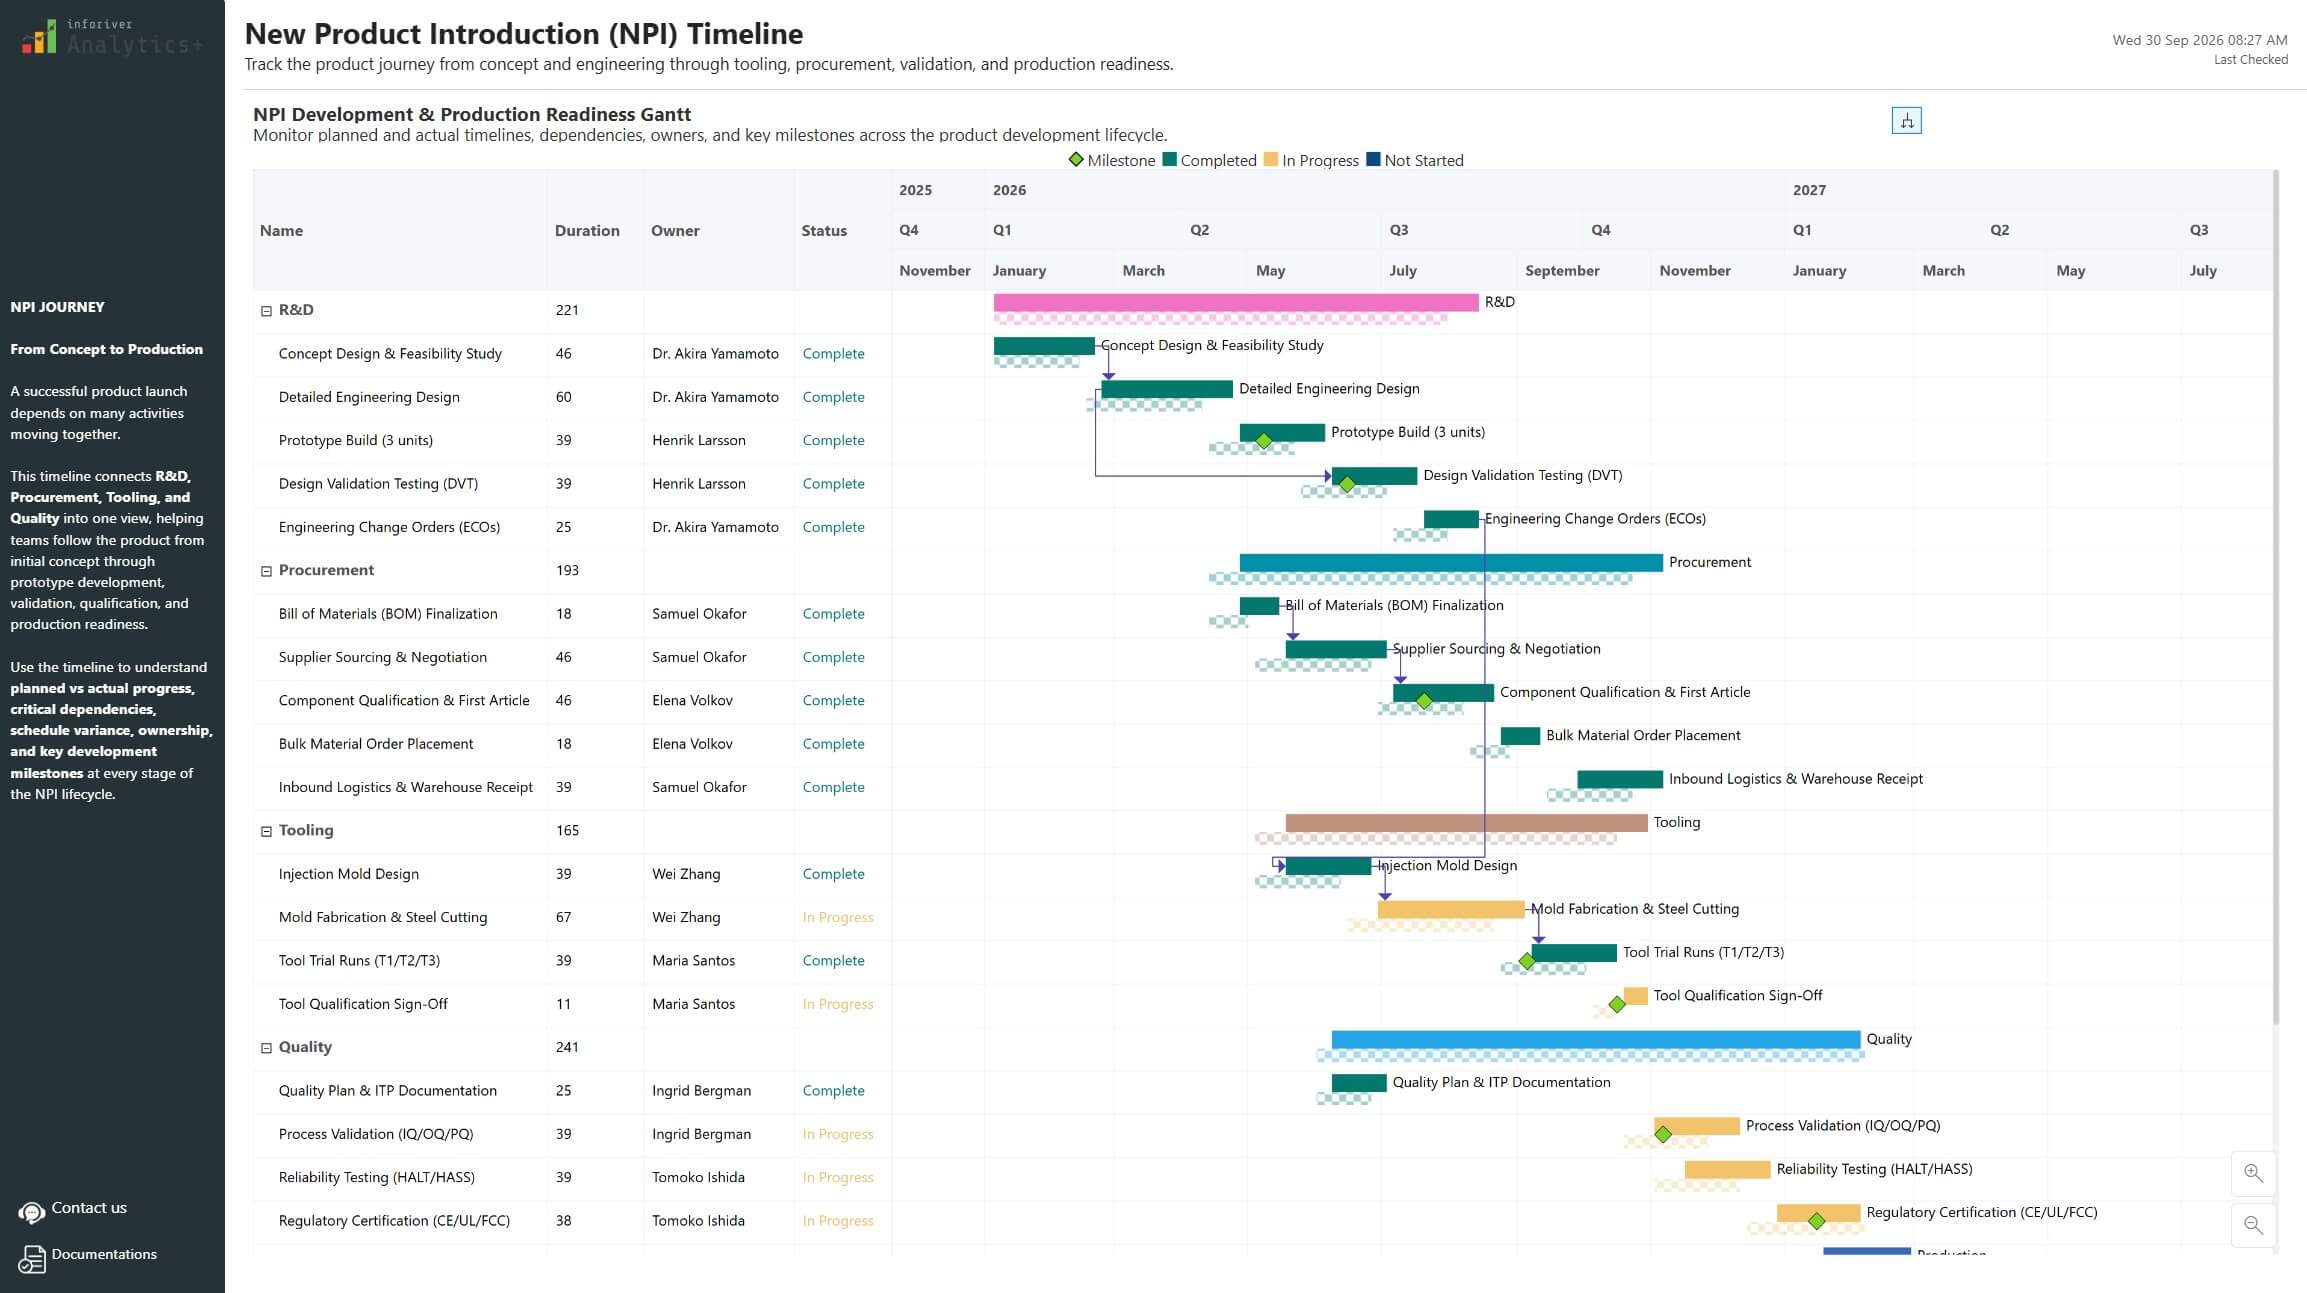
Gantt Chart for New Product Introduction (NPI) Timeline in Power BI

Track NPI execution with actual vs planned timelines, progress-based conditional formatting, RAG status, dependencies, and milestone tracking in Power BI.

Conference Event Planning Gantt Chart in Power BI

Plan and manage conference delivery with status flags, conditional grid formatting, task dependencies, connectors, and milestone tracking in Inforiver Analytics Plus Power BI.

Download Power BI Box Plots for Demurrage Risk: IBCS Quarterly Port Performance Report with Forecast

By clicking on Download PBIX File you agree to our terms and conditions and you acknowledge having read our EULAThe PBIX file is available only for limited duration

Get Inforiver brochure

Maximize your business potential with Inforiver's paginated reporting, data entry, planning & budgeting capabilities
Download now
Inforiver

Inforiver helps enterprises consolidate planning, reporting & analytics on a single platform (Power BI). The no-code, self-service award-winning platform has been recognized as the industry’s best and is adopted by many Fortune 100 firms.

Inforiver is a product of Lumel, the #1 Power BI AppSource Partner. The firm serves over 3,000 customers worldwide through its portfolio of products offered under the brands Inforiver, EDITable, ValQ, and xViz.

homemagnifiercross linkedin facebook pinterest youtube rss twitter instagram facebook-blank rss-blank linkedin-blank pinterest youtube twitter instagram