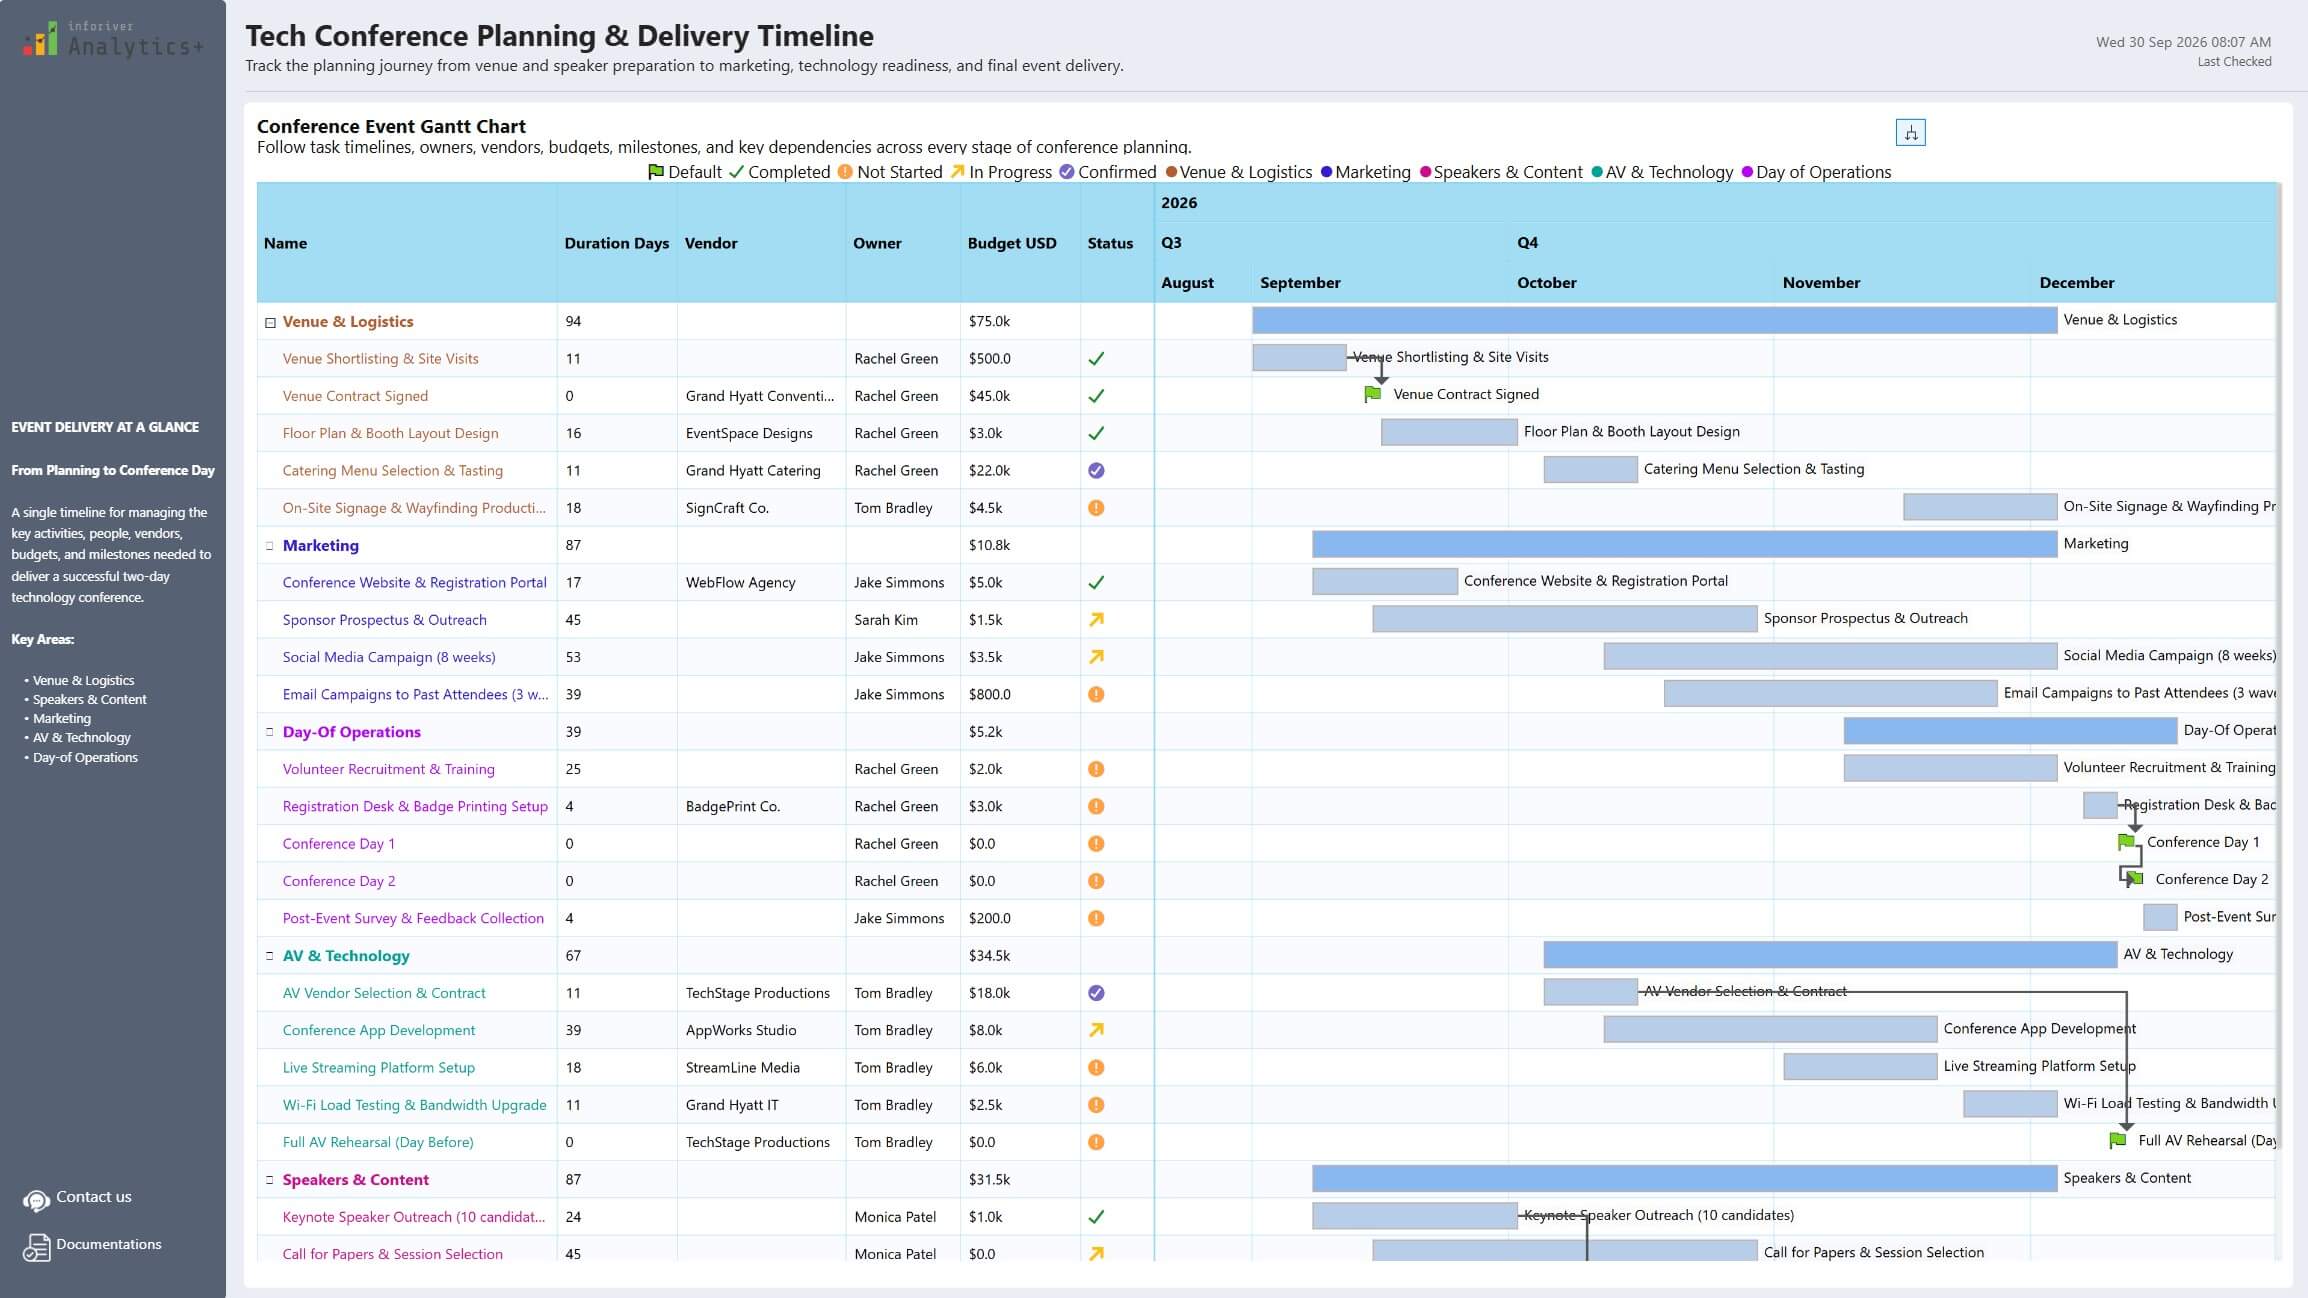
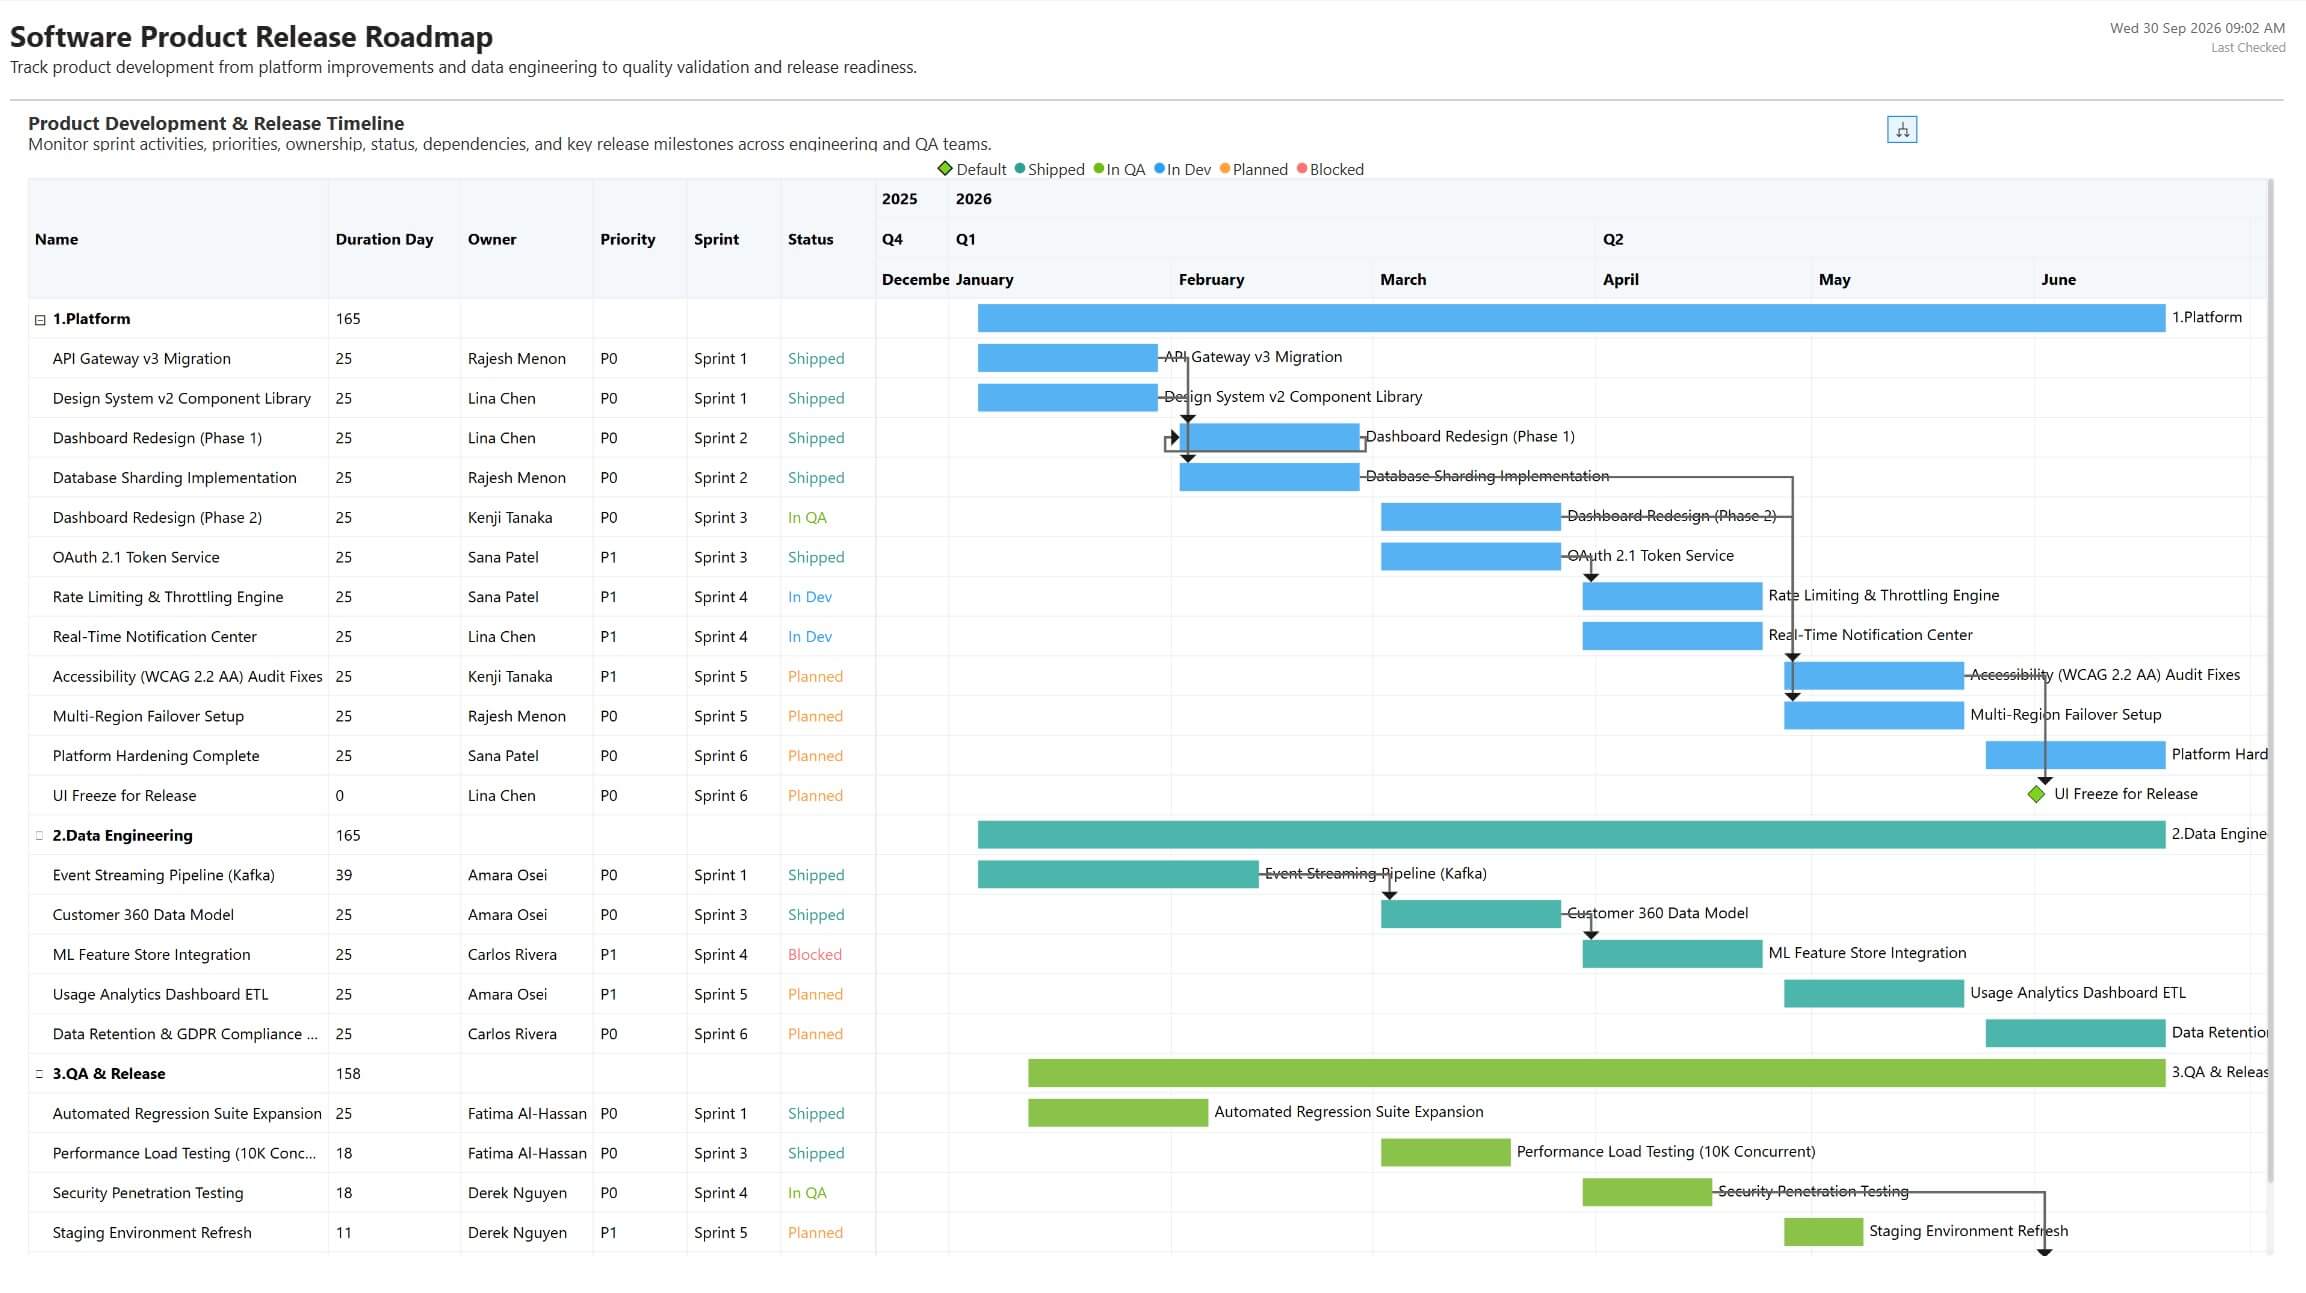
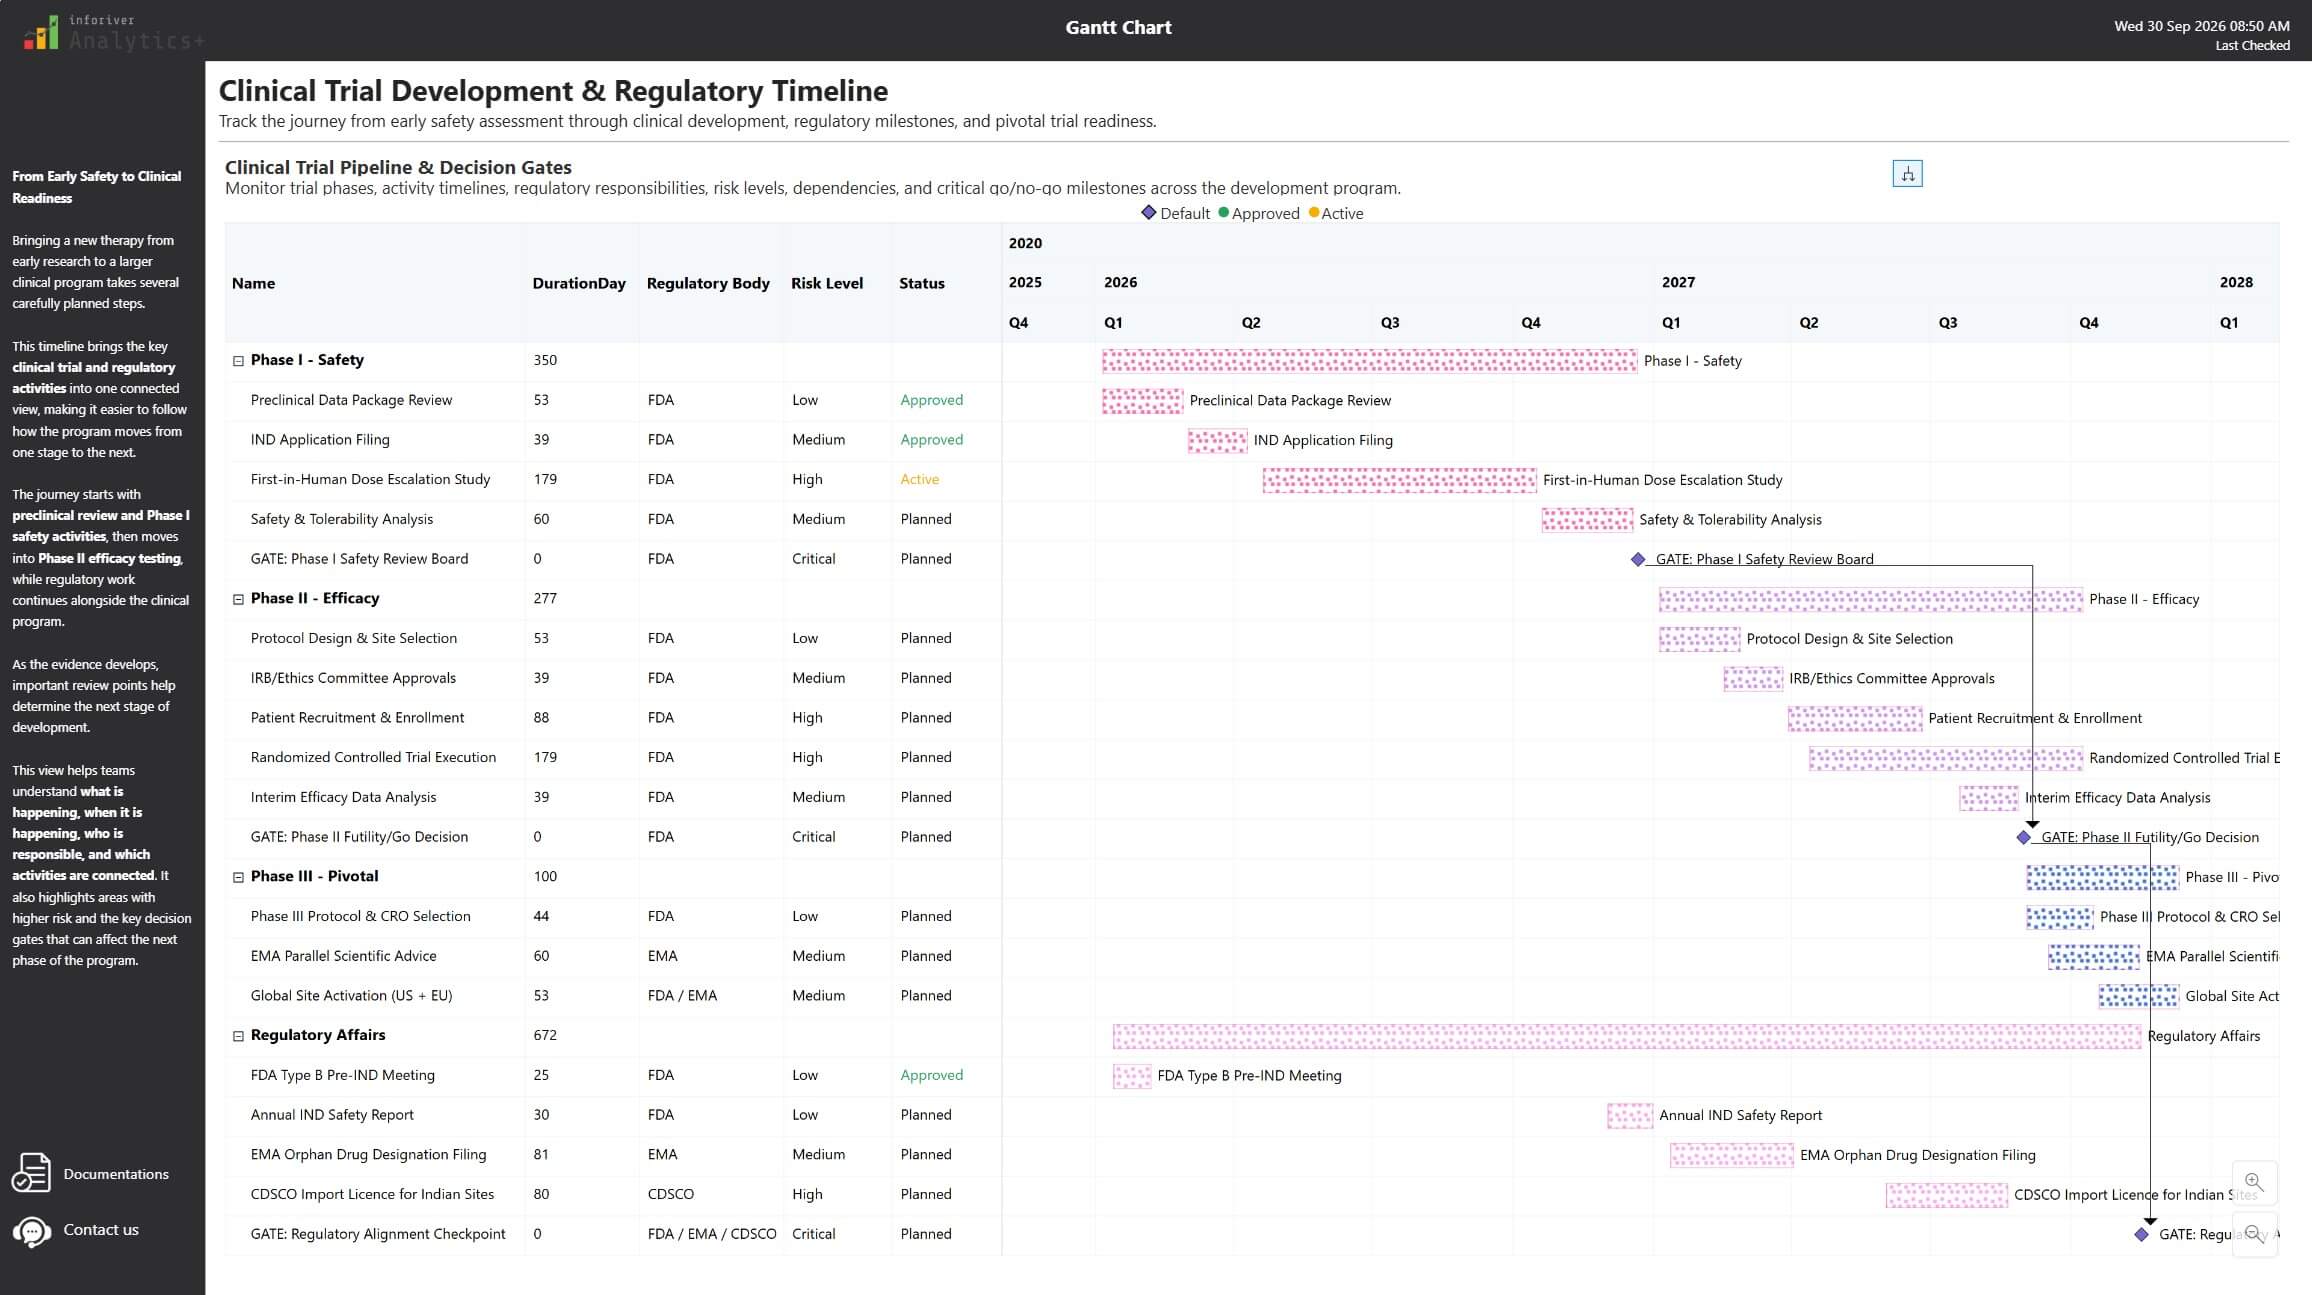
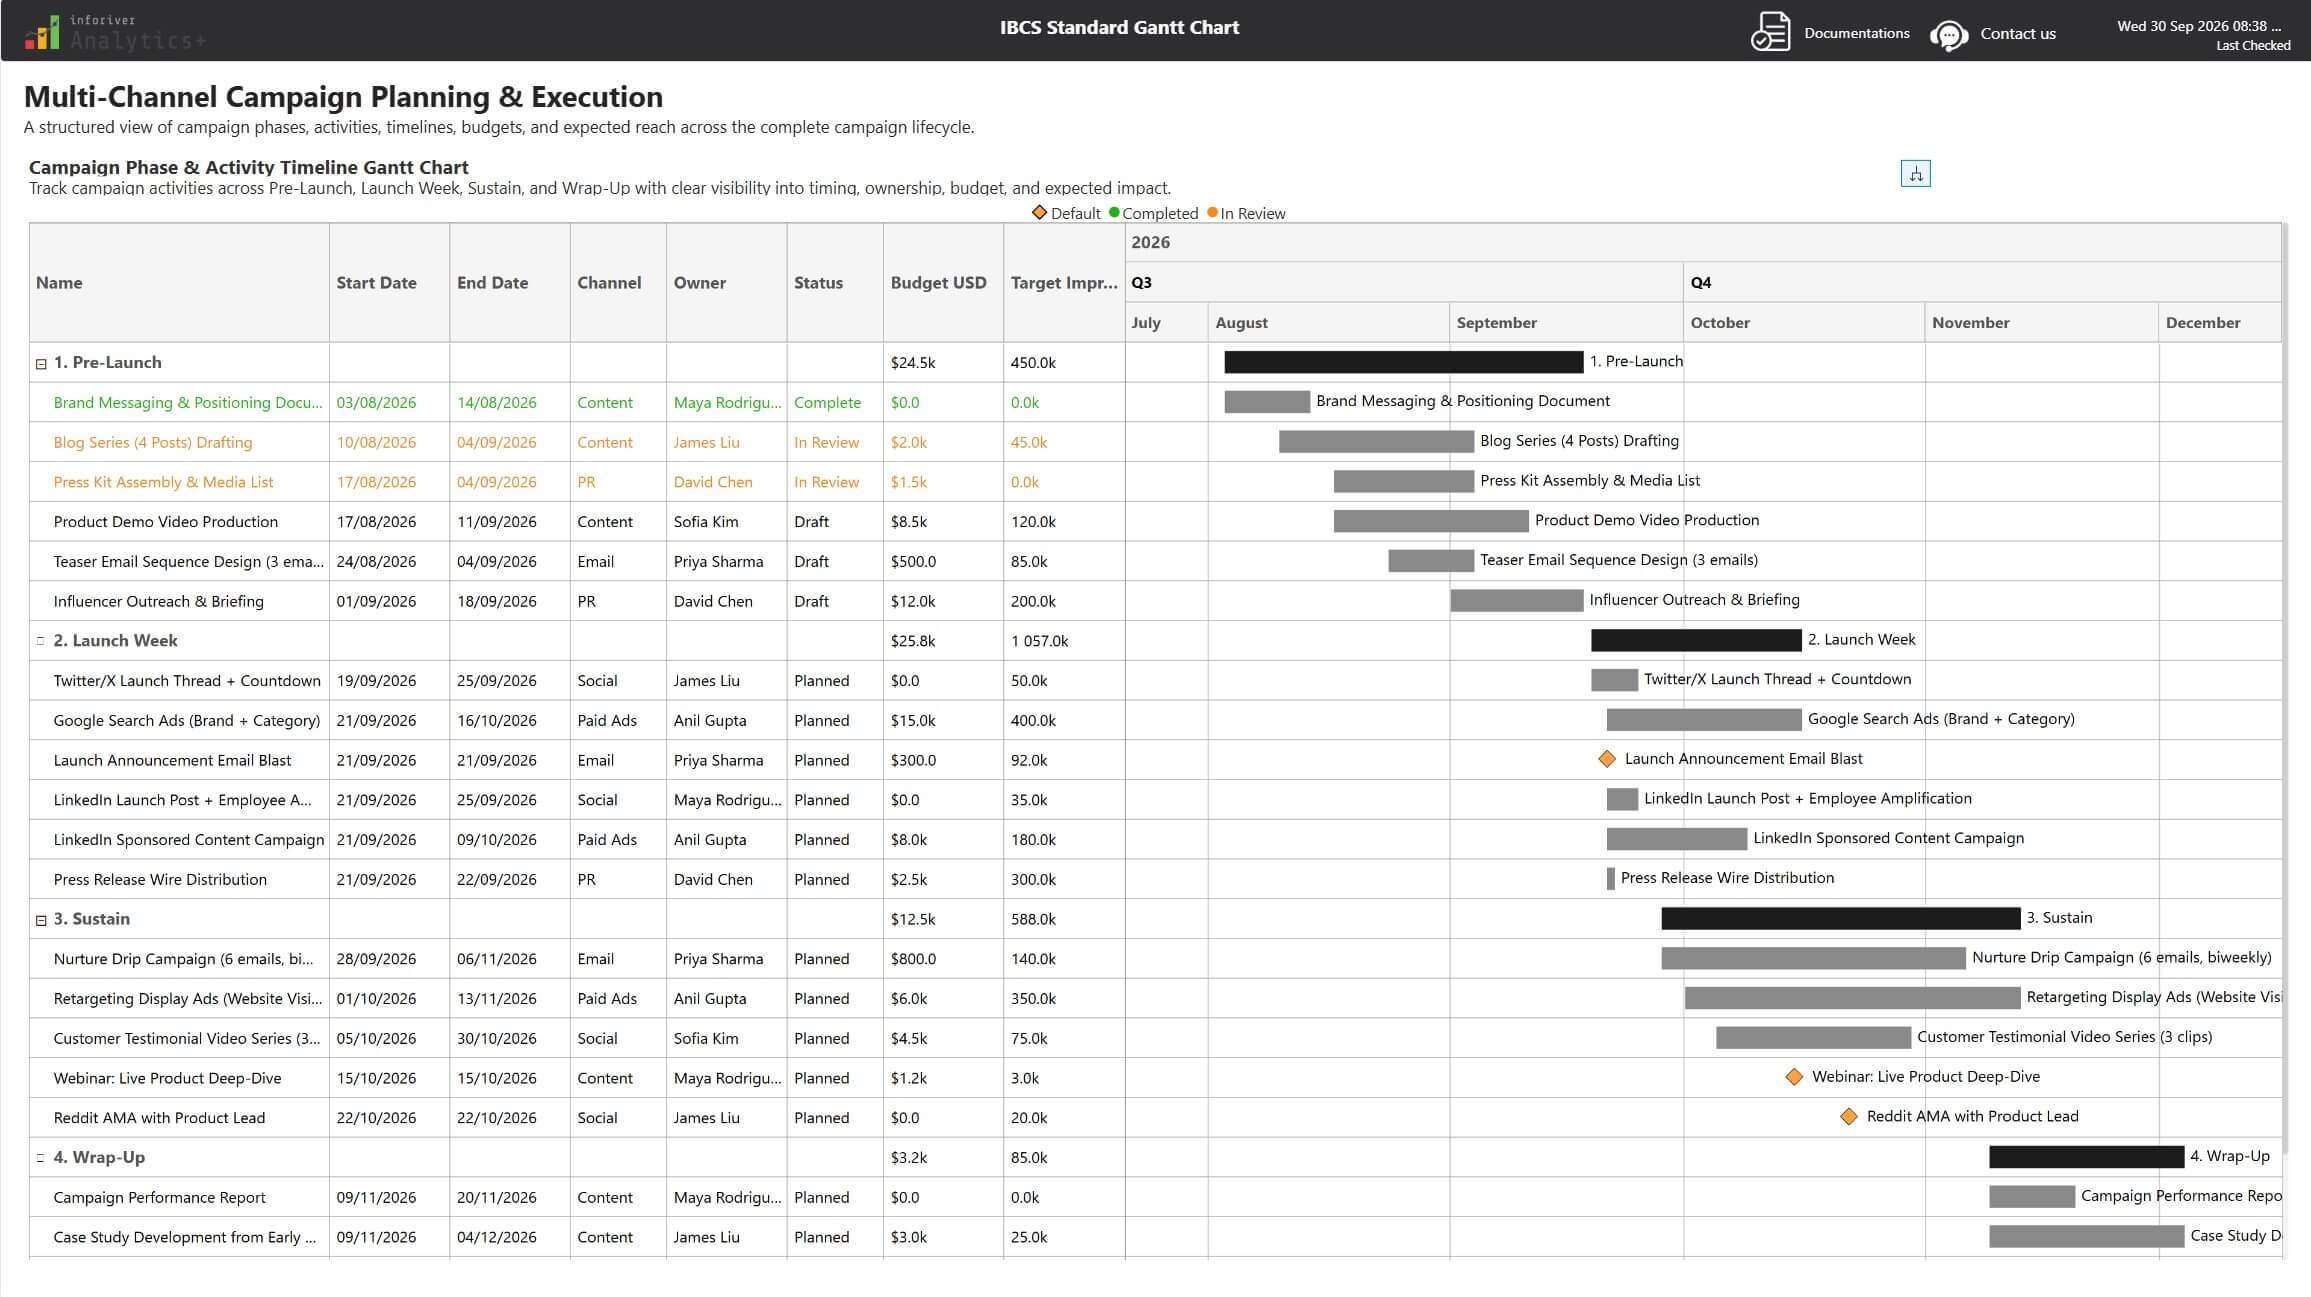
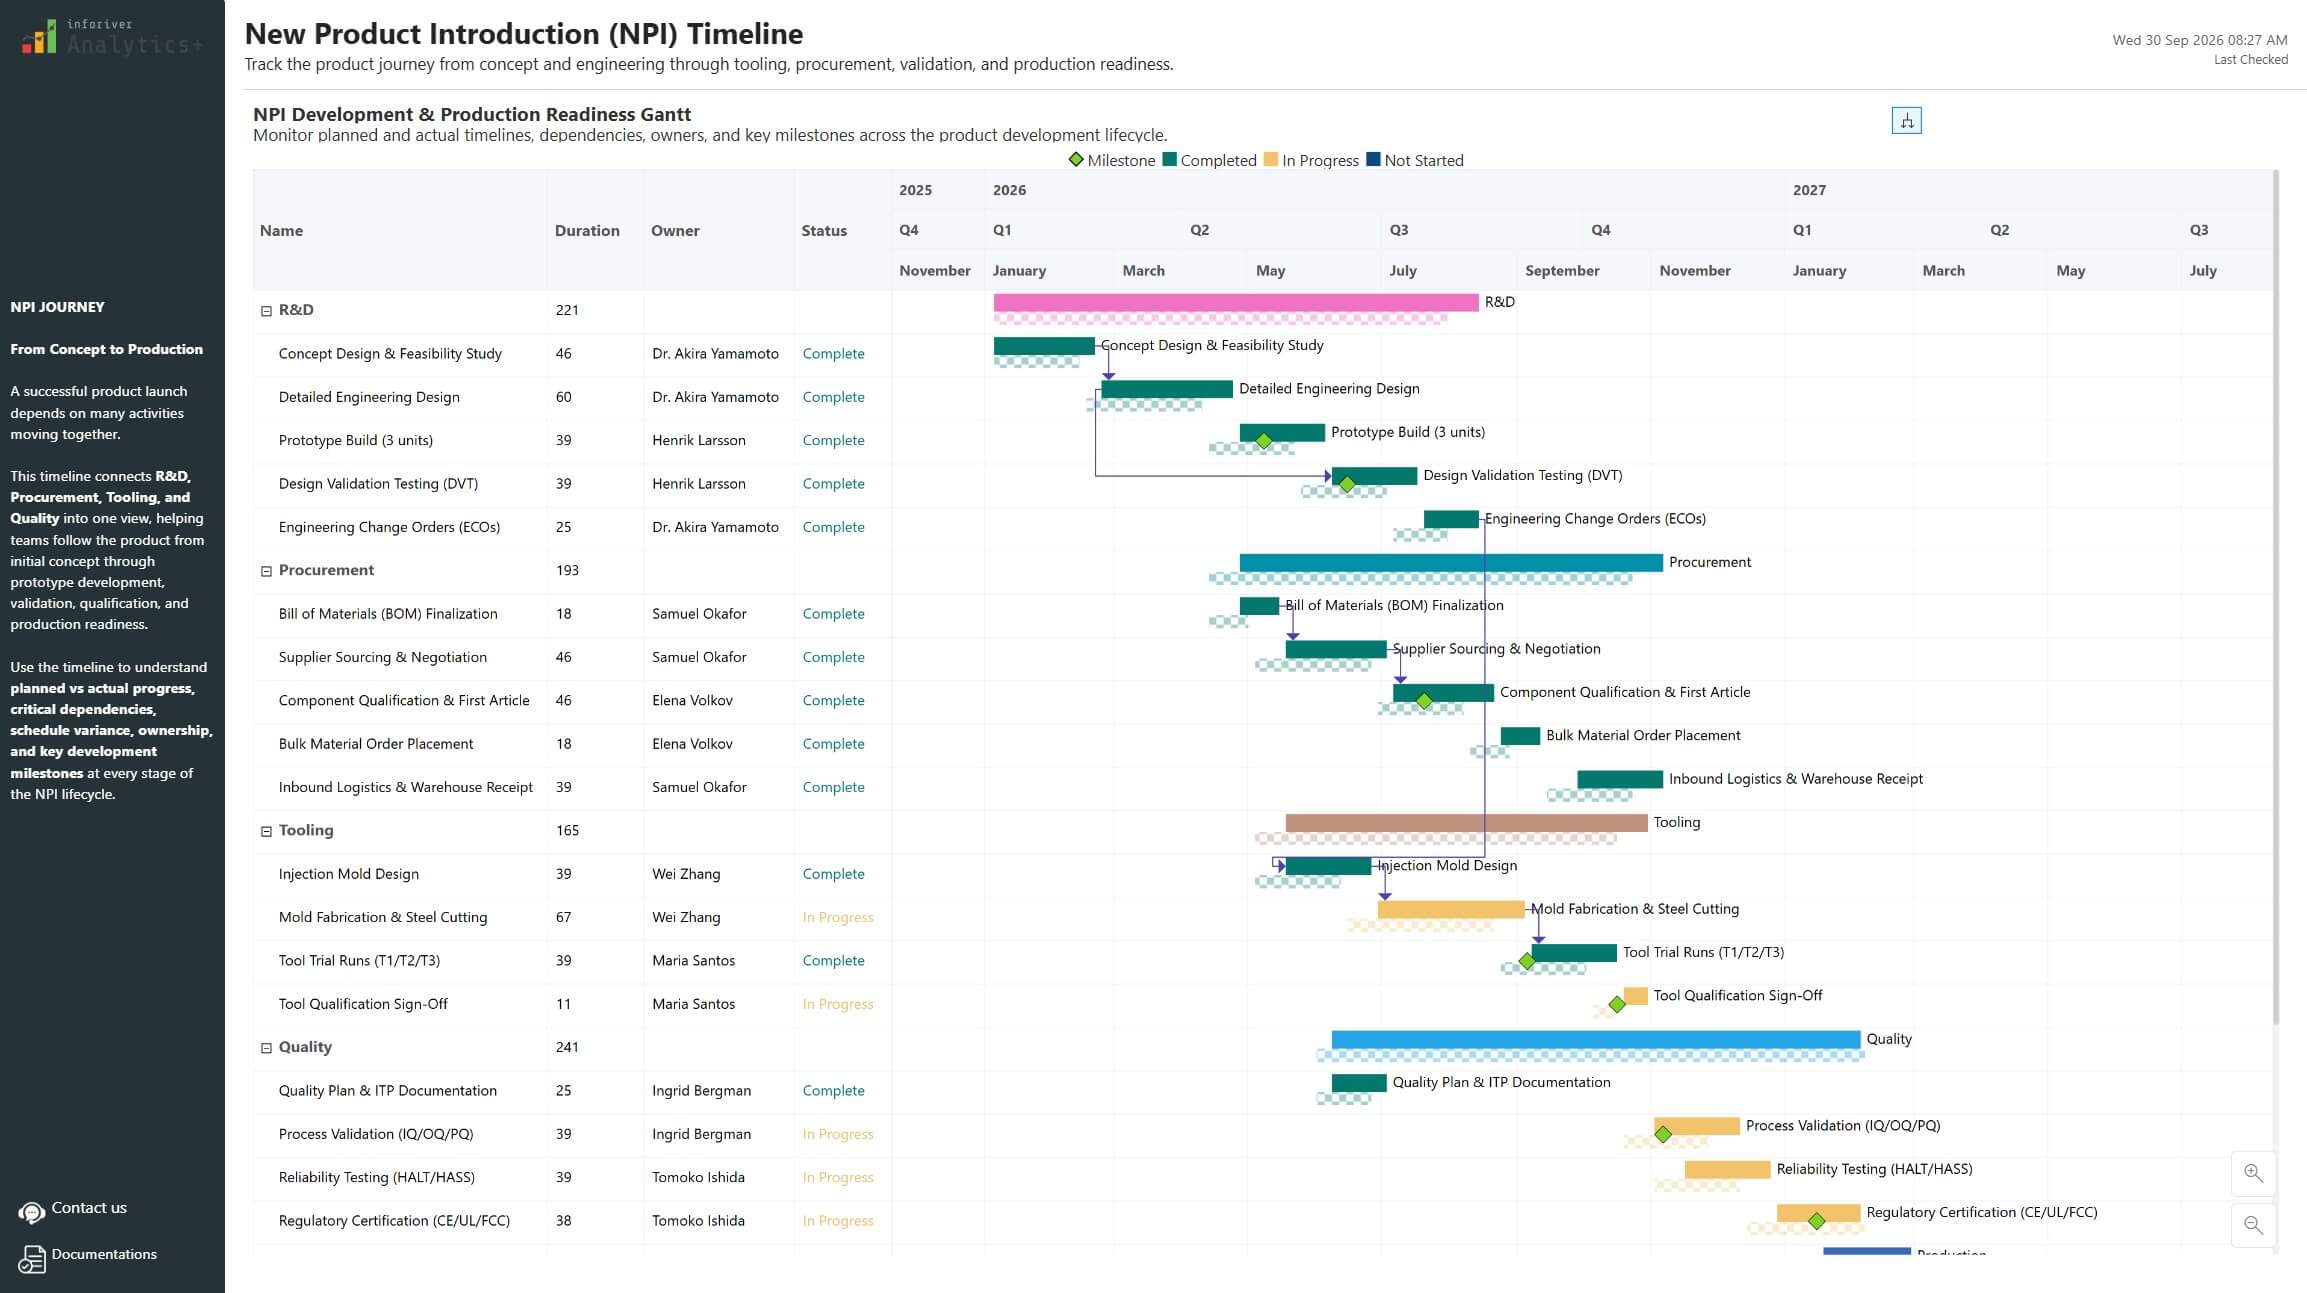
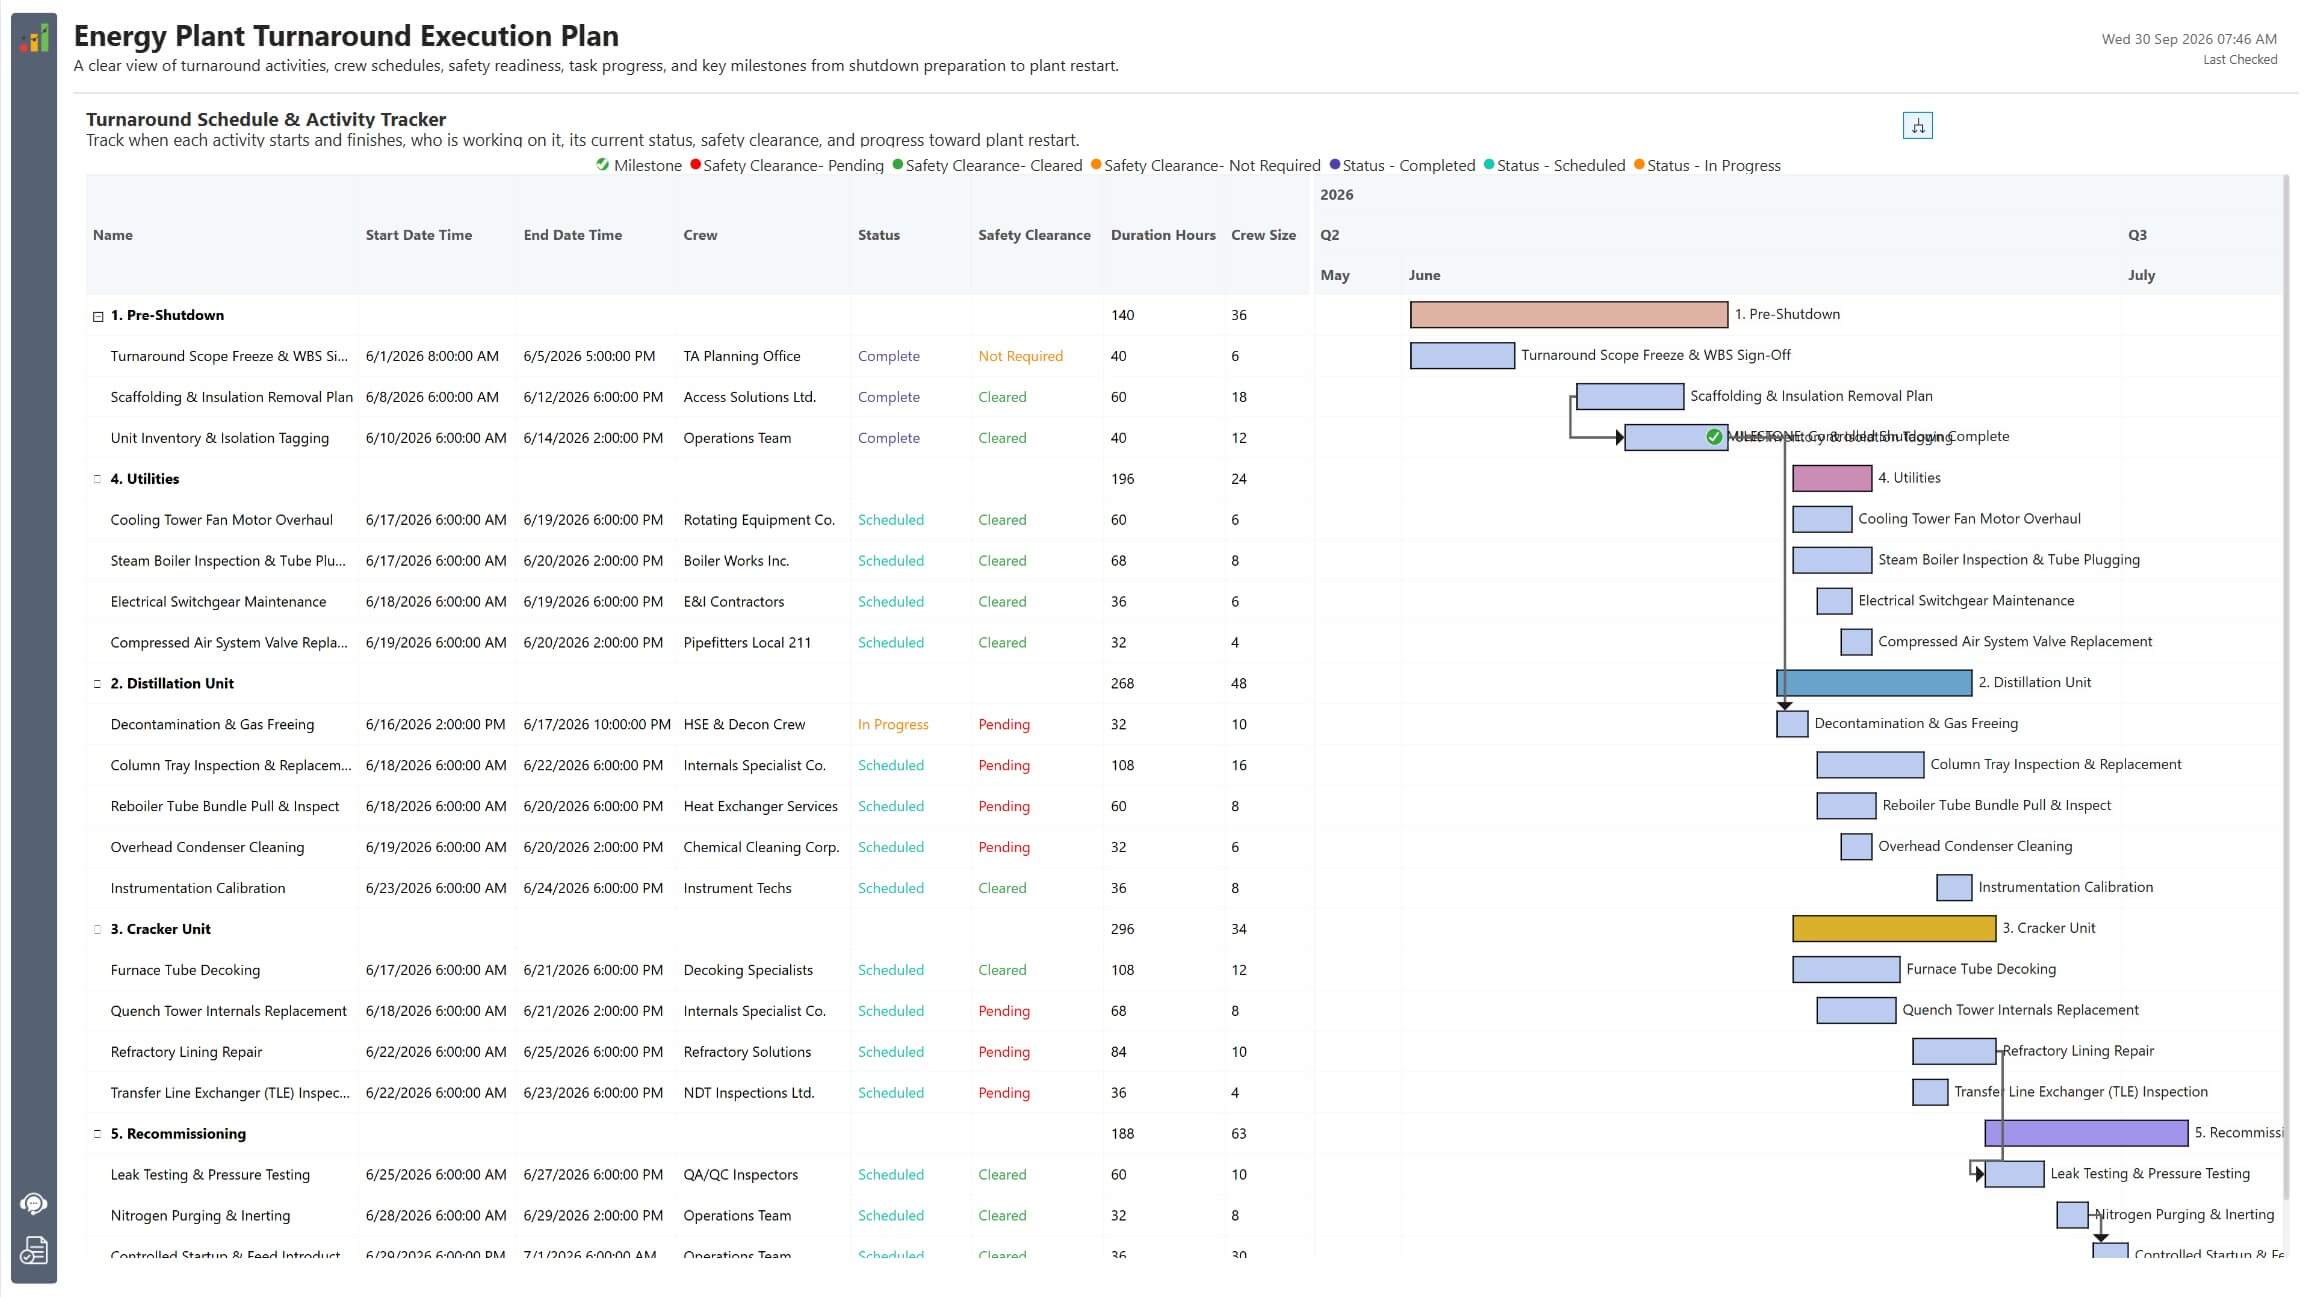
This Conference Event Planning Timeline showcases an interactive Power BI Gantt Chart built using Inforiver Analytics+. It provides a structured view of conference activities, vendors, owners, budgets, task status, dependencies, and key milestones from planning through event delivery.
The report acts as a Conference Project Management Dashboard in Power BI, covering areas such as Venue & Logistics, Marketing, Speakers & Content, AV & Technology, and Day-of Operations. Teams can track schedules, ownership, budgets, and execution status across every stage of the event.
Using the Status Flag Column and conditional formatting in the data grid, task status is made instantly visible through intuitive visual indicators and defined grid colors. Dependencies and connectors show how activities are linked, while milestones highlight important event deadlines and delivery points.
Designed for event planners, project managers, and conference teams, this dashboard brings planning, execution, and event readiness into one interactive timeline.
Download the report and explore conference event planning, Gantt Chart visualization, status tracking, dependencies, and milestone management in Power BI with Inforiver Analytics+.