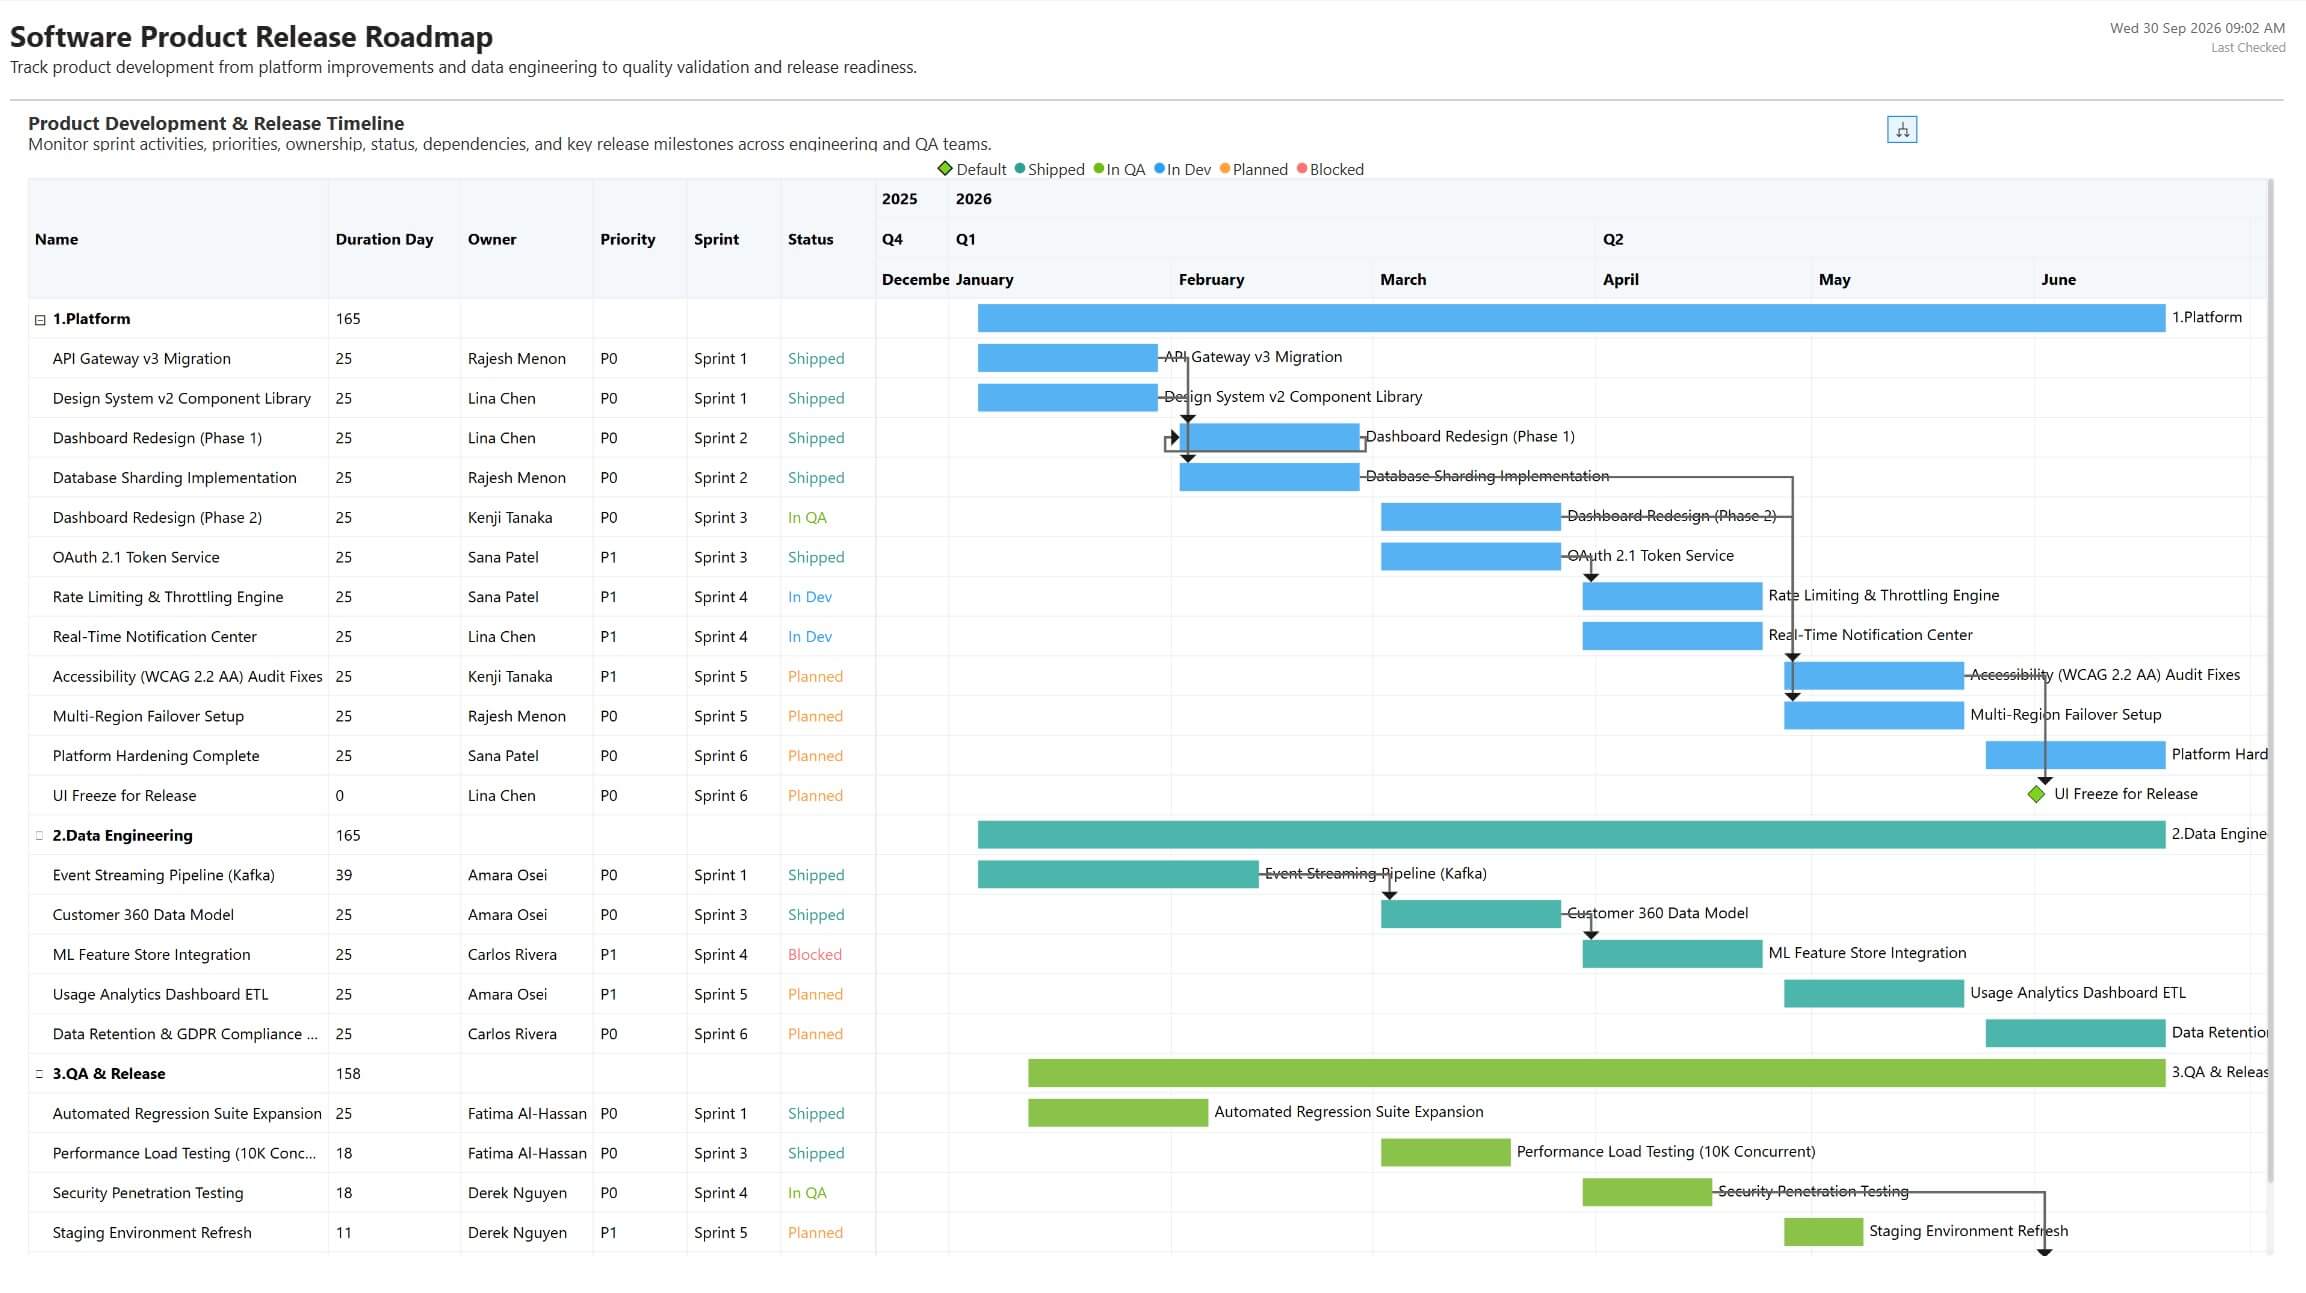
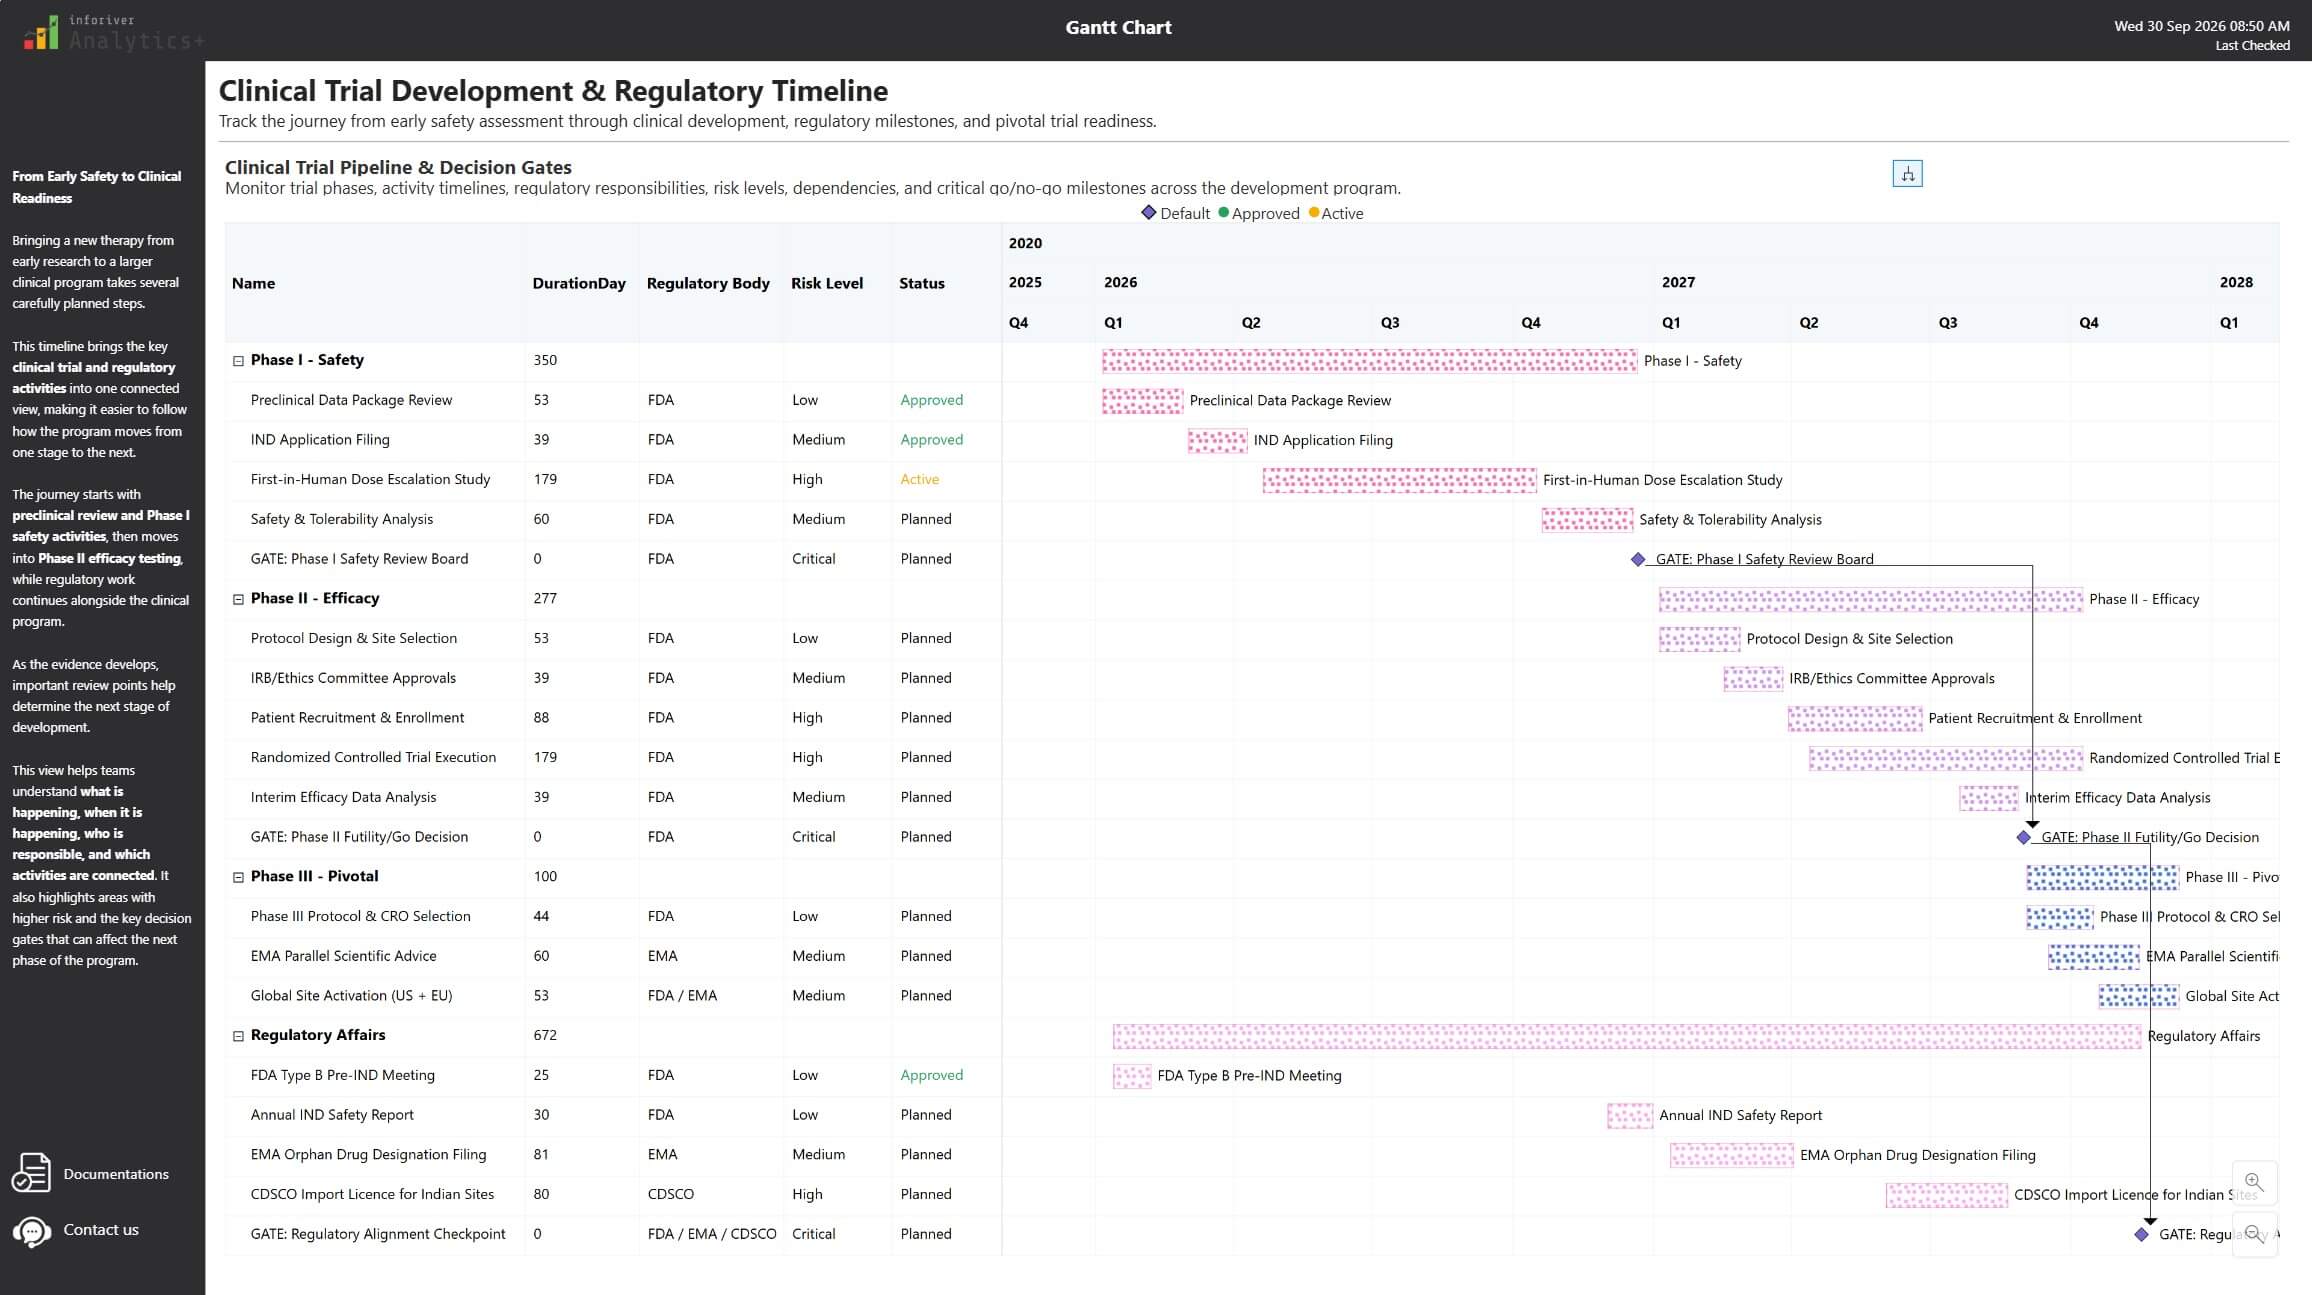
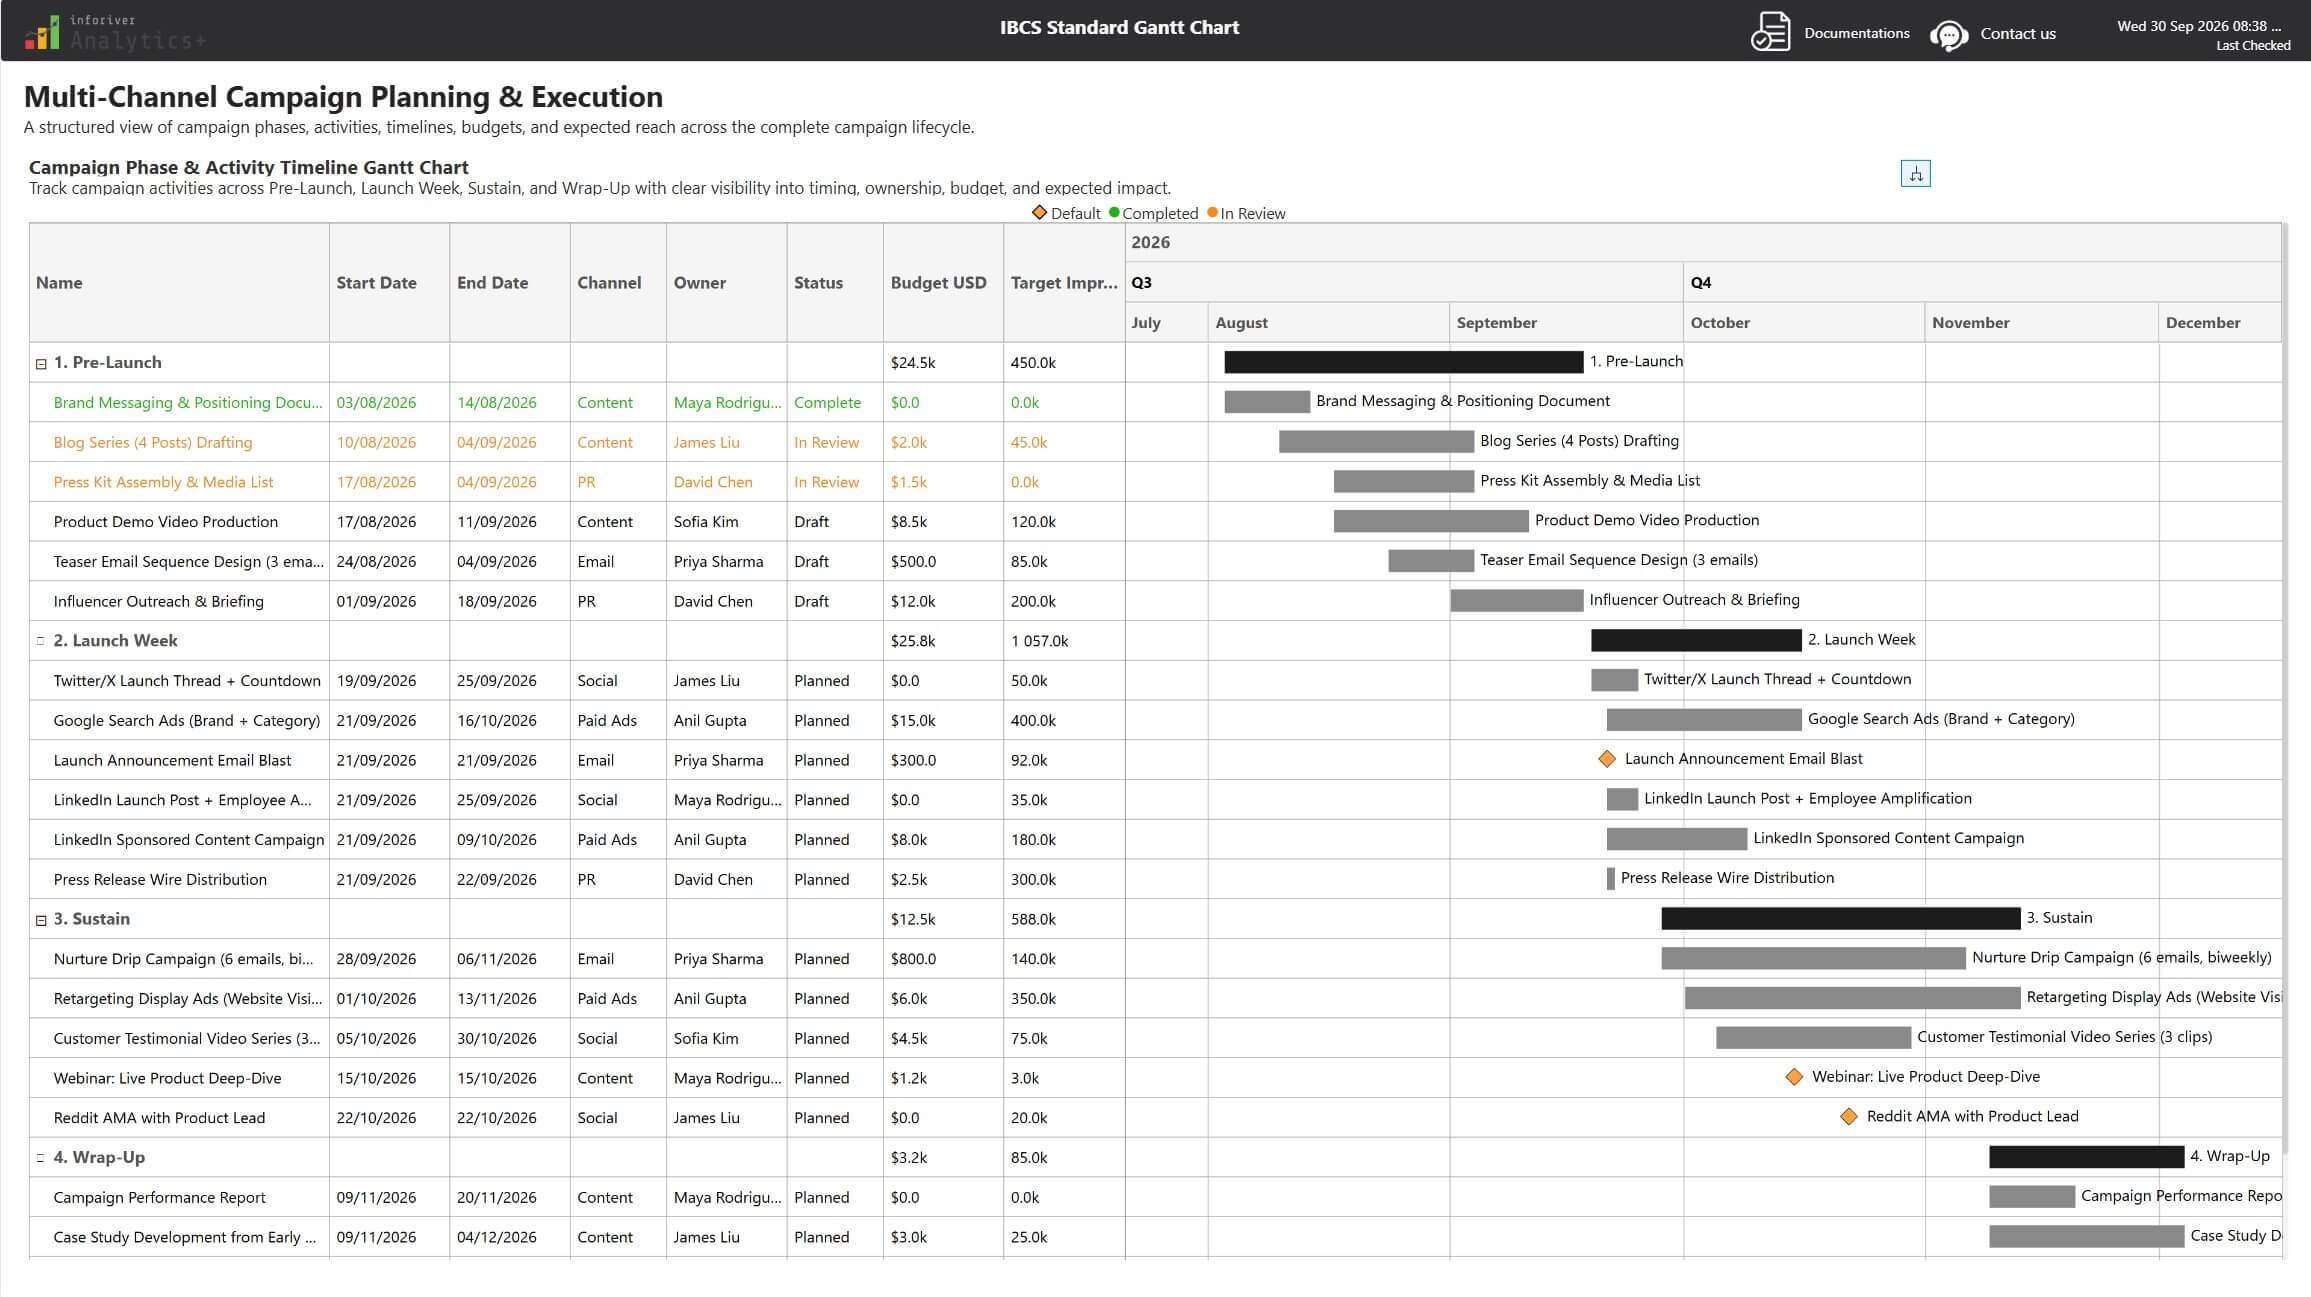
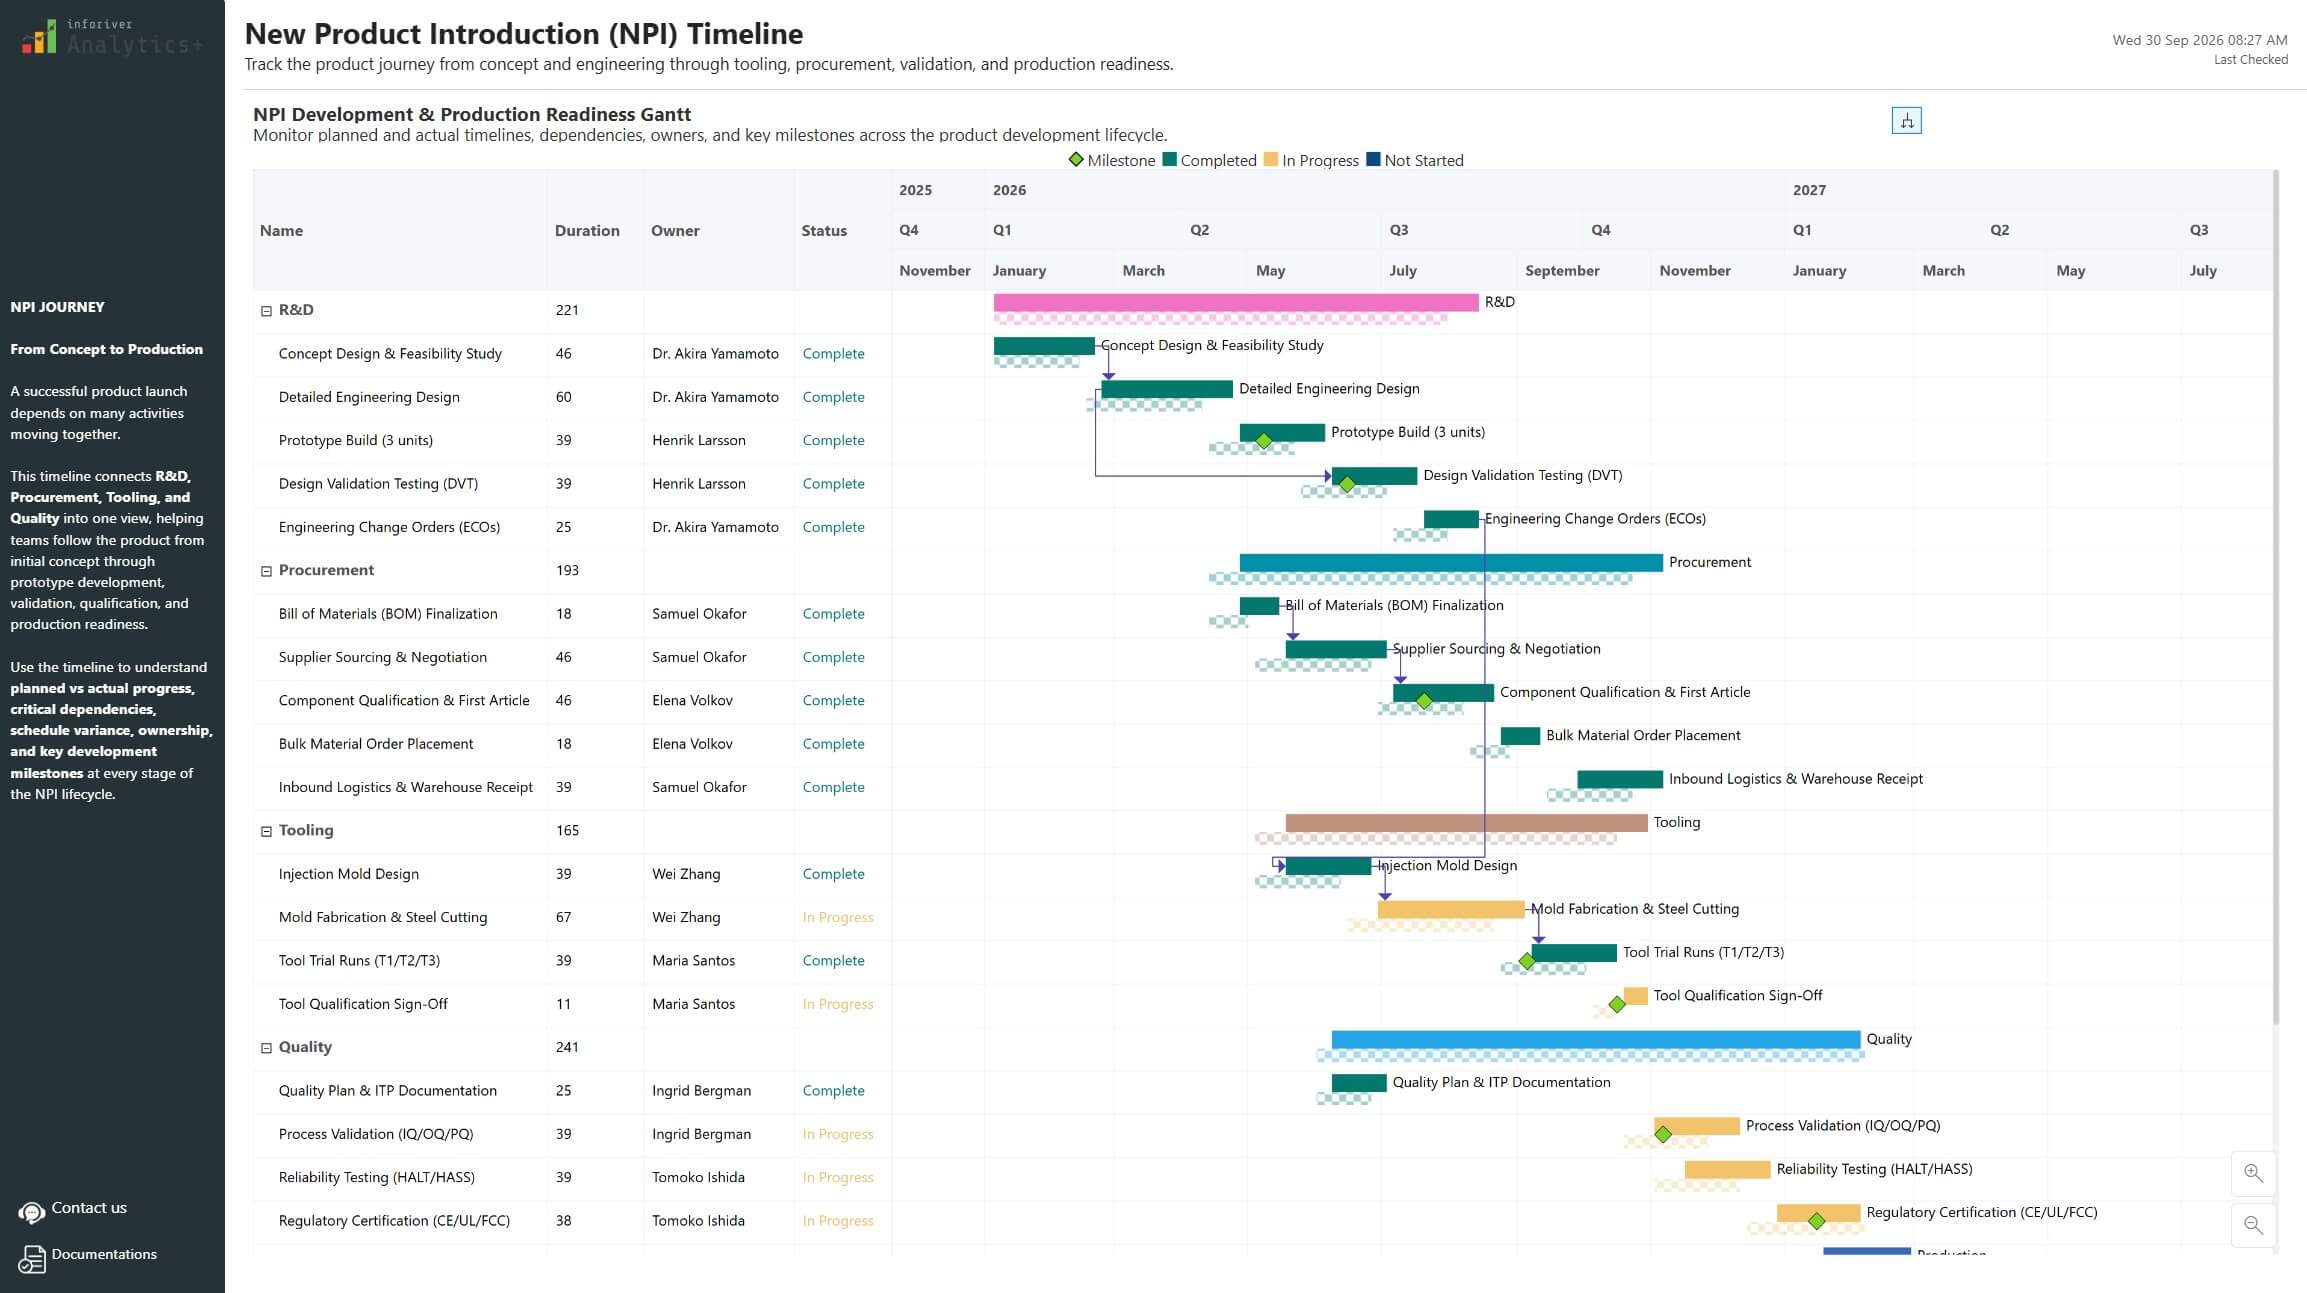
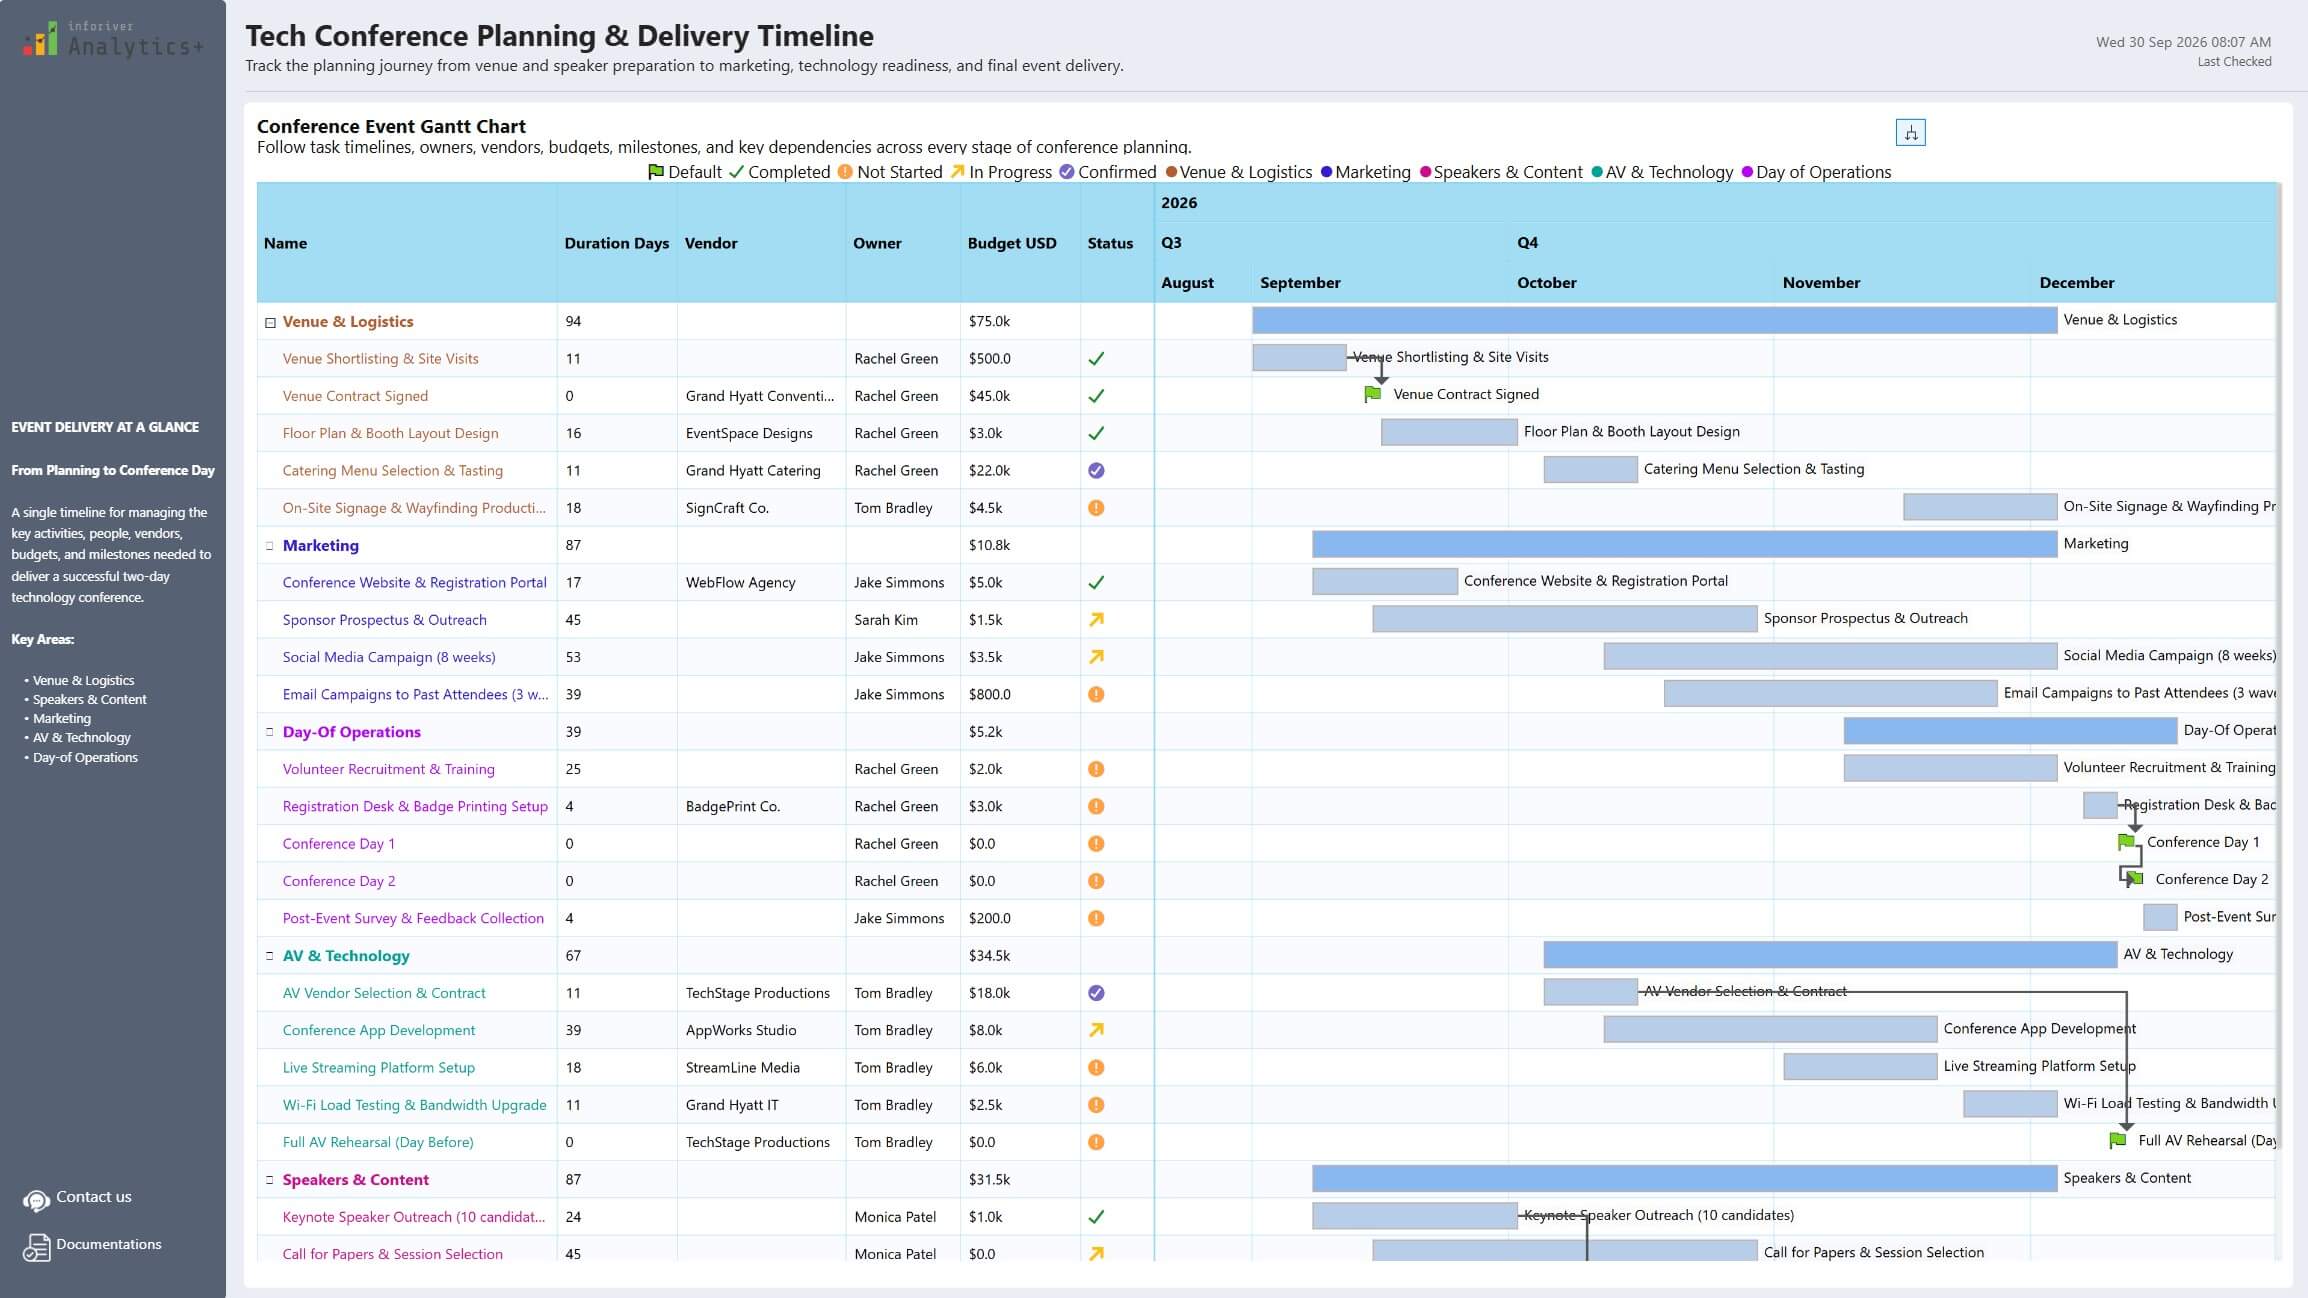
This Commercial Construction Project Timeline showcases an interactive Power BI Gantt Chart built using Inforiver Analytics+. It provides a clear view of construction phases, task schedules, progress, contractors, dependencies, and key project milestones.
The report acts as a Construction Project Management Dashboard in Power BI, covering major phases from Pre-Construction and Foundation to Structural, MEP Systems, and Finishing. Project teams can monitor task progress, understand dependencies, and track planned timelines across the construction lifecycle.
Using the Inforiver Gantt Chart in Power BI, stakeholders can quickly identify completed, in-progress, and upcoming activities while keeping key milestones visible alongside the project schedule.
Designed for construction project managers, contractors, and PMOs, this dashboard makes complex project timelines easier to understand and monitor.
Download the report and explore construction project planning, Gantt Chart visualization, and milestone tracking in Power BI with Inforiver Analytics+.