
Upcoming webinar on 'Inforiver Charts : The fastest way to deliver stories in Power BI', Aug 29th , Monday, 10.30 AM CST. Register Now
Upcoming webinar on 'Inforiver Charts : The fastest way to deliver stories in Power BI', Aug 29th , Monday, 10.30 AM CST. Register Now
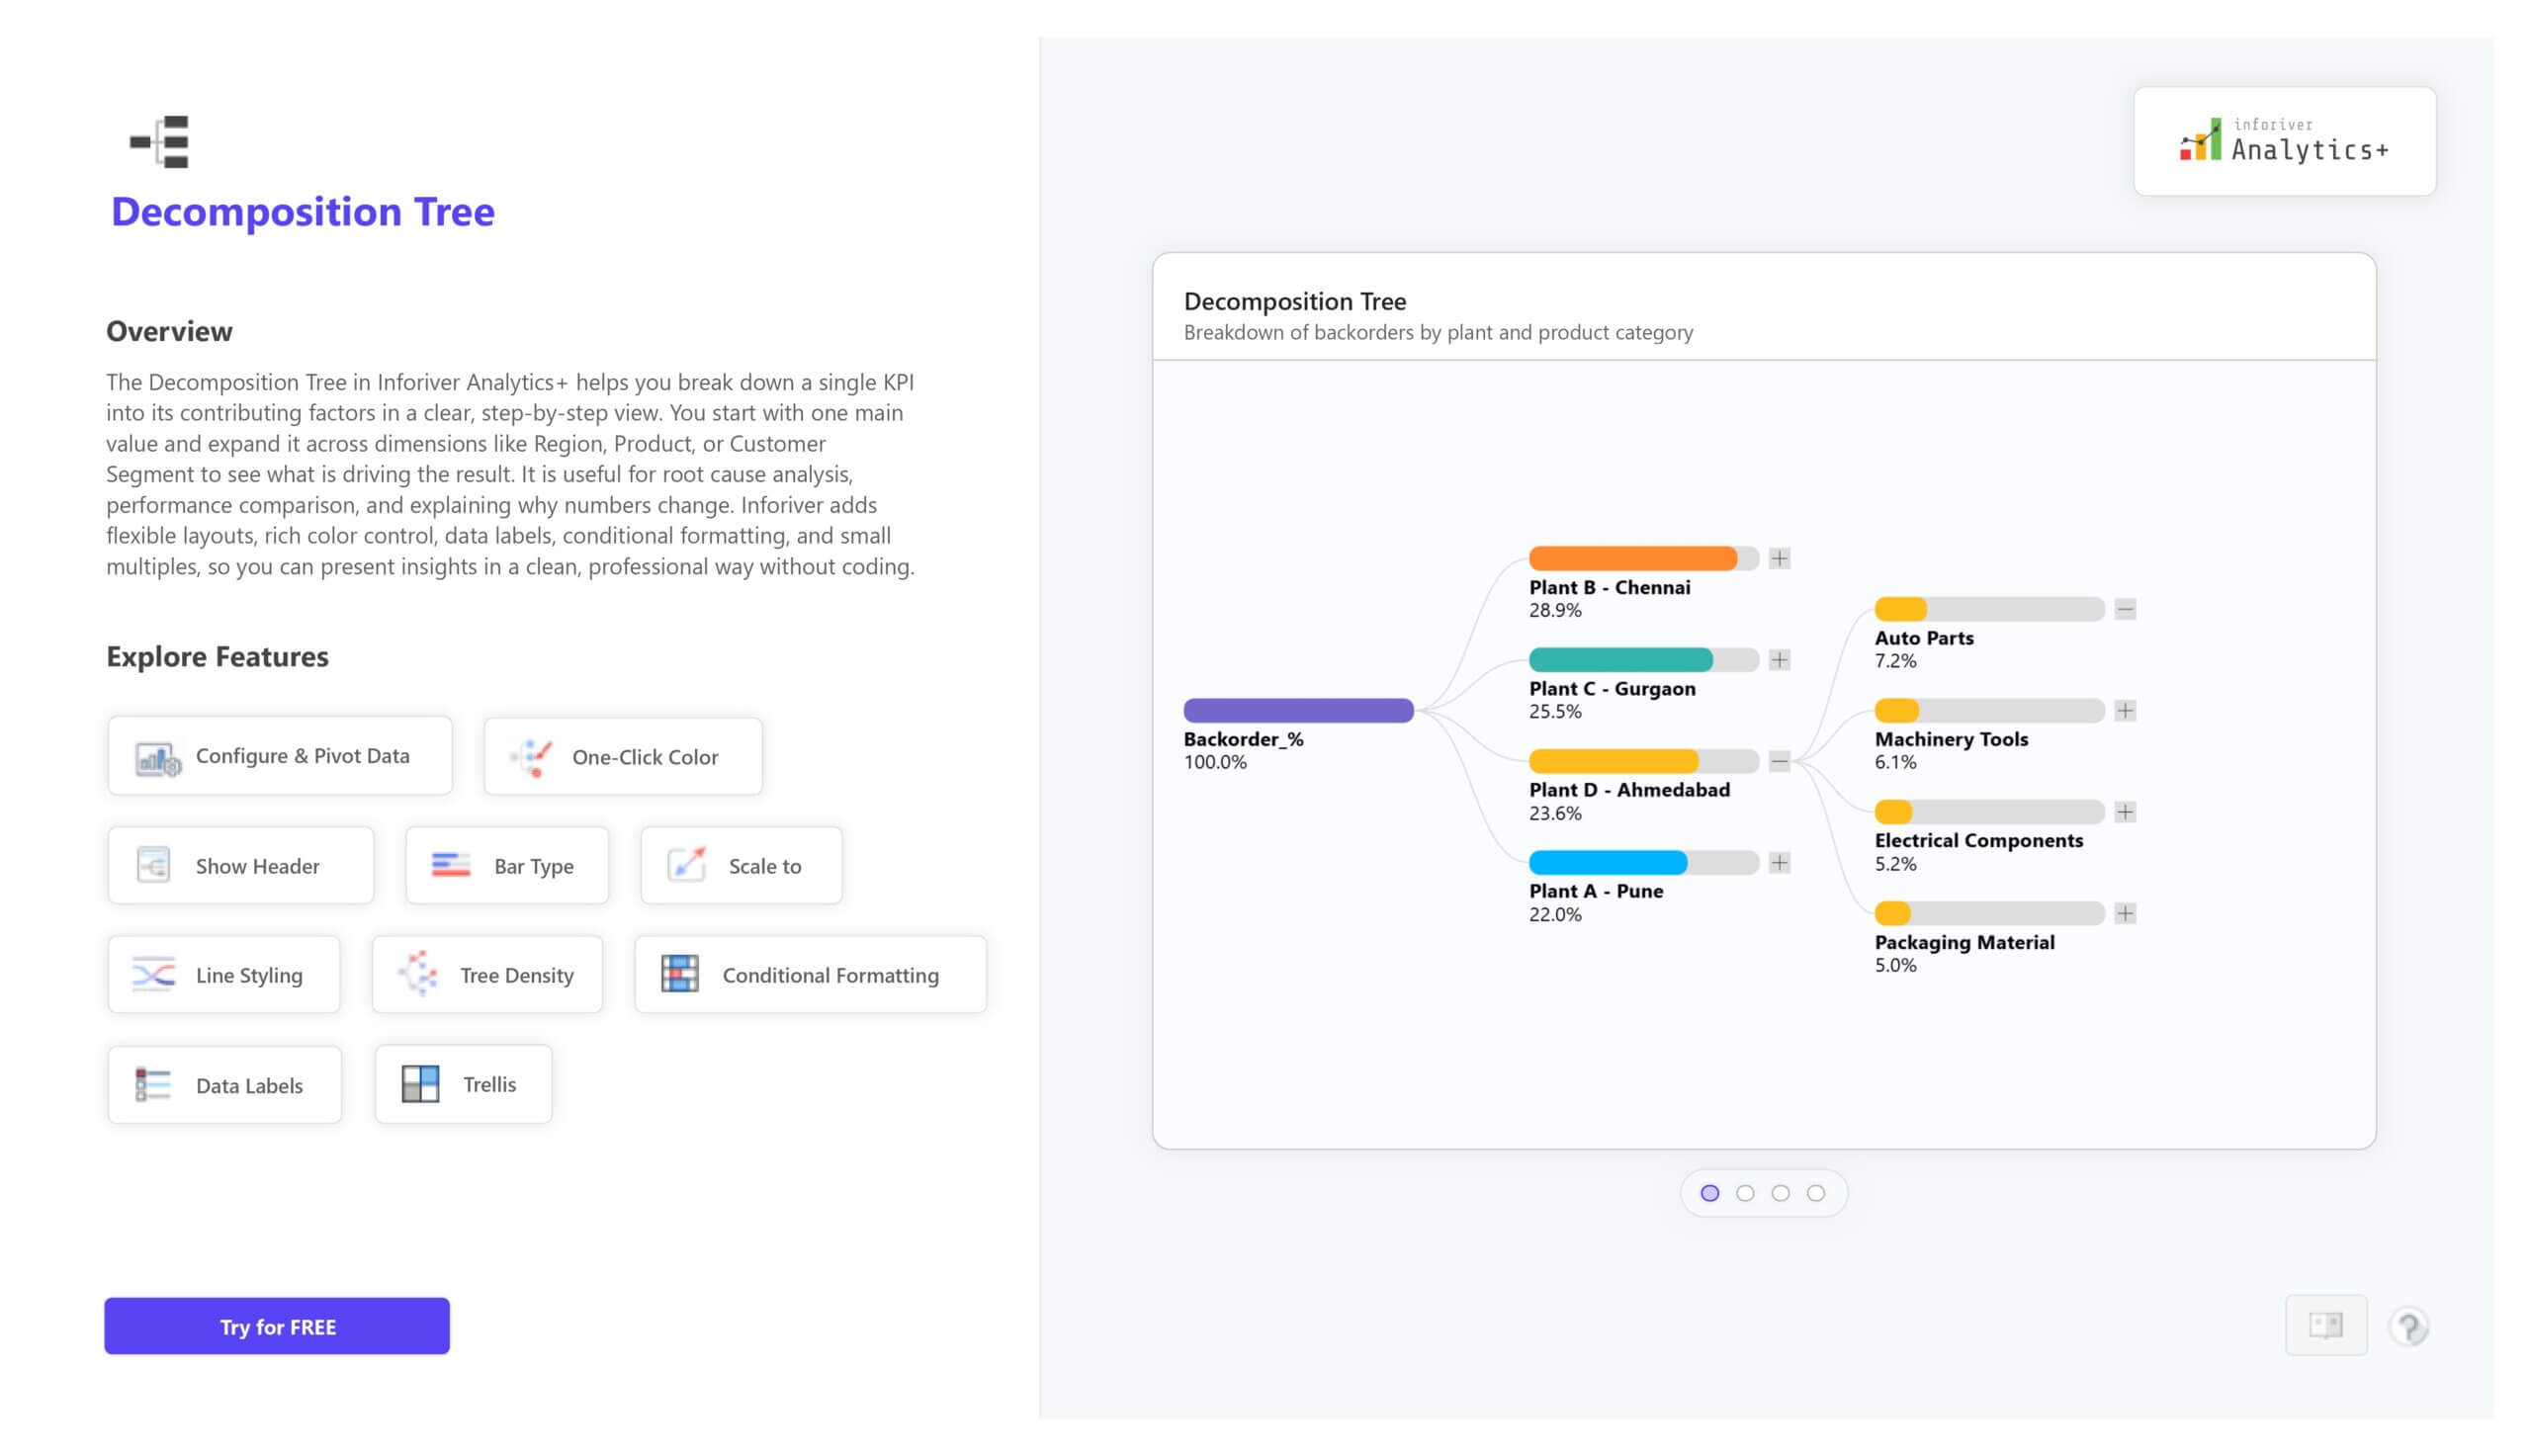
The Decomposition Tree in Inforiver Analytics+ is a hierarchical visualization that helps you break down a single KPI into its key contributors. You start from one main value and expand it step by step across dimensions such as Region, Product, Customer Segment, or Time to understand what is driving performance. It is highly effective for root cause analysis, variance analysis, and KPI explanation in business reporting.
This chart is part of the Inforiver Hierarchical Chart family and goes beyond the native Power BI decomposition tree. You get powerful capabilities such as pivot-based configuration, one-click color formatting, custom line styling, scale options, flexible tree density, advanced conditional formatting, rich data labels, and Trellis or small multiples for side-by-side comparison of multiple trees. This helps you analyze data deeply and communicate insights clearly in a professional Power BI report without coding.
For complete features, live demo visuals, and pricing details, visit:
https://inforiver.com/analytics-plus/hierarchy/
to try advance features
[demo_download_modal title="Decomposition Tree in Power BI" link="https://inforiver.com/wp-content/uploads/decomposition-tree-in-analyticsplus-demo.zip"]
Inforiver helps enterprises consolidate planning, reporting & analytics on a single platform (Power BI). The no-code, self-service award-winning platform has been recognized as the industry’s best and is adopted by many Fortune 100 firms.
Inforiver is a product of Lumel, the #1 Power BI AppSource Partner. The firm serves over 3,000 customers worldwide through its portfolio of products offered under the brands Inforiver, EDITable, ValQ, and xViz.


