Upcoming webinar on 'Inforiver Charts : The fastest way to deliver stories in Power BI', Aug 29th , Monday, 10.30 AM CST. Register Now
Upcoming webinar on 'Inforiver Charts : The fastest way to deliver stories in Power BI', Aug 29th , Monday, 10.30 AM CST. Register Now
Last month we released our flagship version 3.0, with a new small multiple/trellis architecture and no-code framework with which every chart type can be turned into a new modern ‘Visual Pivot Table’.
The October update of Inforiver Analytics+ (version 3.1) further enhances the capabilities offered and comes packaged with core enhancements across UI/UX, chart customizations, Trellis, Top N, and various other features to style and elevate your reports.
We have more exciting things coming soon with Inforiver Analytics+ and you can read about them in our vision and roadmap.
Feel welcome to explore the sections that interest you!
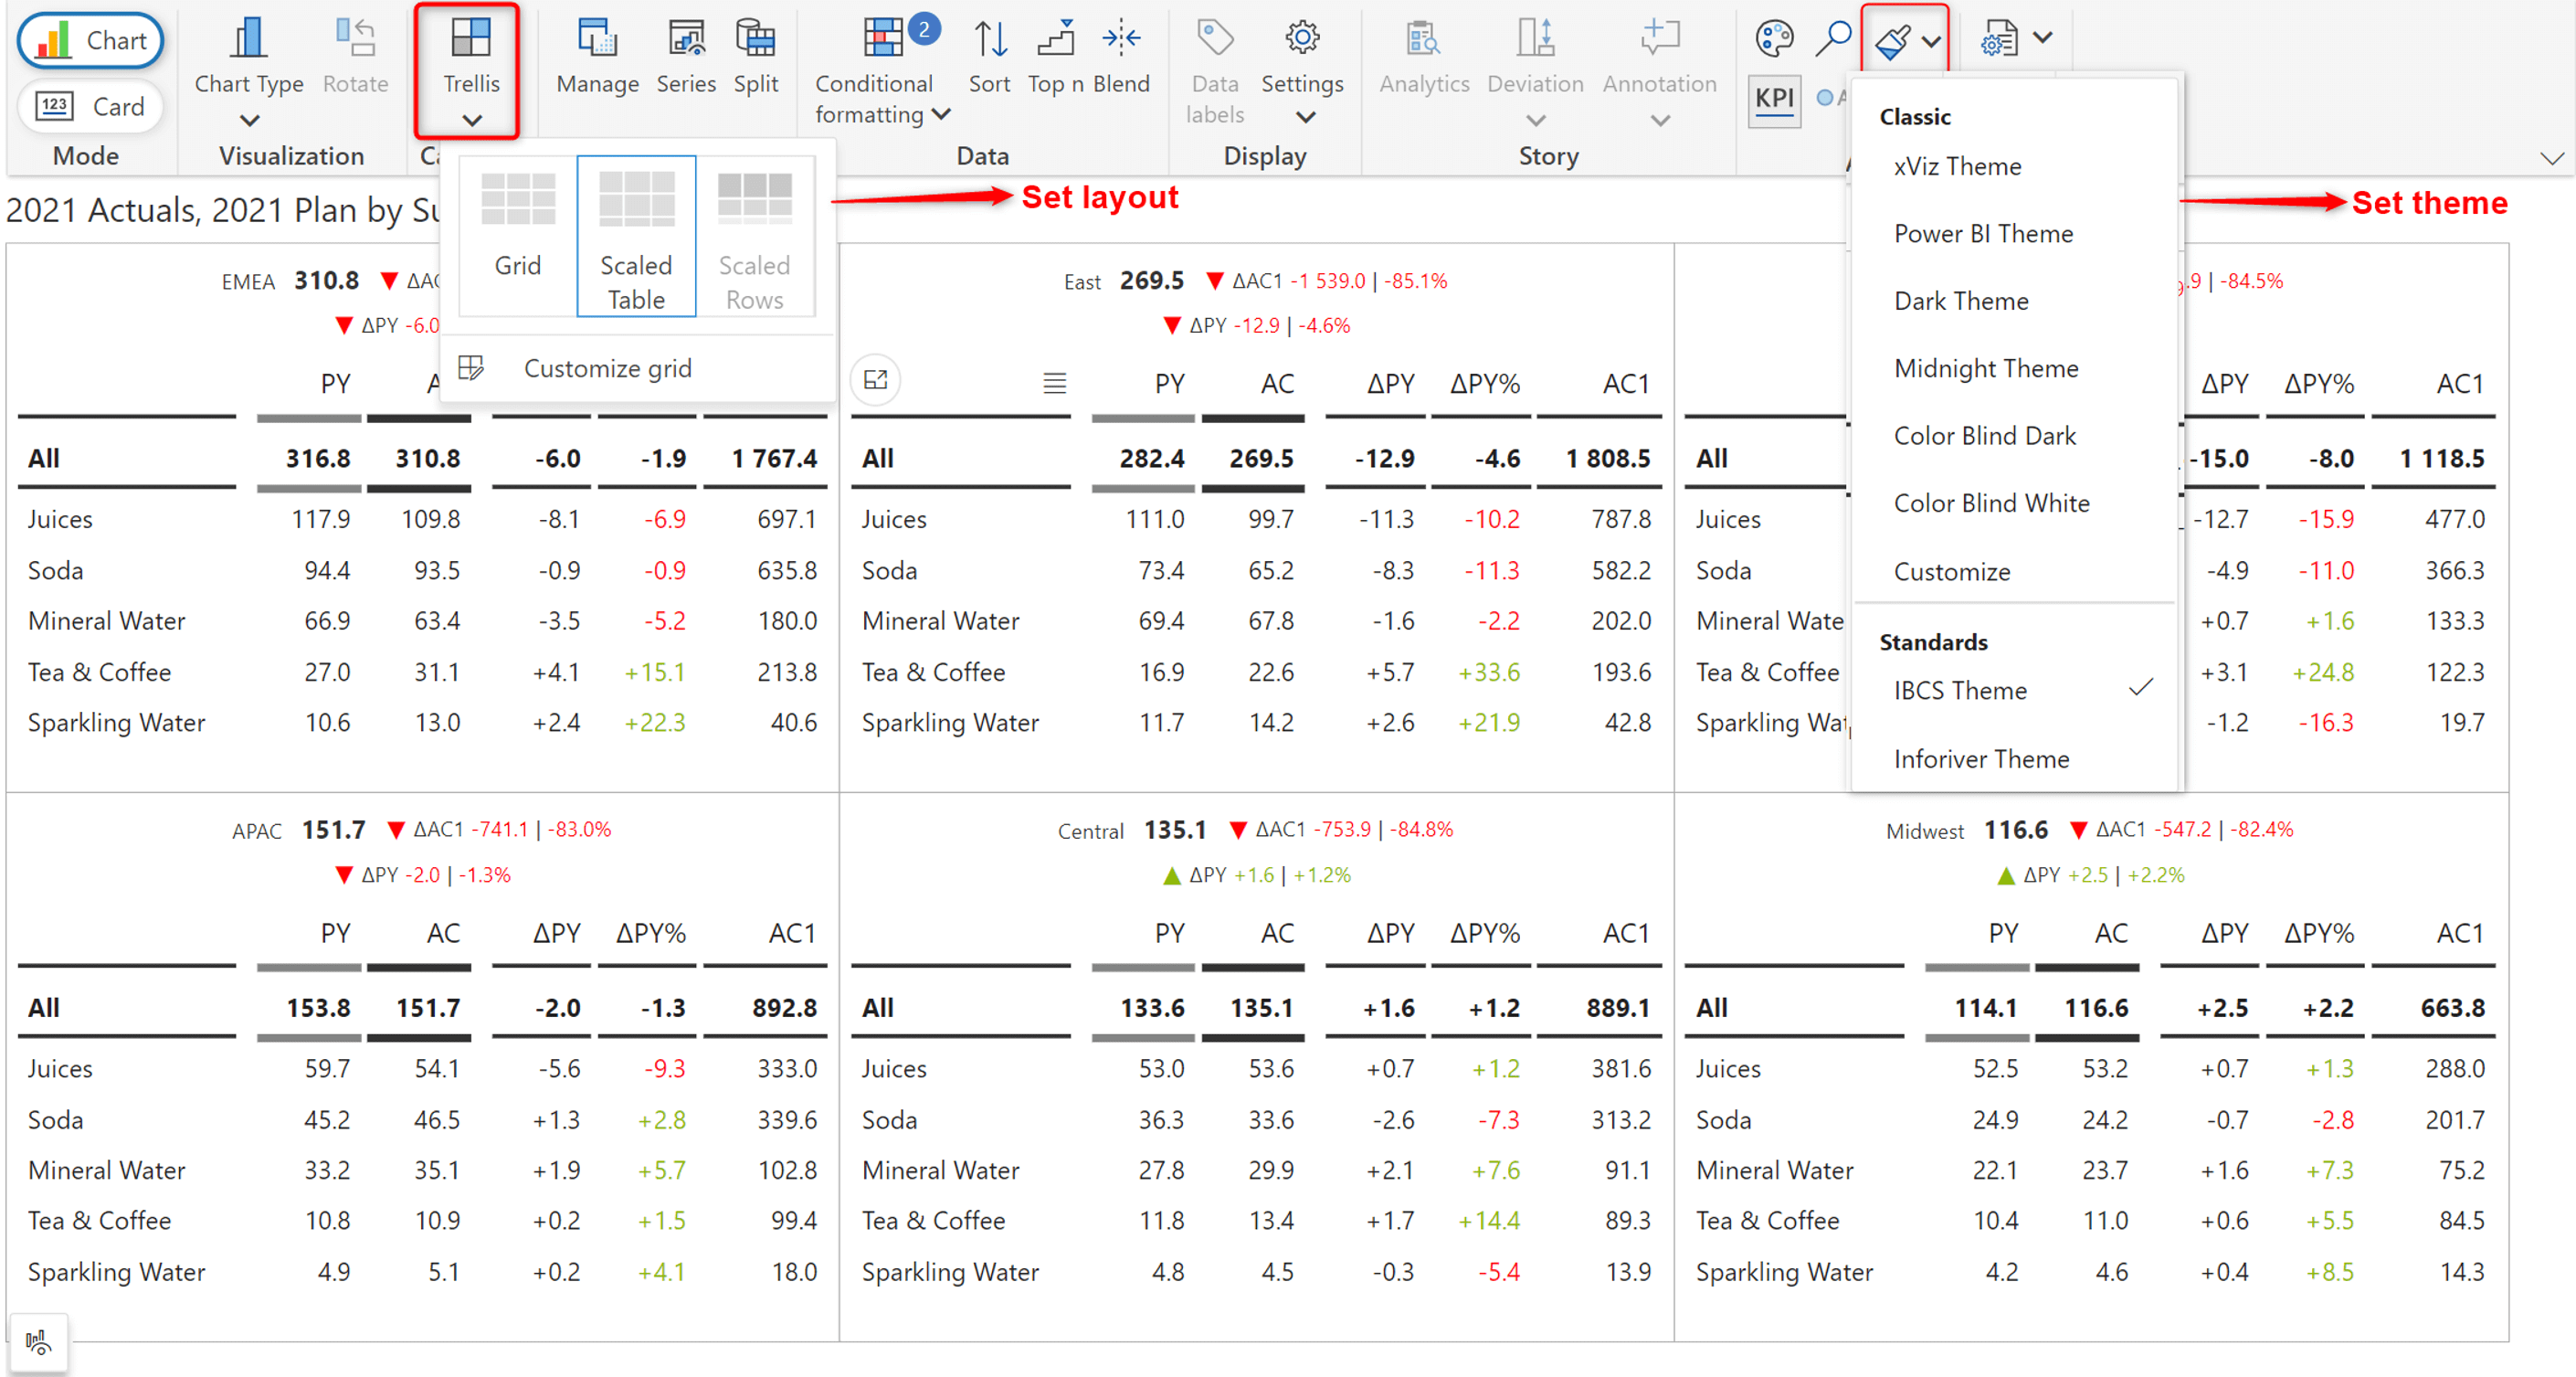
Introducing the data table – Inforiver Chart’s unique offering that gives you a multi-dimensional, tabular representation of your data in just a few clicks. This feature comes packaged with various settings and customizations that are specific to the data table. E.g., You can adjust the look and feel by choosing from an array of themes; you can set layouts such as grid or scaled table based on your data; you can even opt for synced scrolling for panels to quickly compare your fields across dimensions.
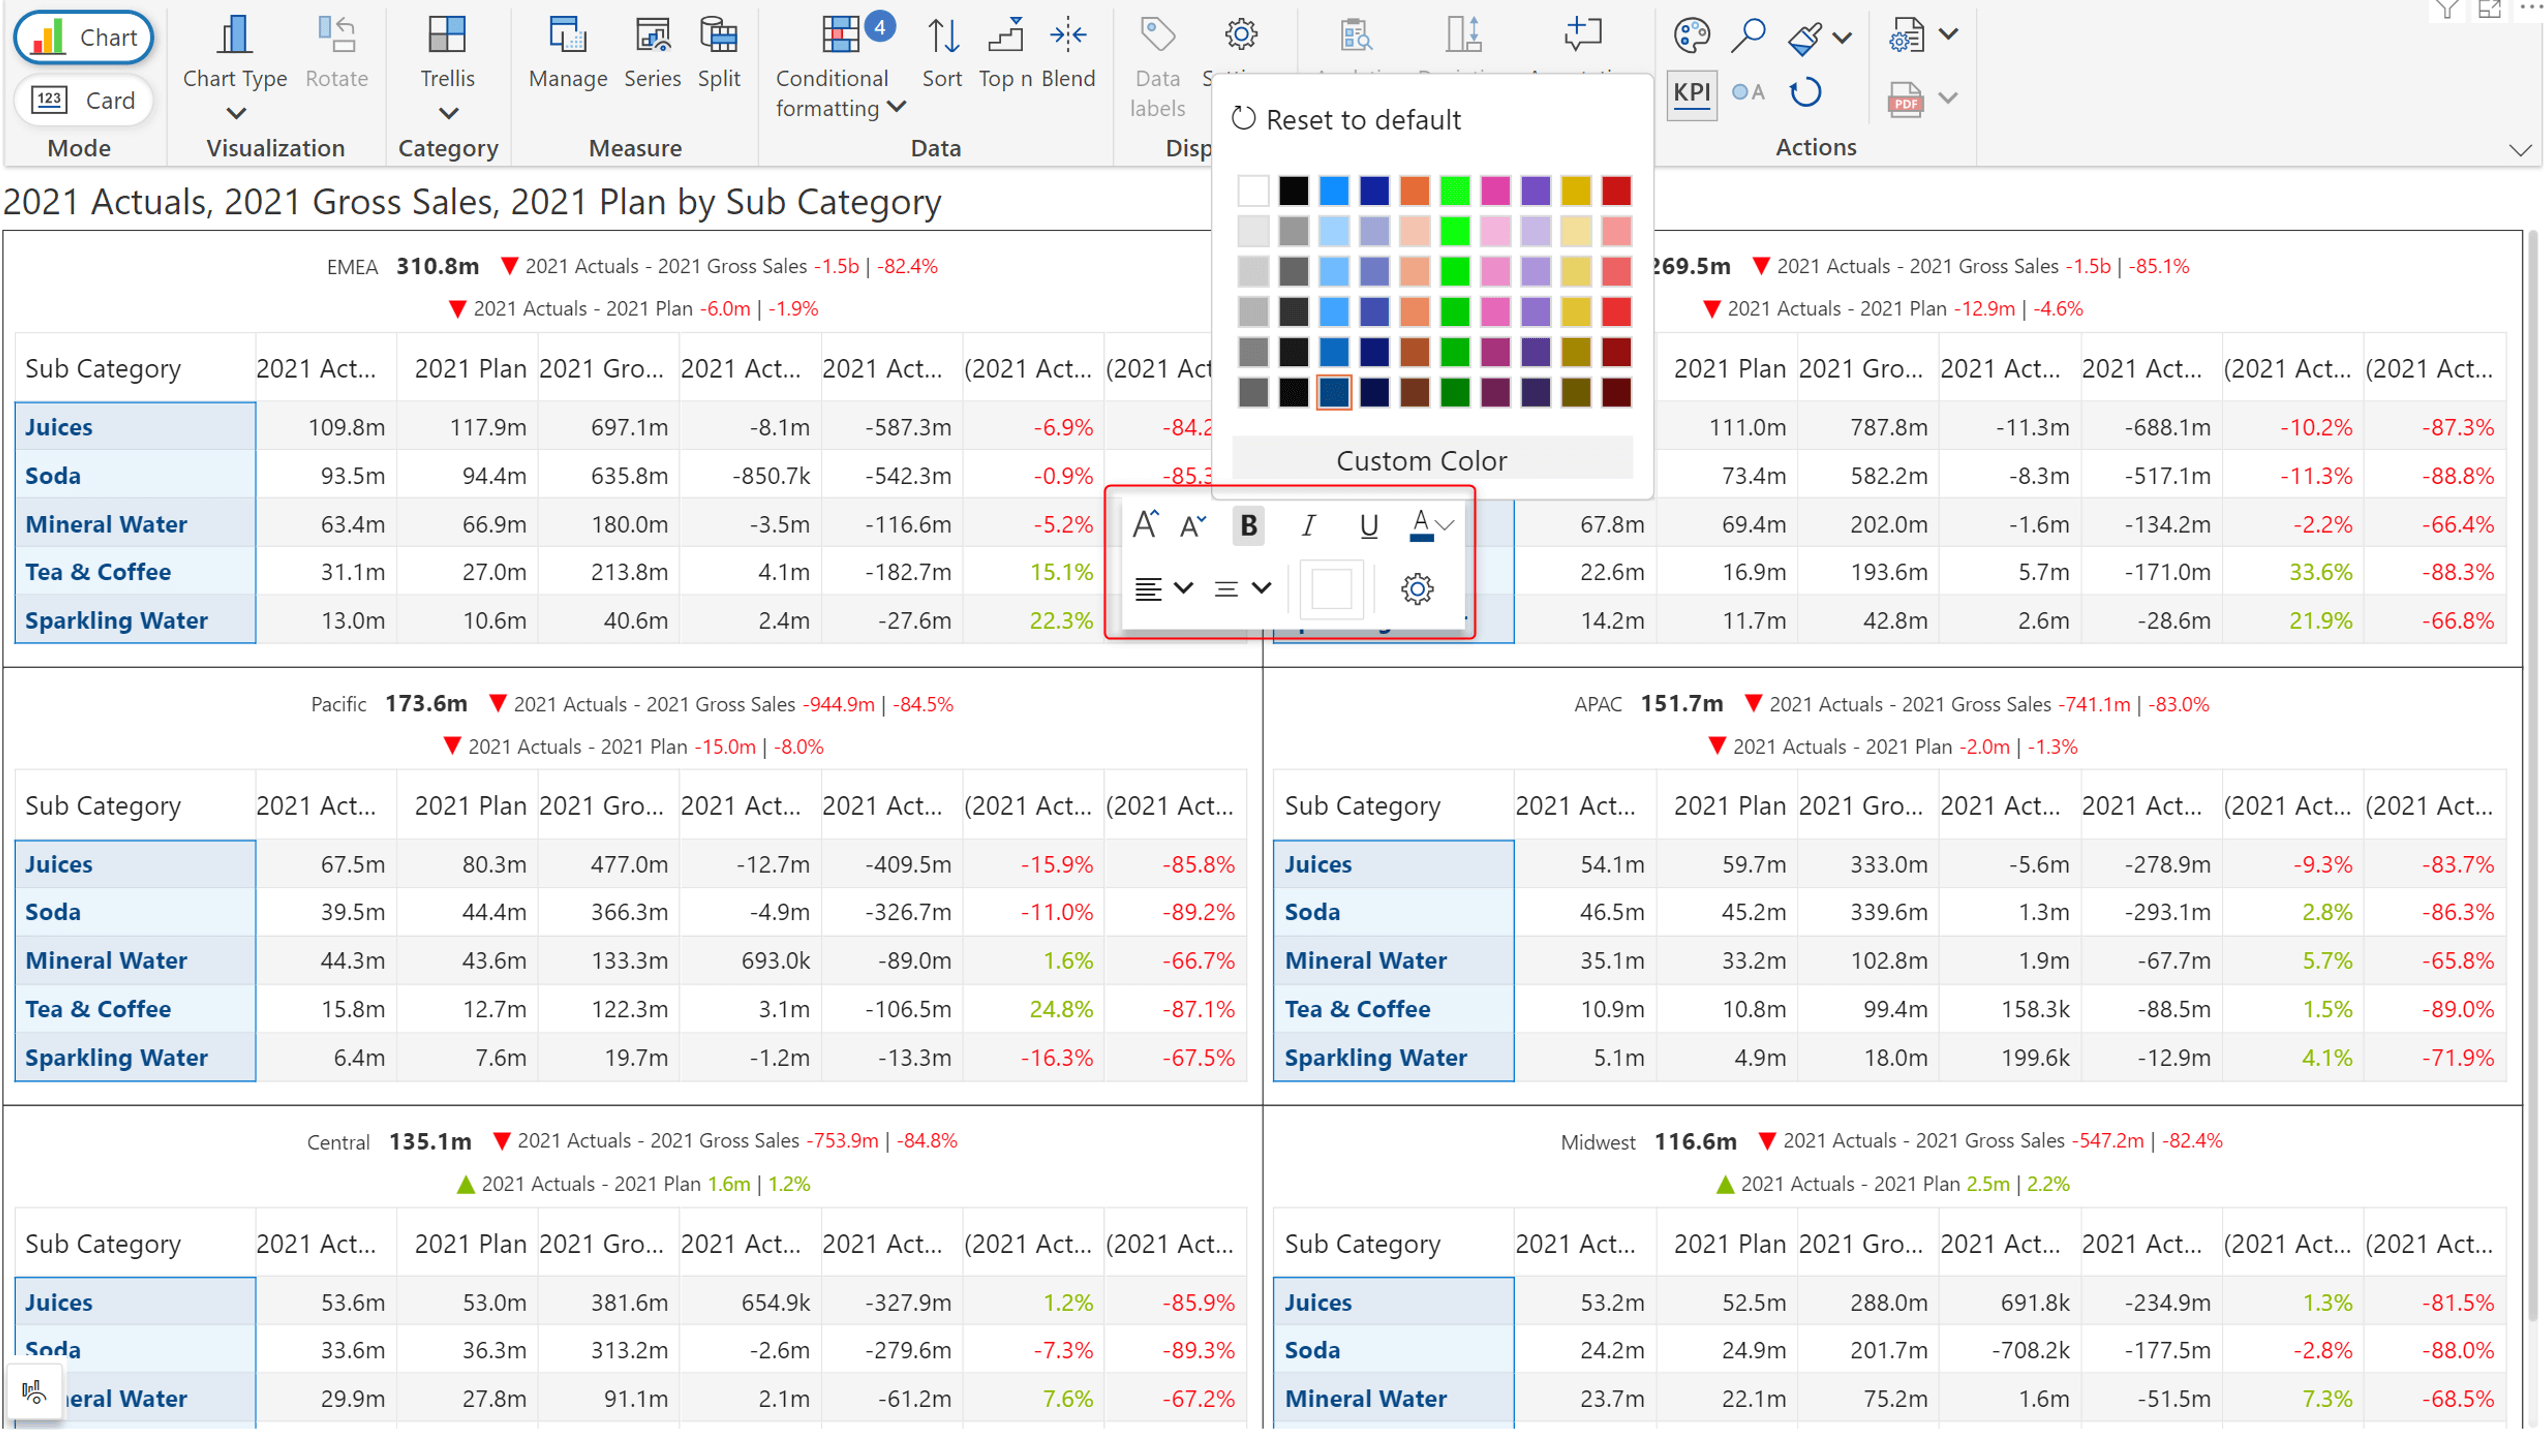
You can easily customize the data table using the on-object interaction menu. Simply click on an element to access the customization options.
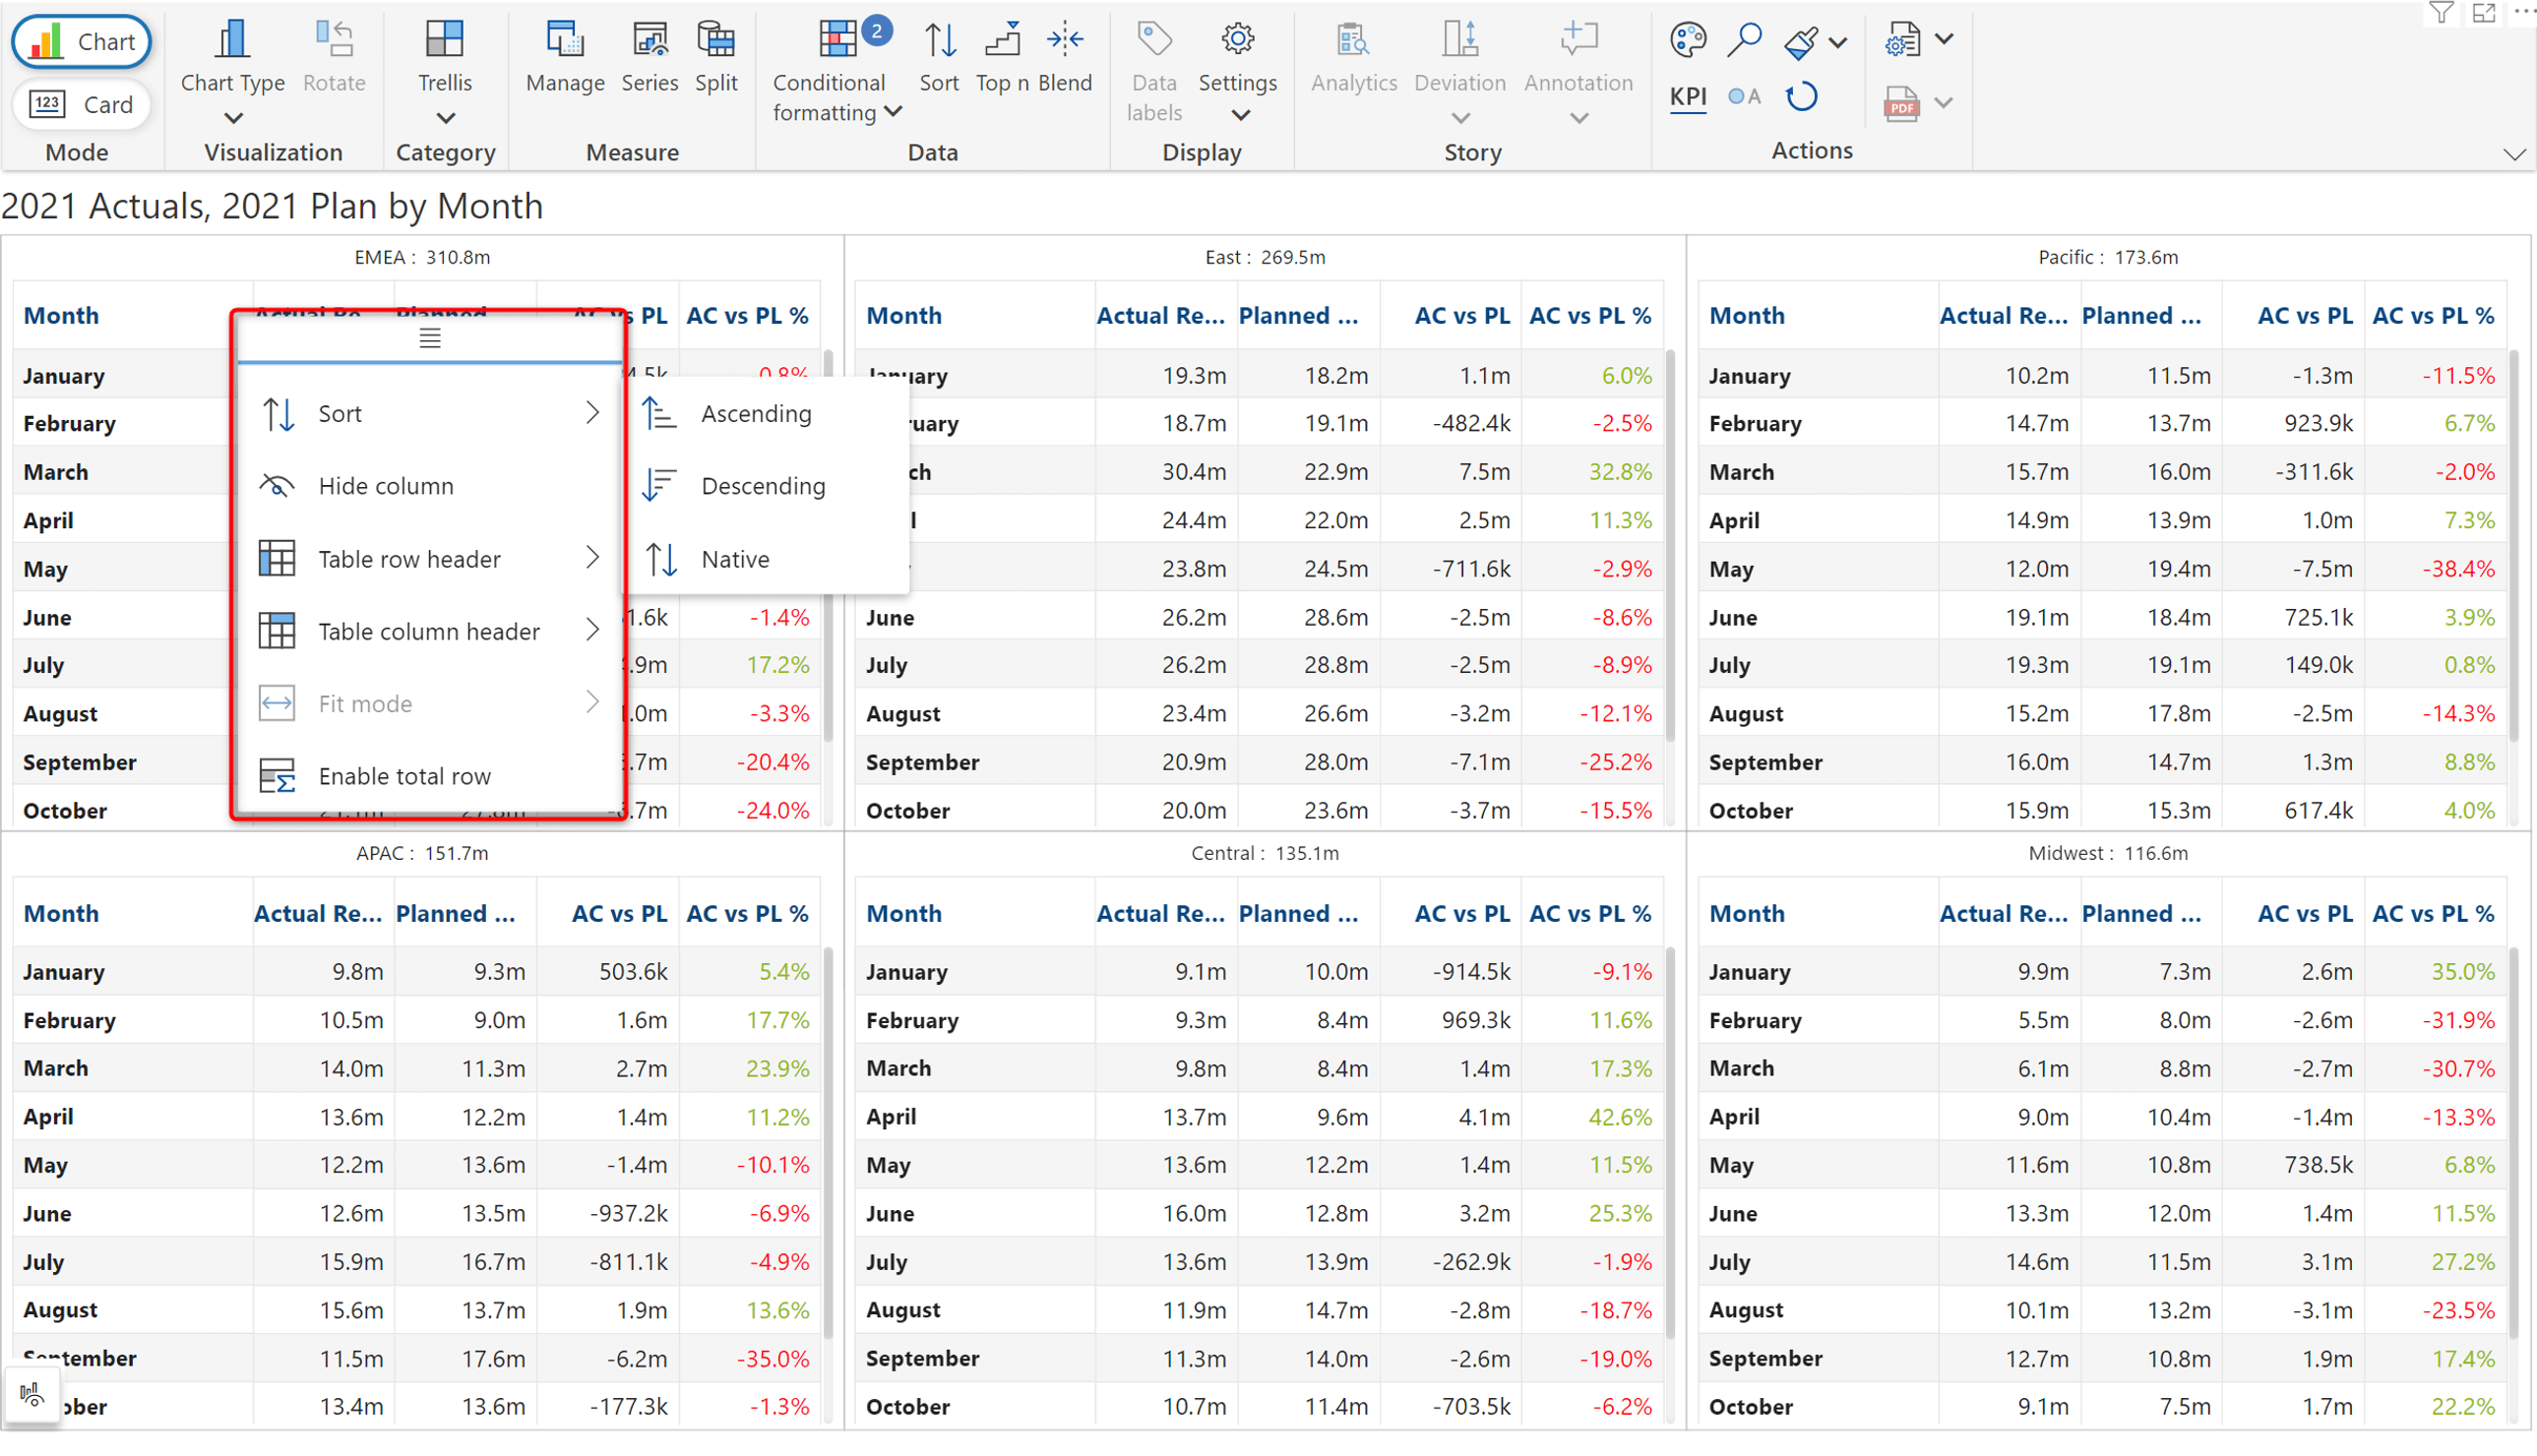
You can also use the column gripper to conveniently access options like sorting, header customizations, disable total row etc.
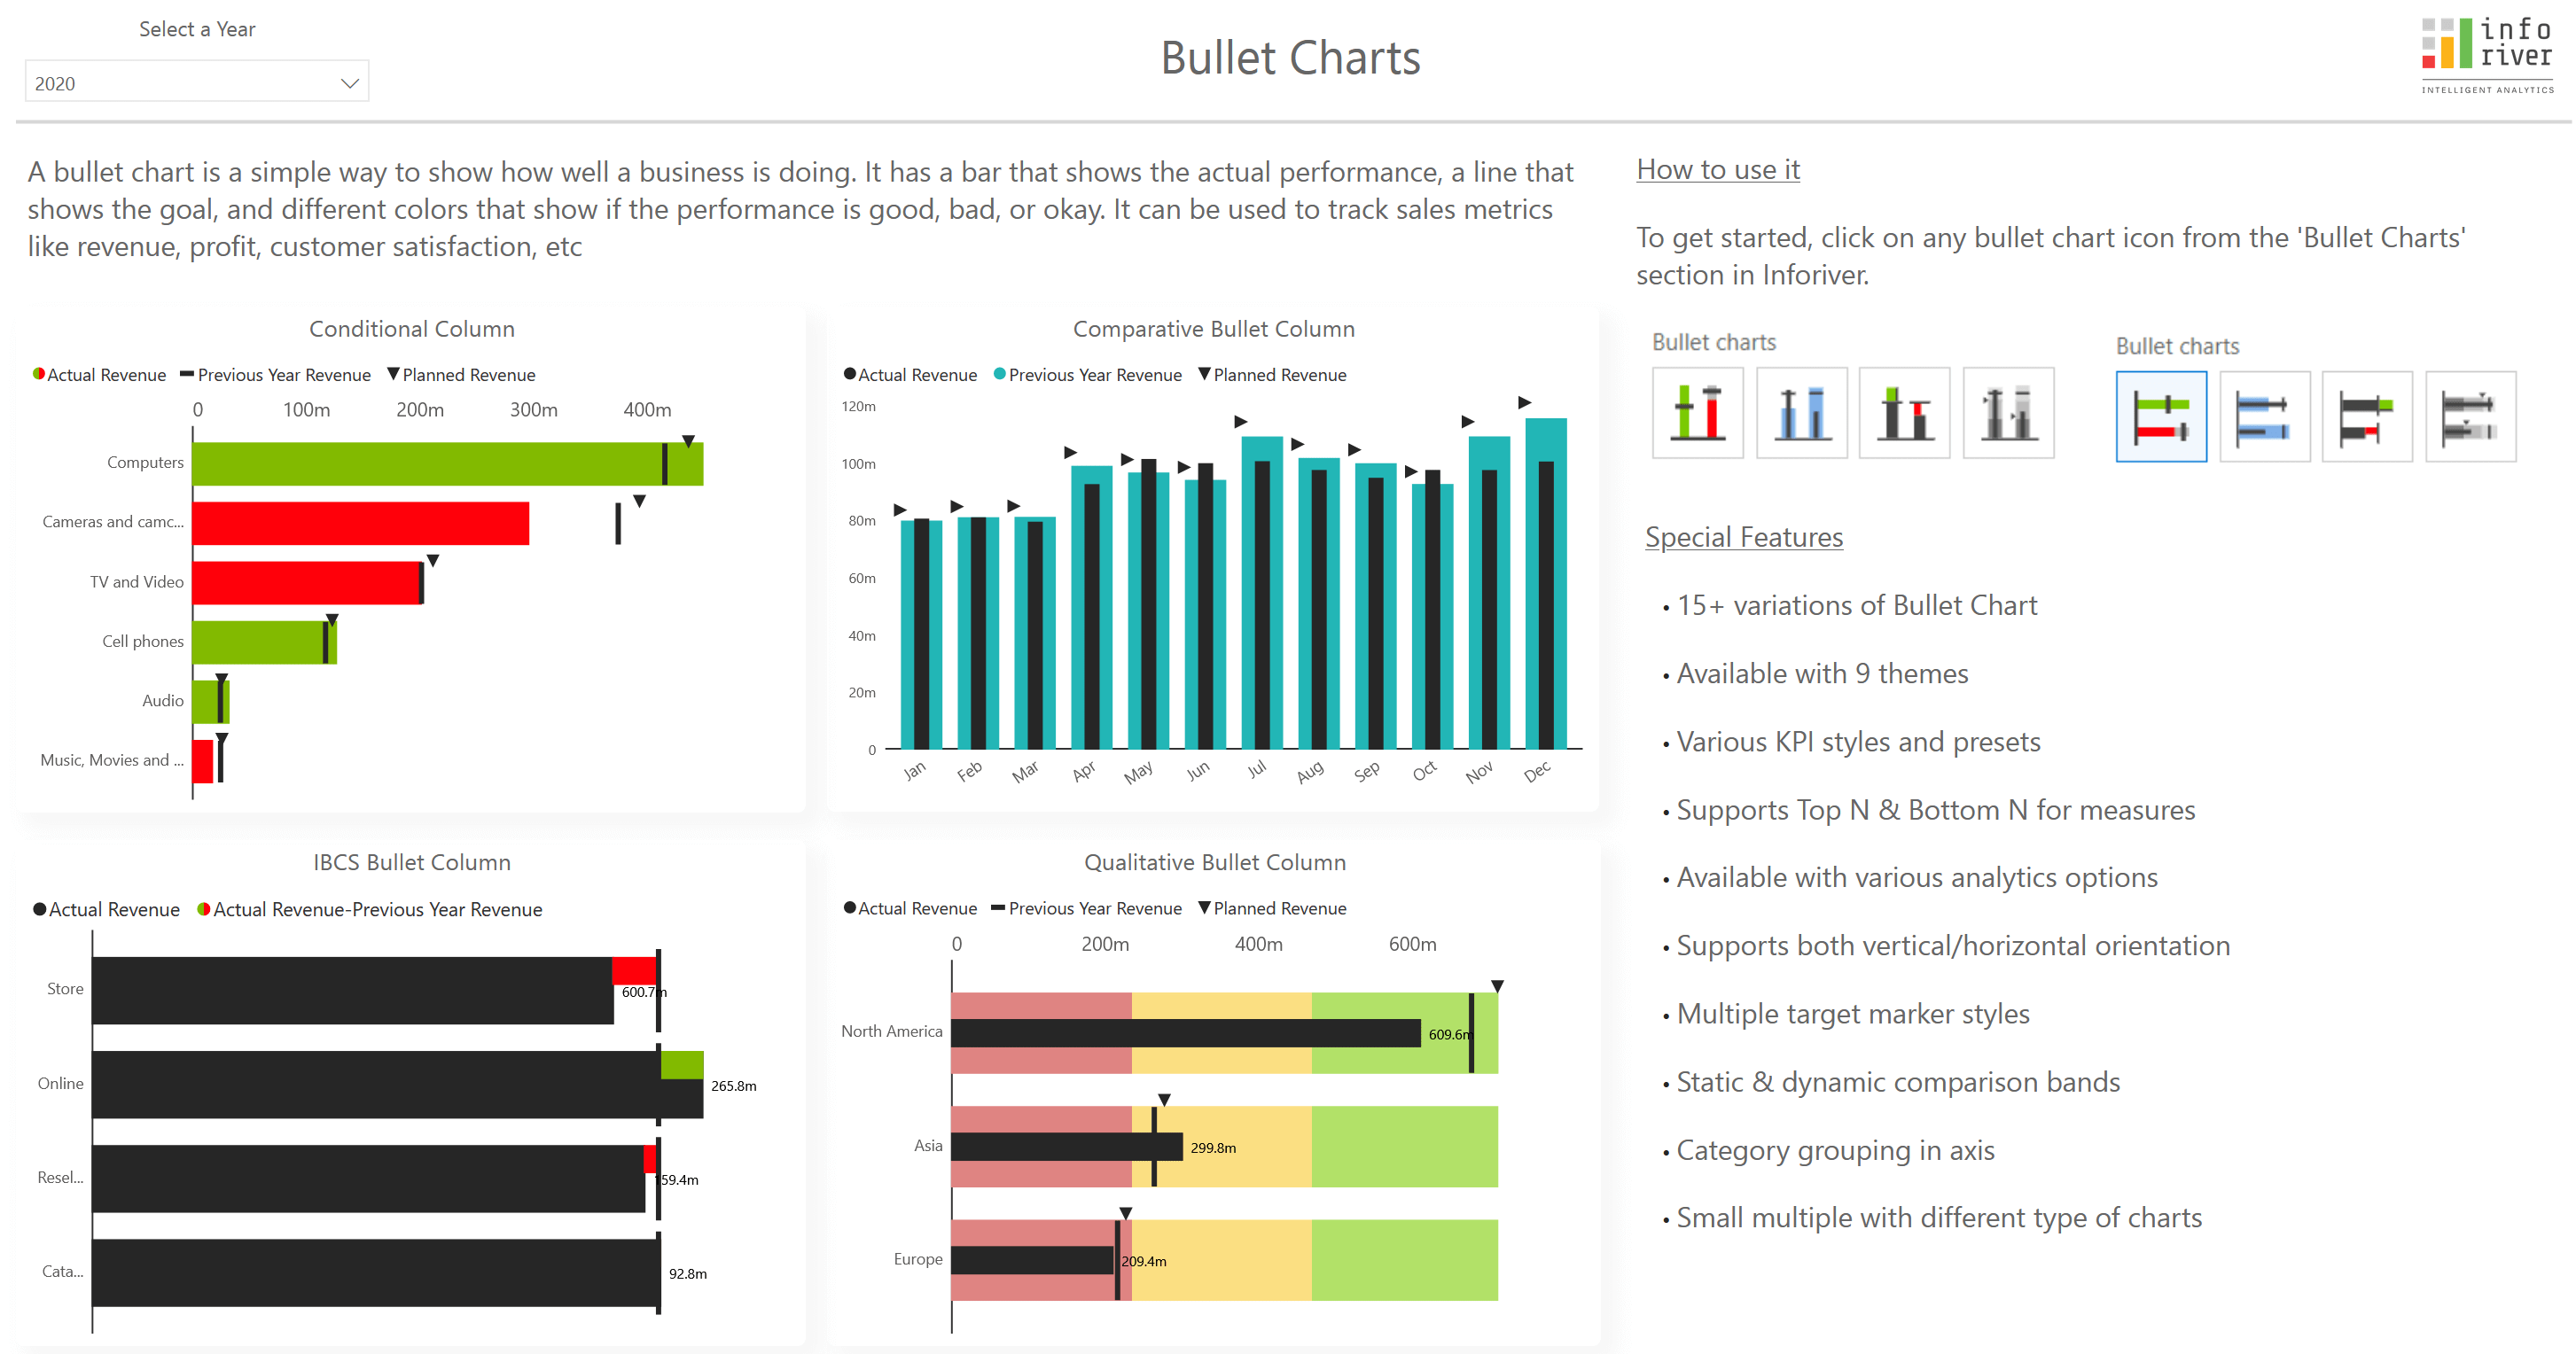
The 3.1. release offers 3 new types of bullet charts, giving you a variety of options to efficiently compare your measures against targets. The new charts include
You can leverage the newly added win-loss chart to gauge performance at a glance.
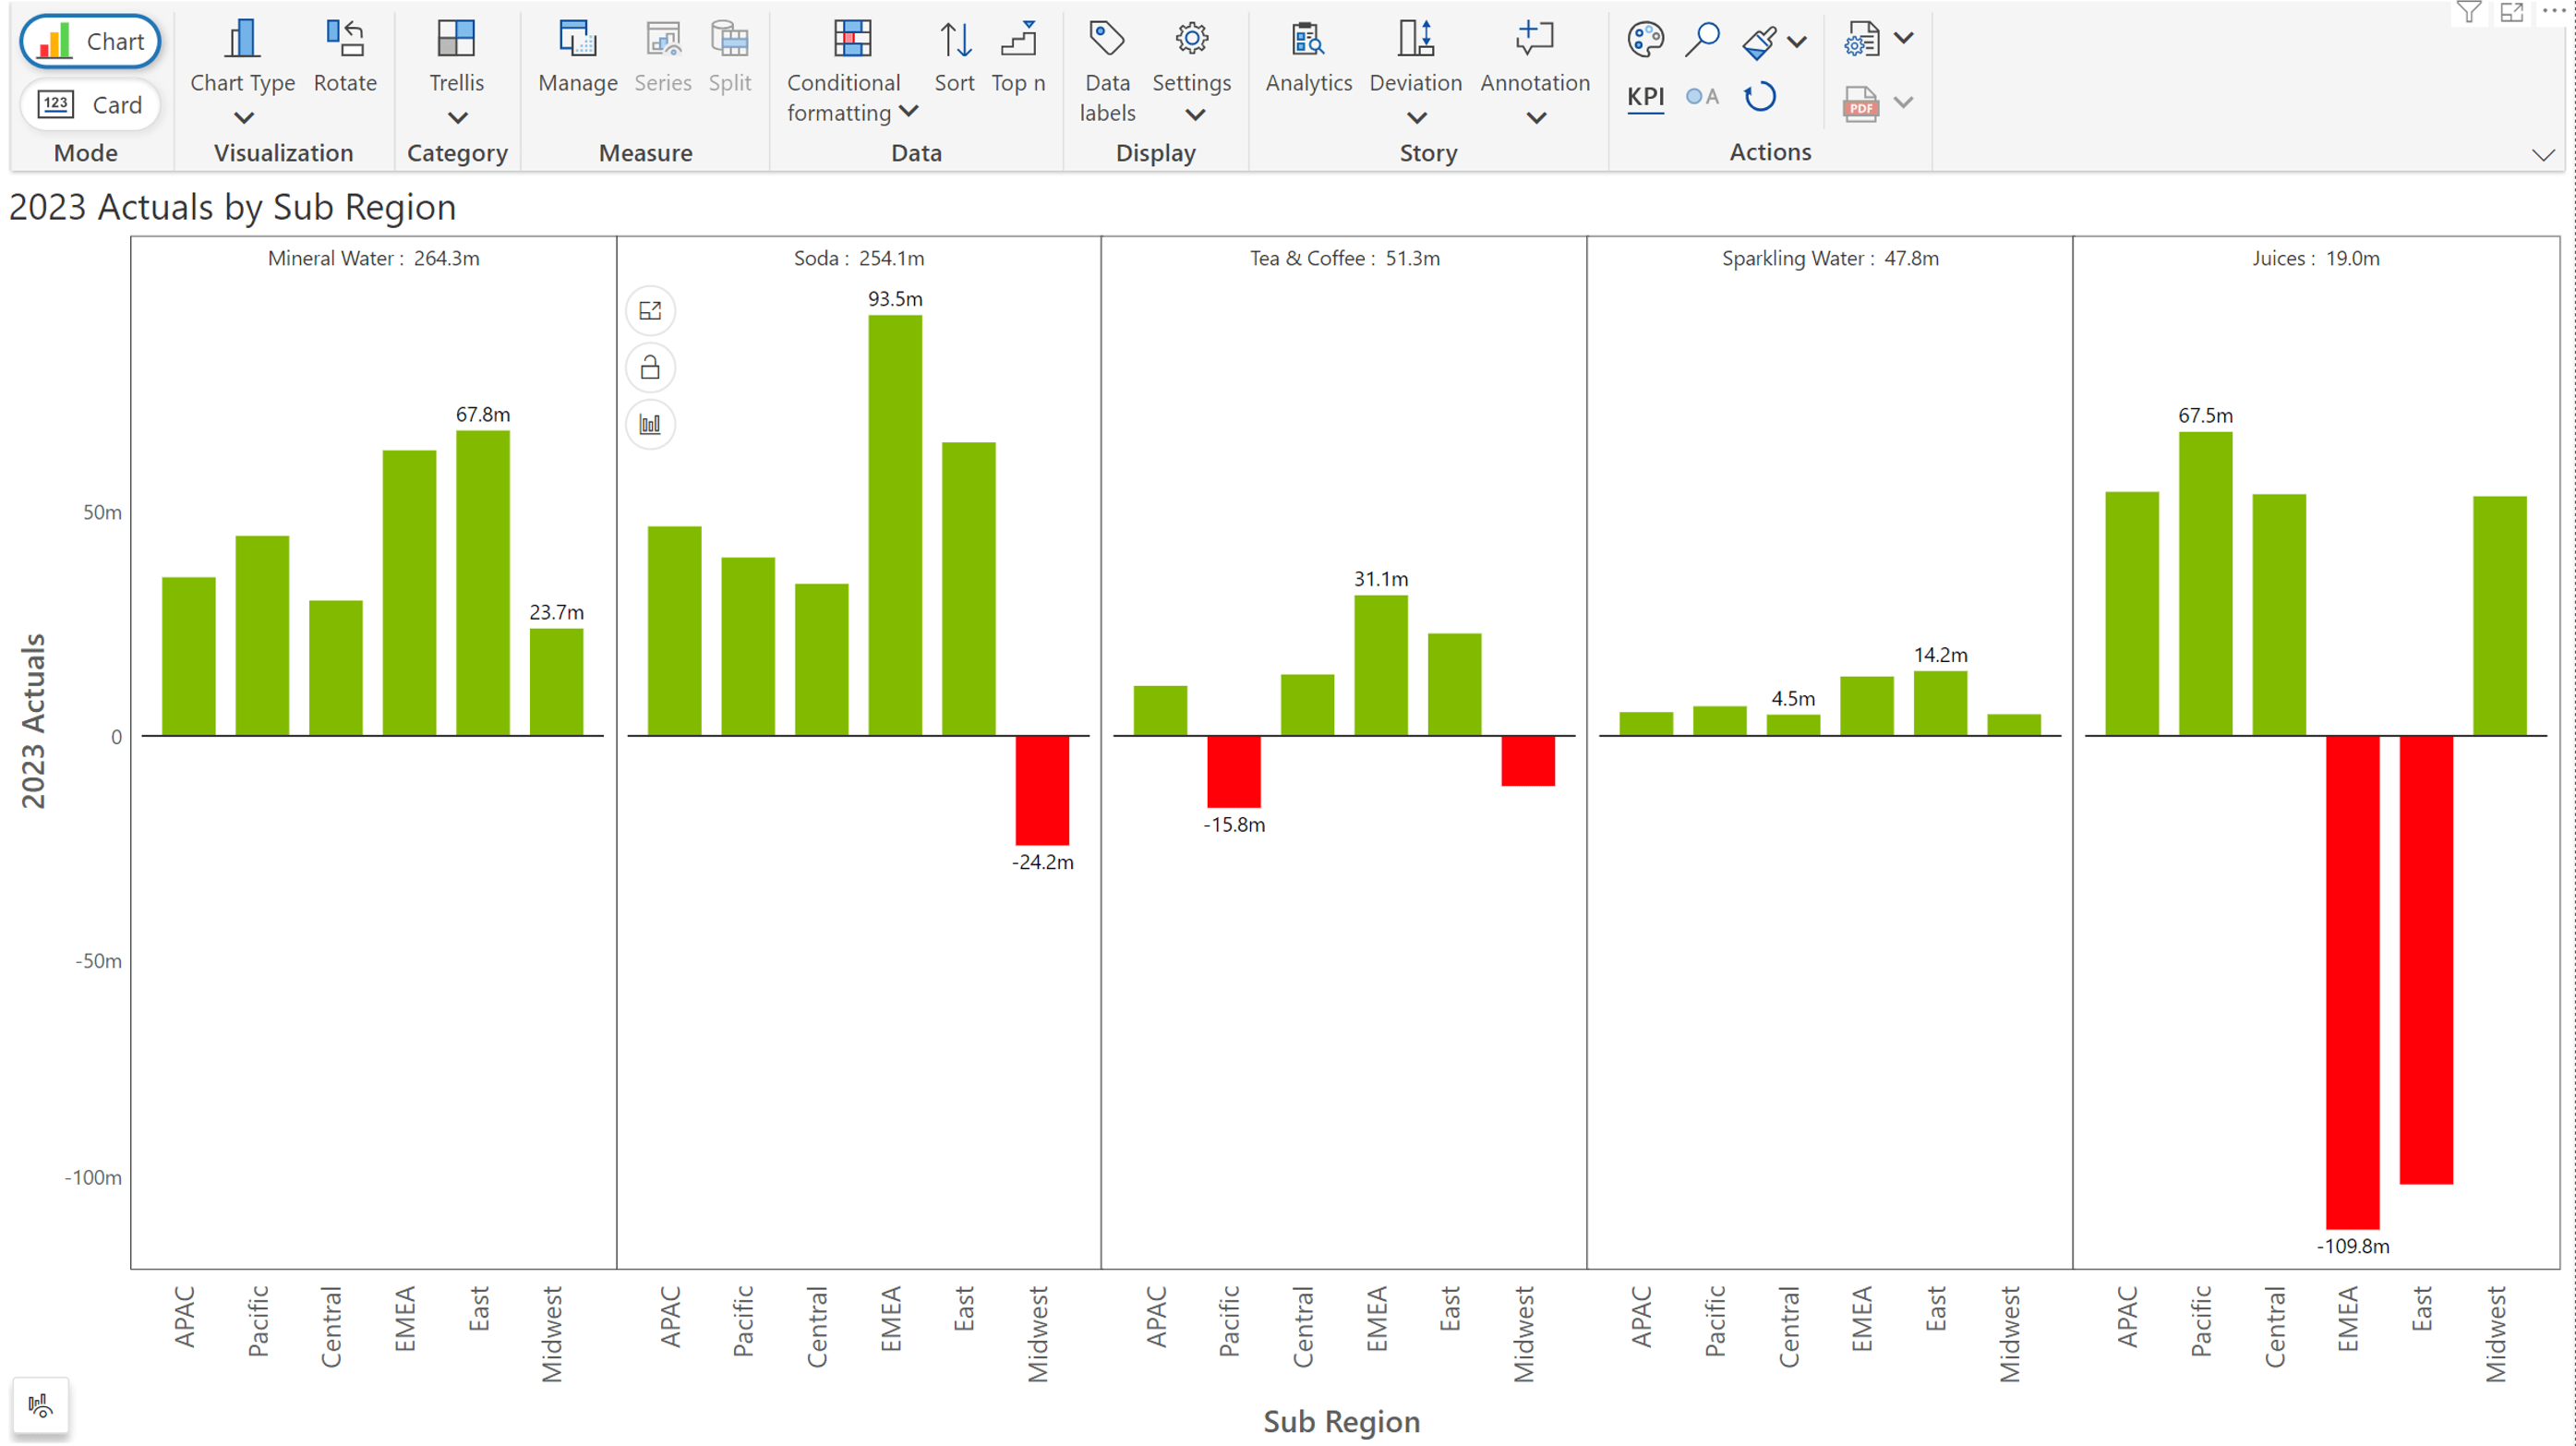
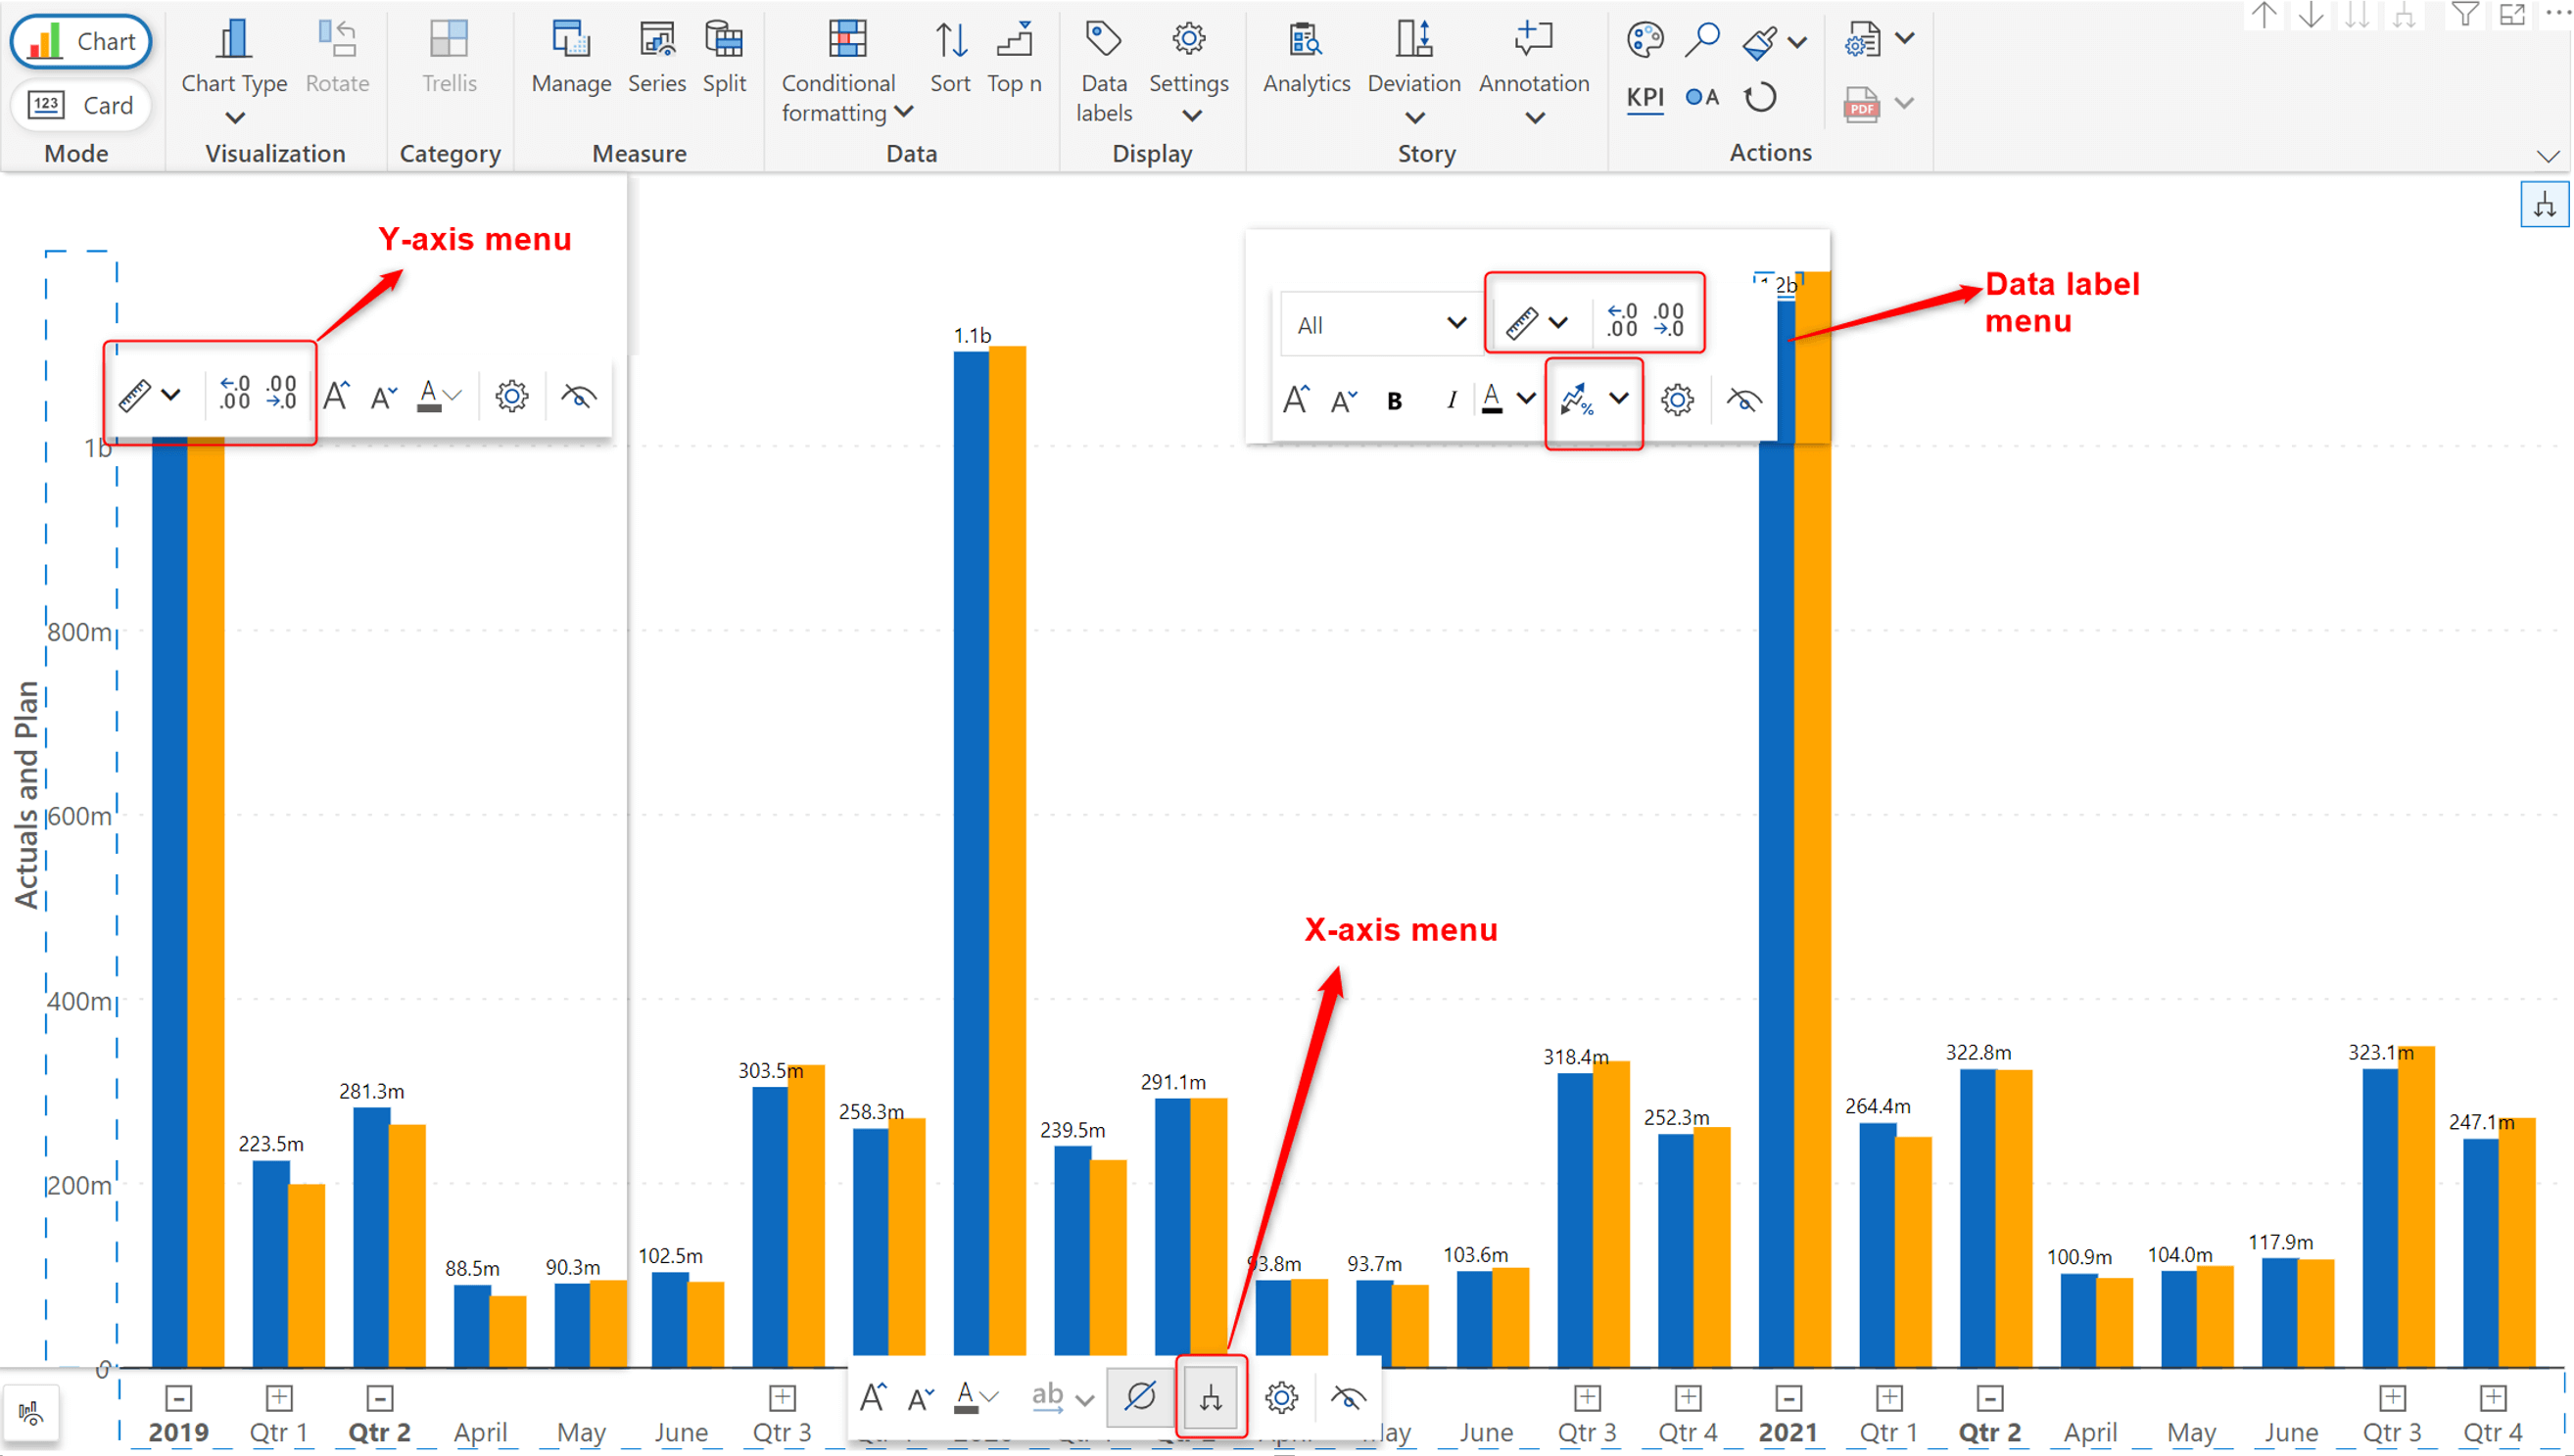
The on-object interaction menus provide customizations at your fingertips – offering shortcuts to an array of settings. You can simply click on an object to quickly apply various customizations.
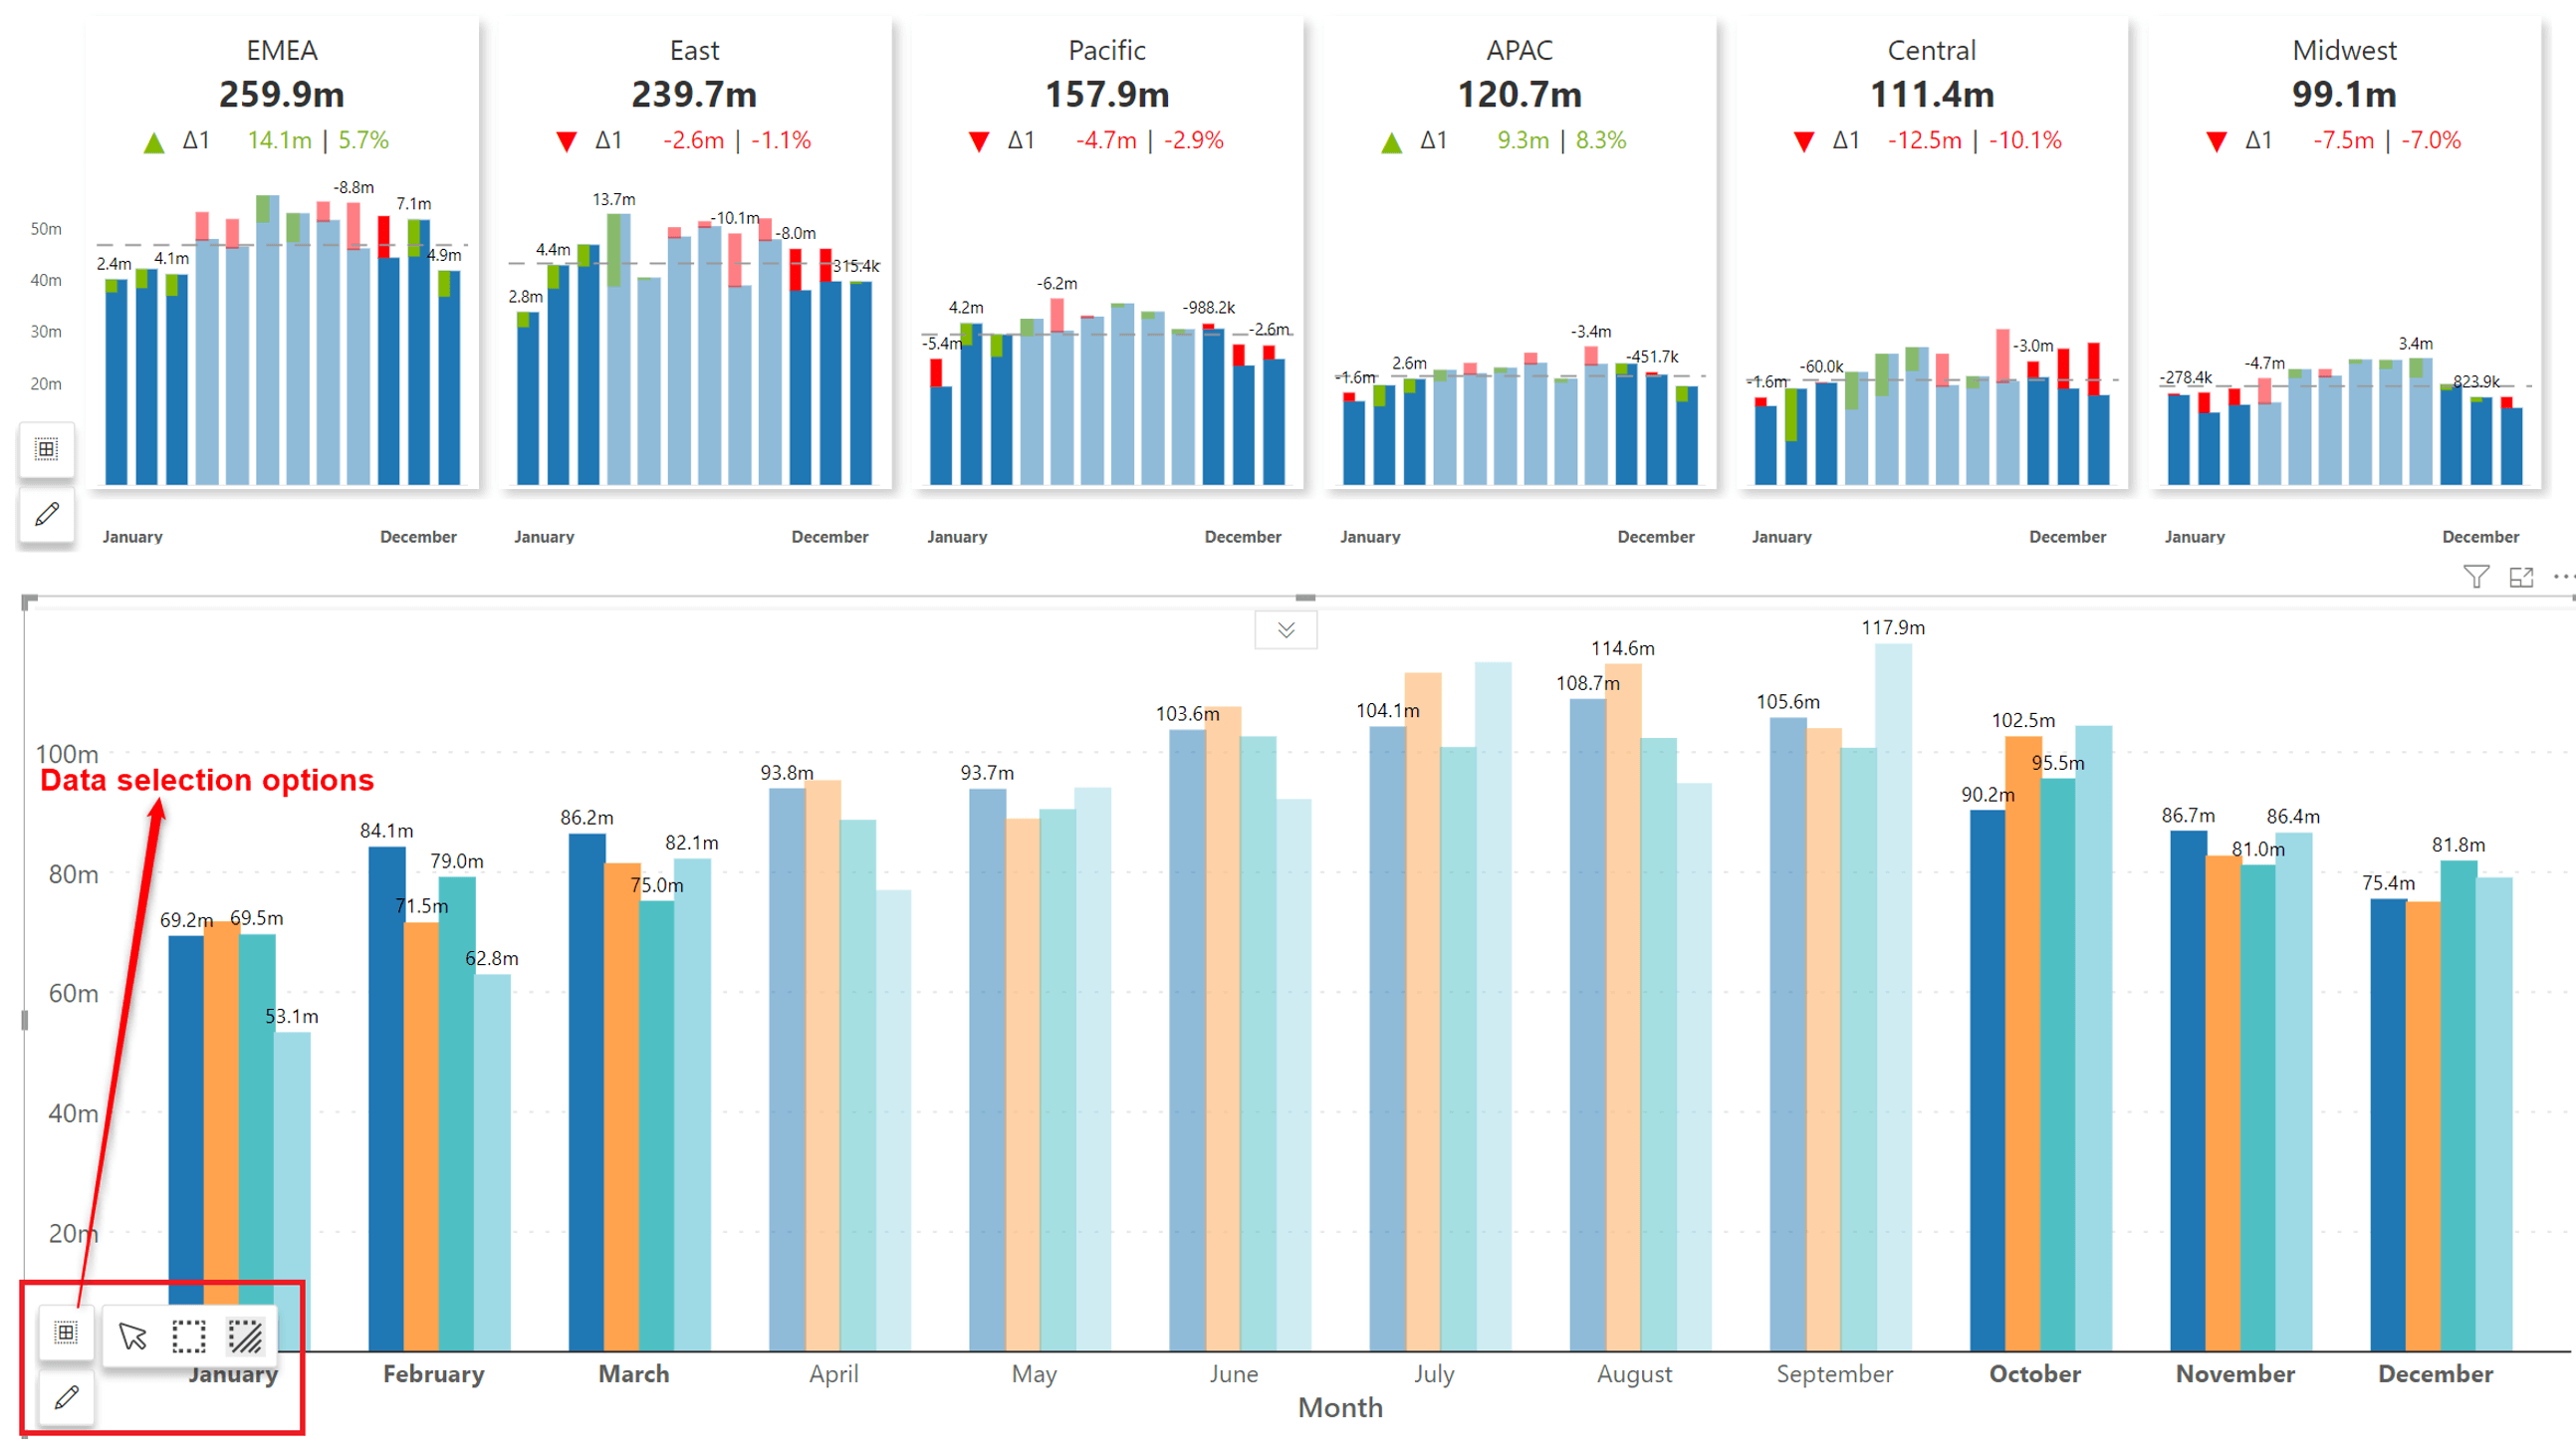
Inforiver Analytics+ 3.1. offers you new ways to emphasize specific data points:
The lasso and reverse lasso features can also be used to interact with other visuals. To demonstrate this, we have applied a reverse lasso selection in the chart, which has dynamically been applied to the KPI cards as well.
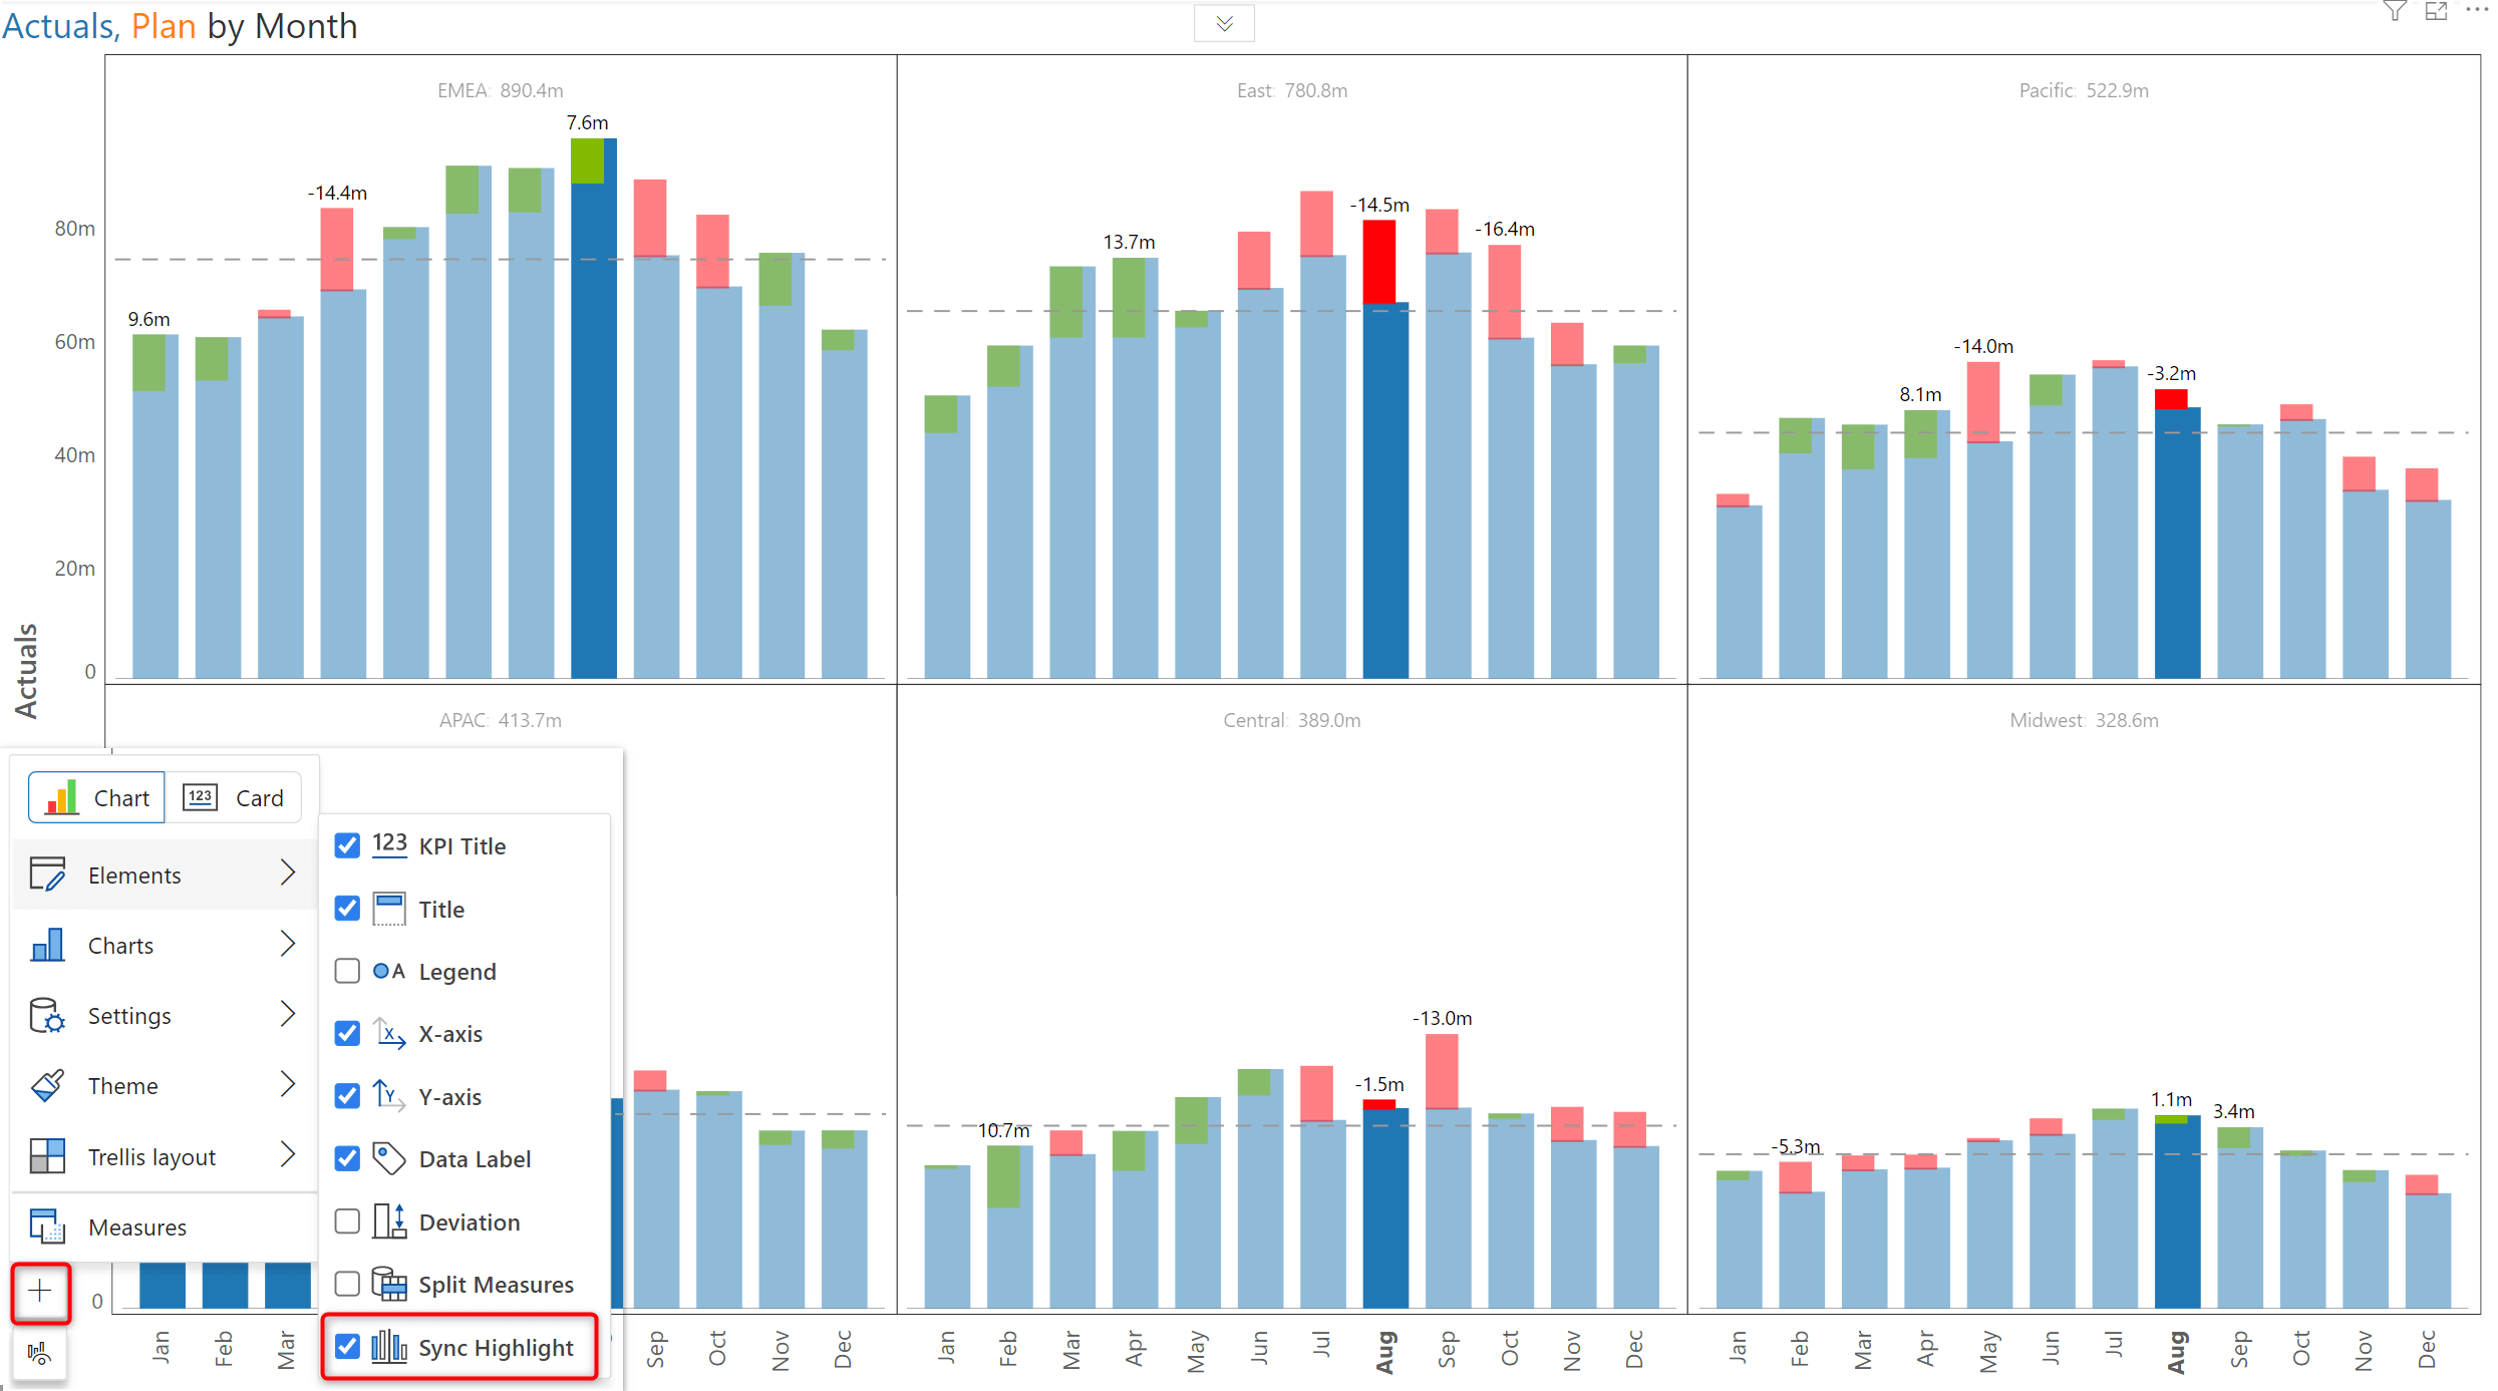
You can use the sync highlight option to spotlight a particular selected data point(s) across all panels of the trellis. If sync highlight is enabled, you can choose whether to display hidden data points on selection. Similar to the lasso feature, the sync highlight feature can work in conjunction with other visuals on the same page.
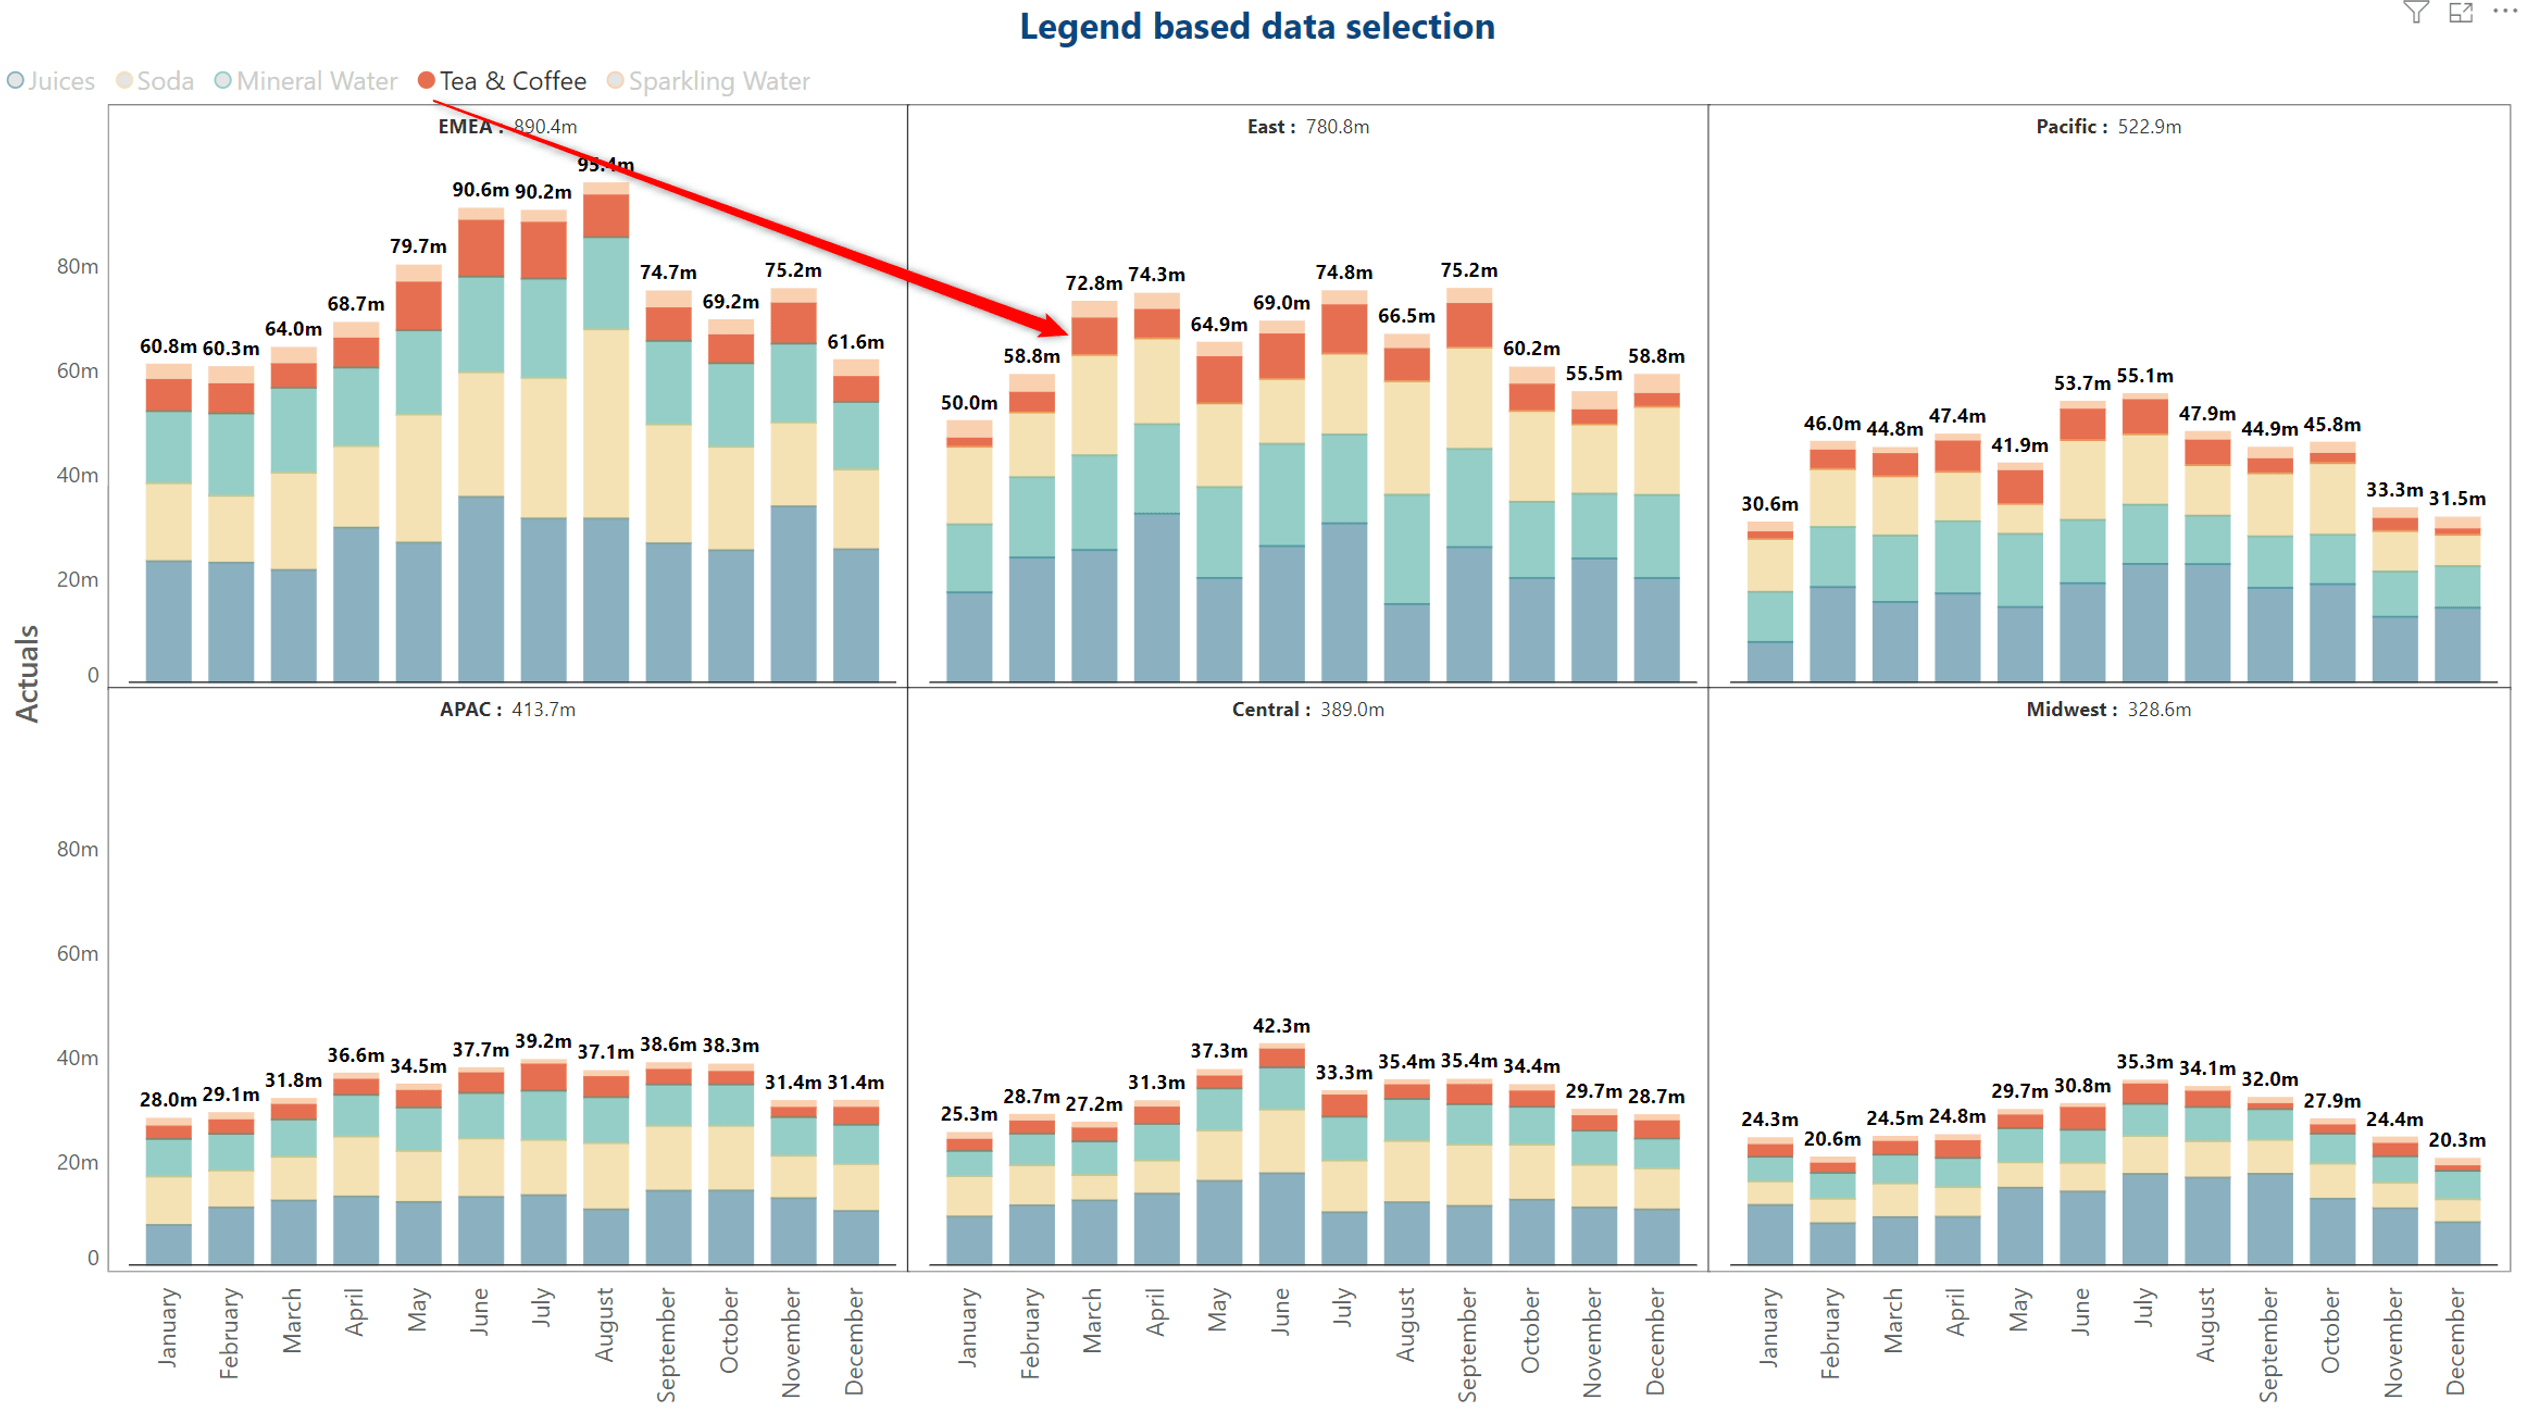
Inforiver’s legend-based selection enables you to emphasize data for a particular category. Now, you can use this feature even when there are multiple group parameters.
The Sort feature has been retrofitted with a new UI that enables:
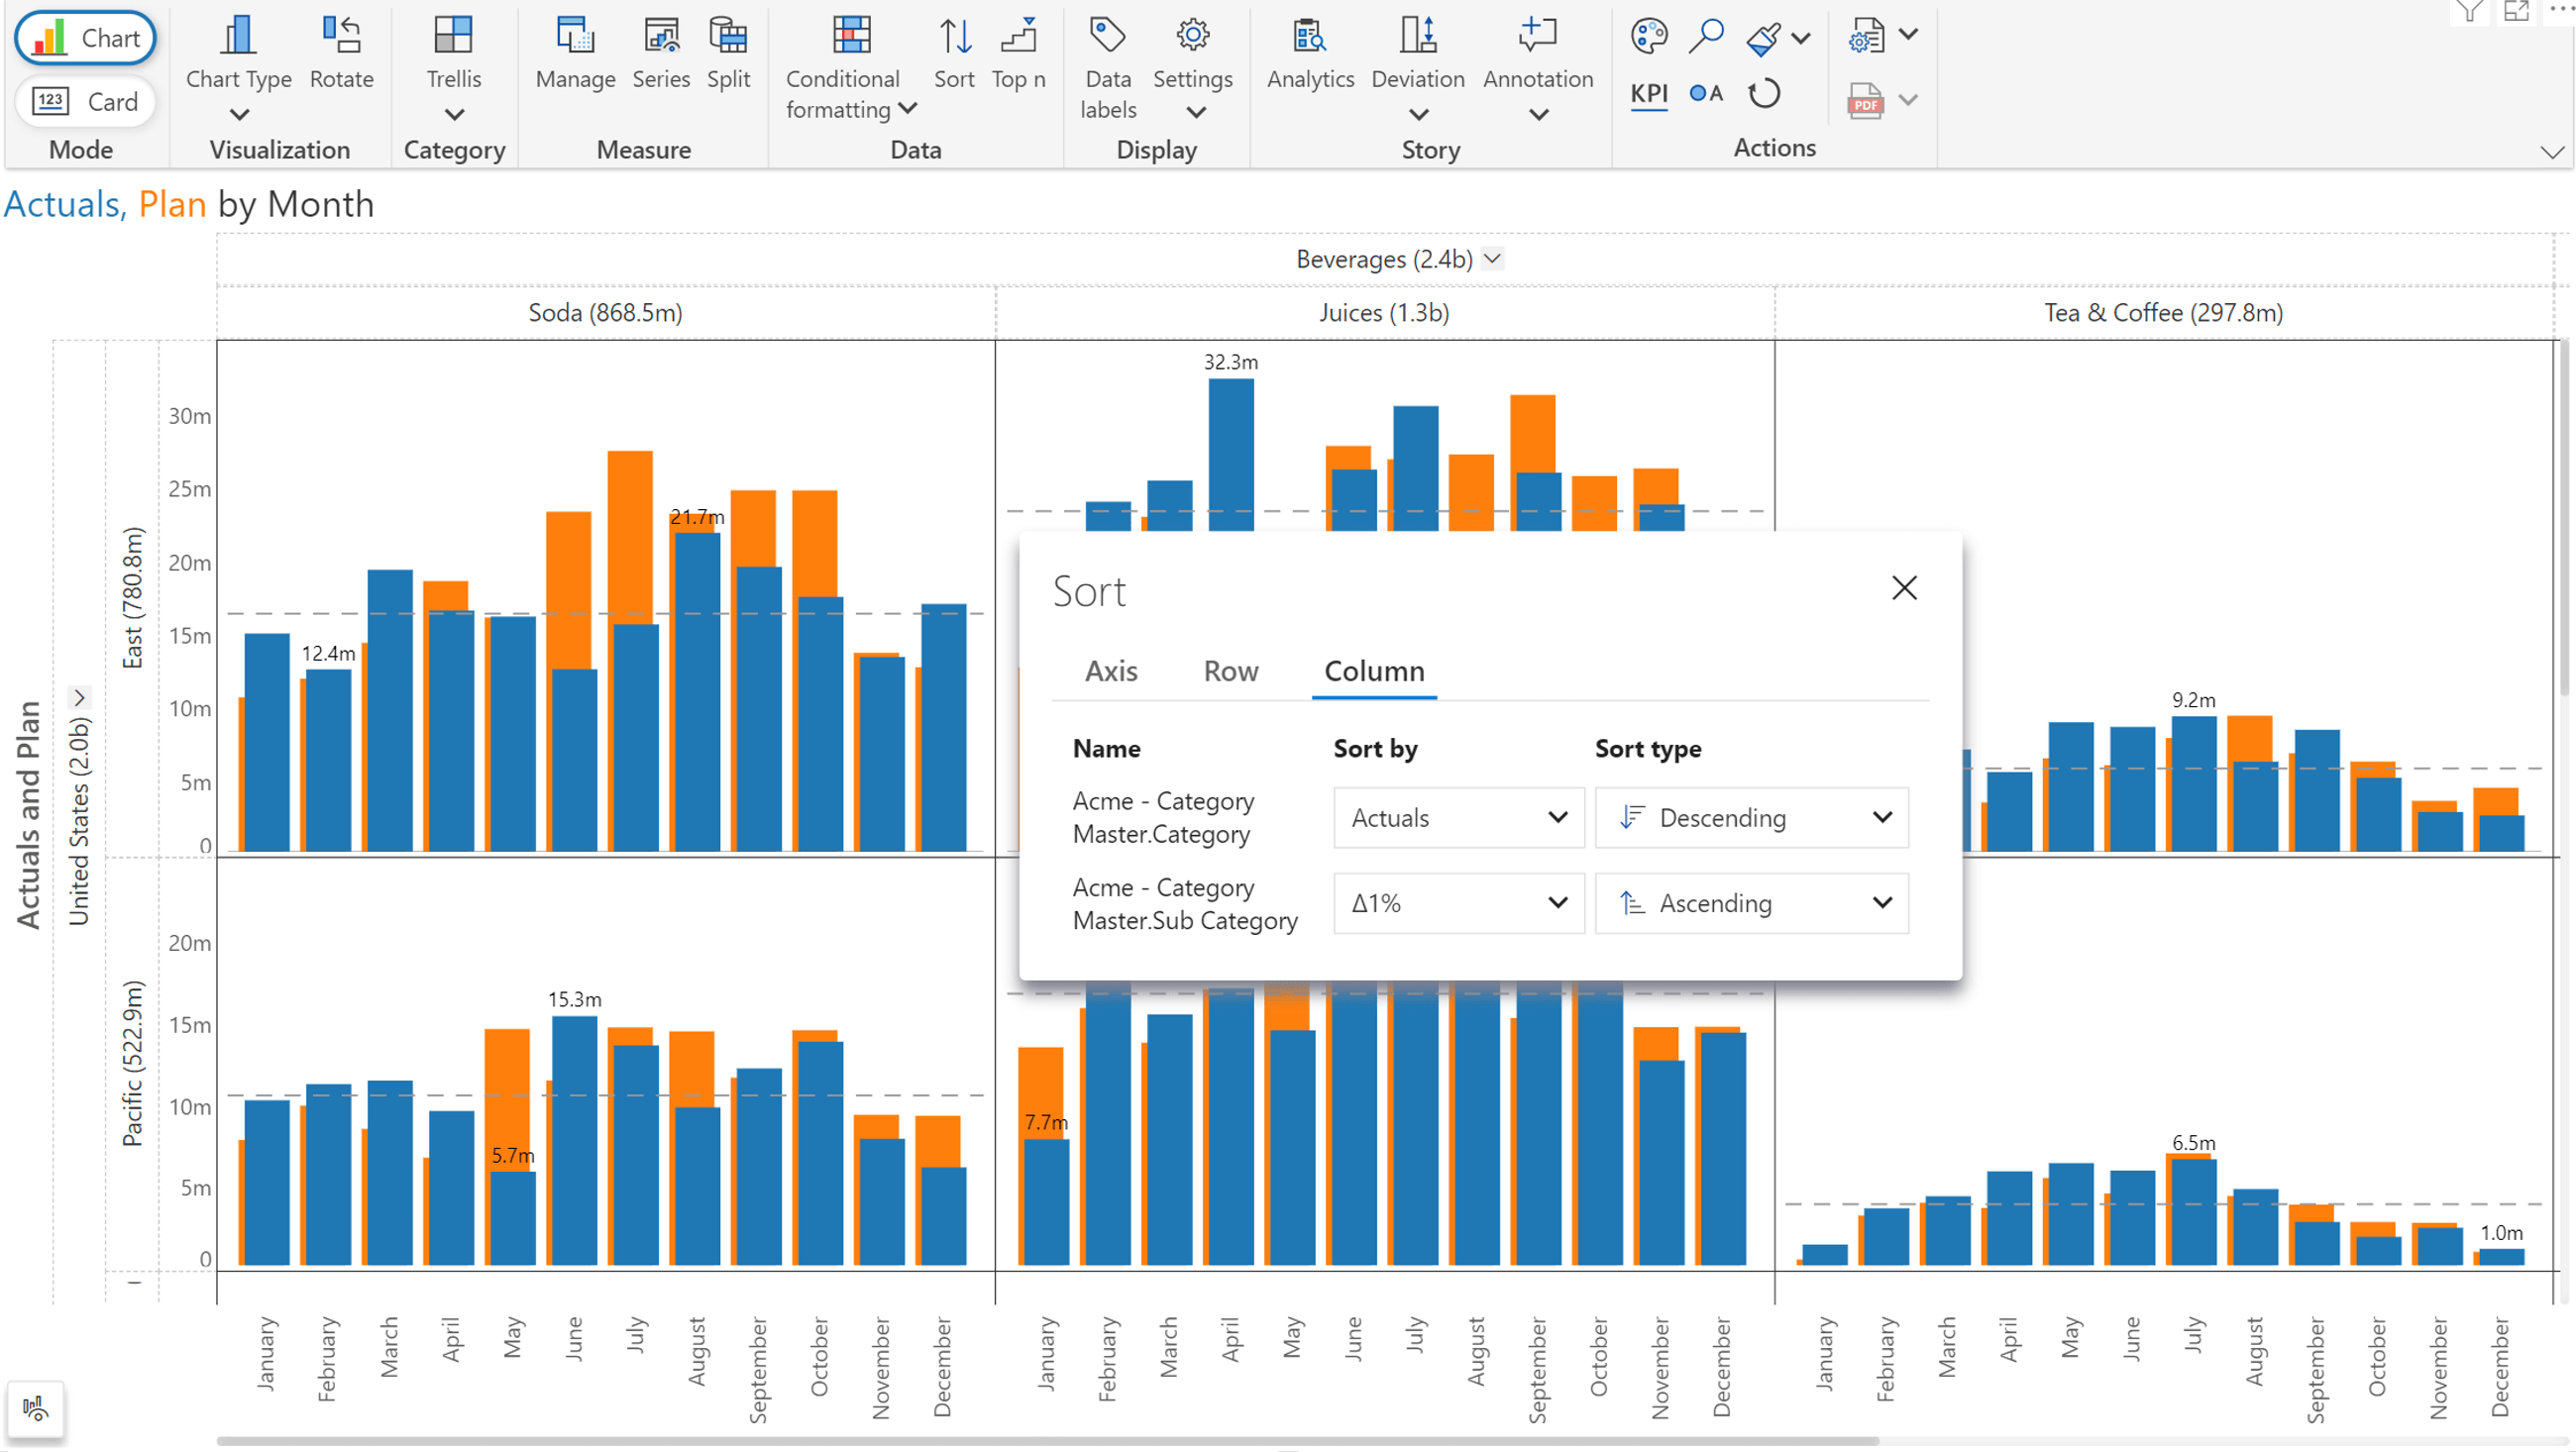
Expand/collapse for hierarchical axes
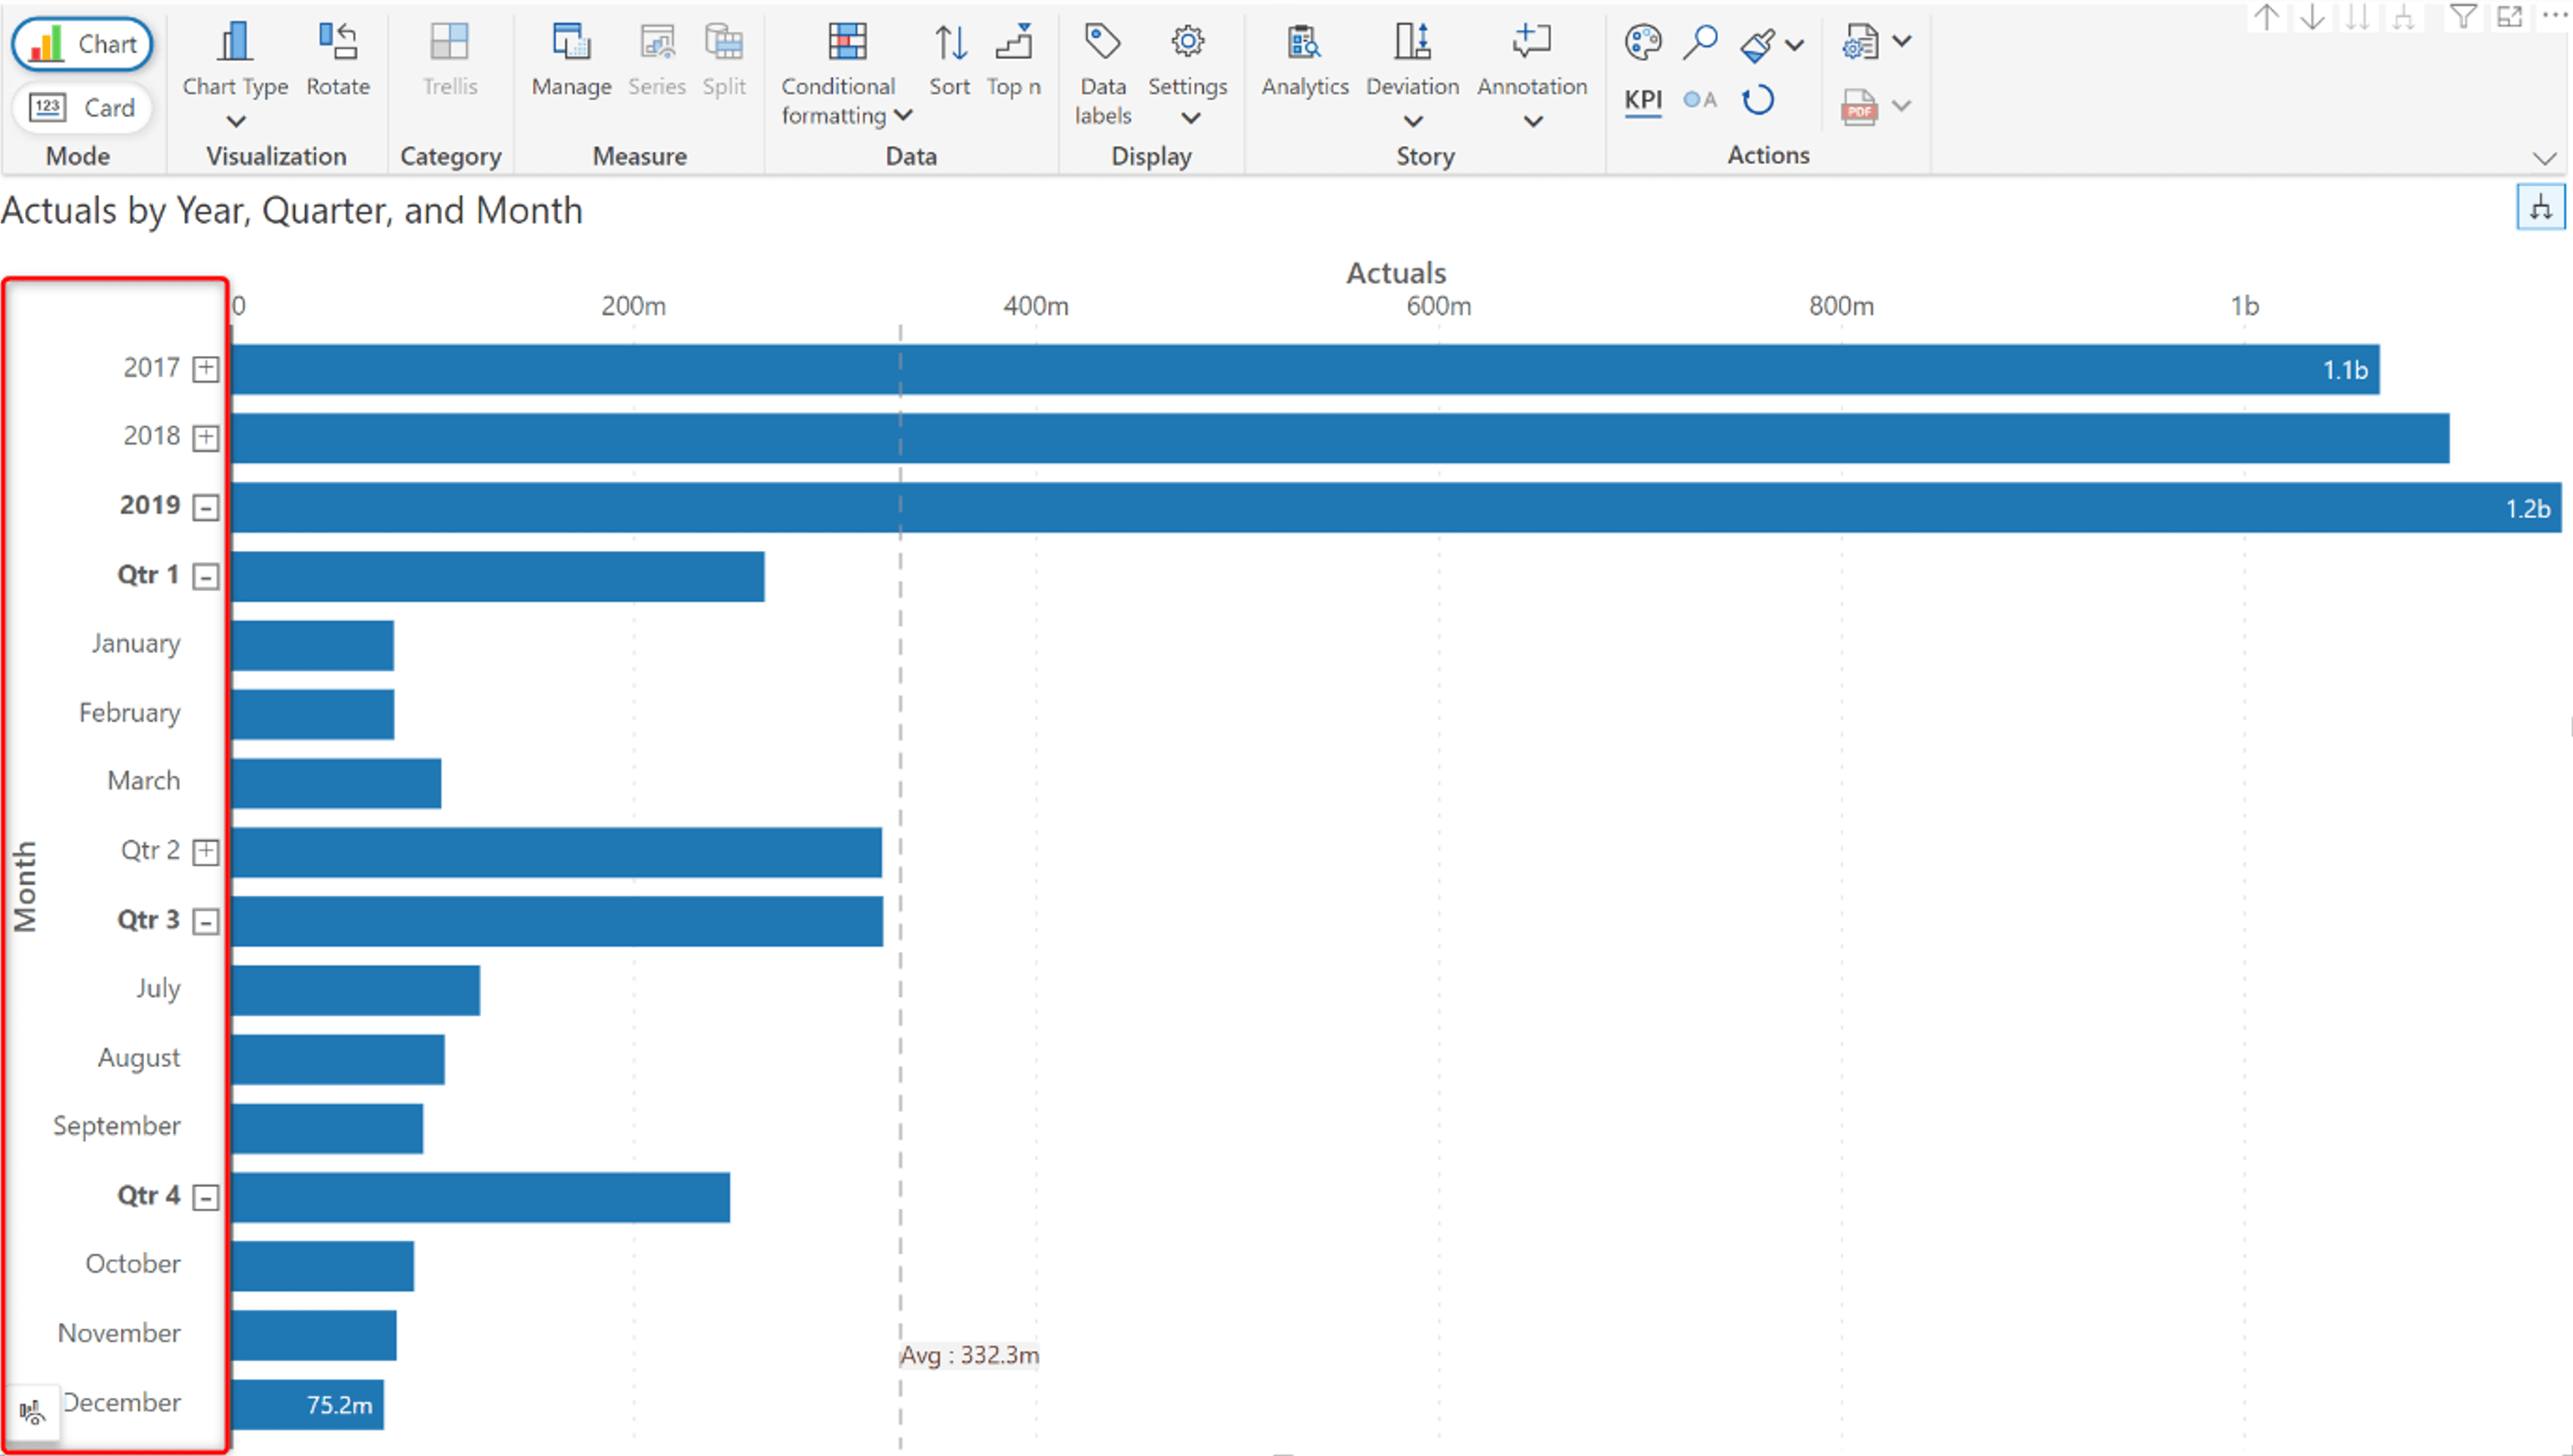
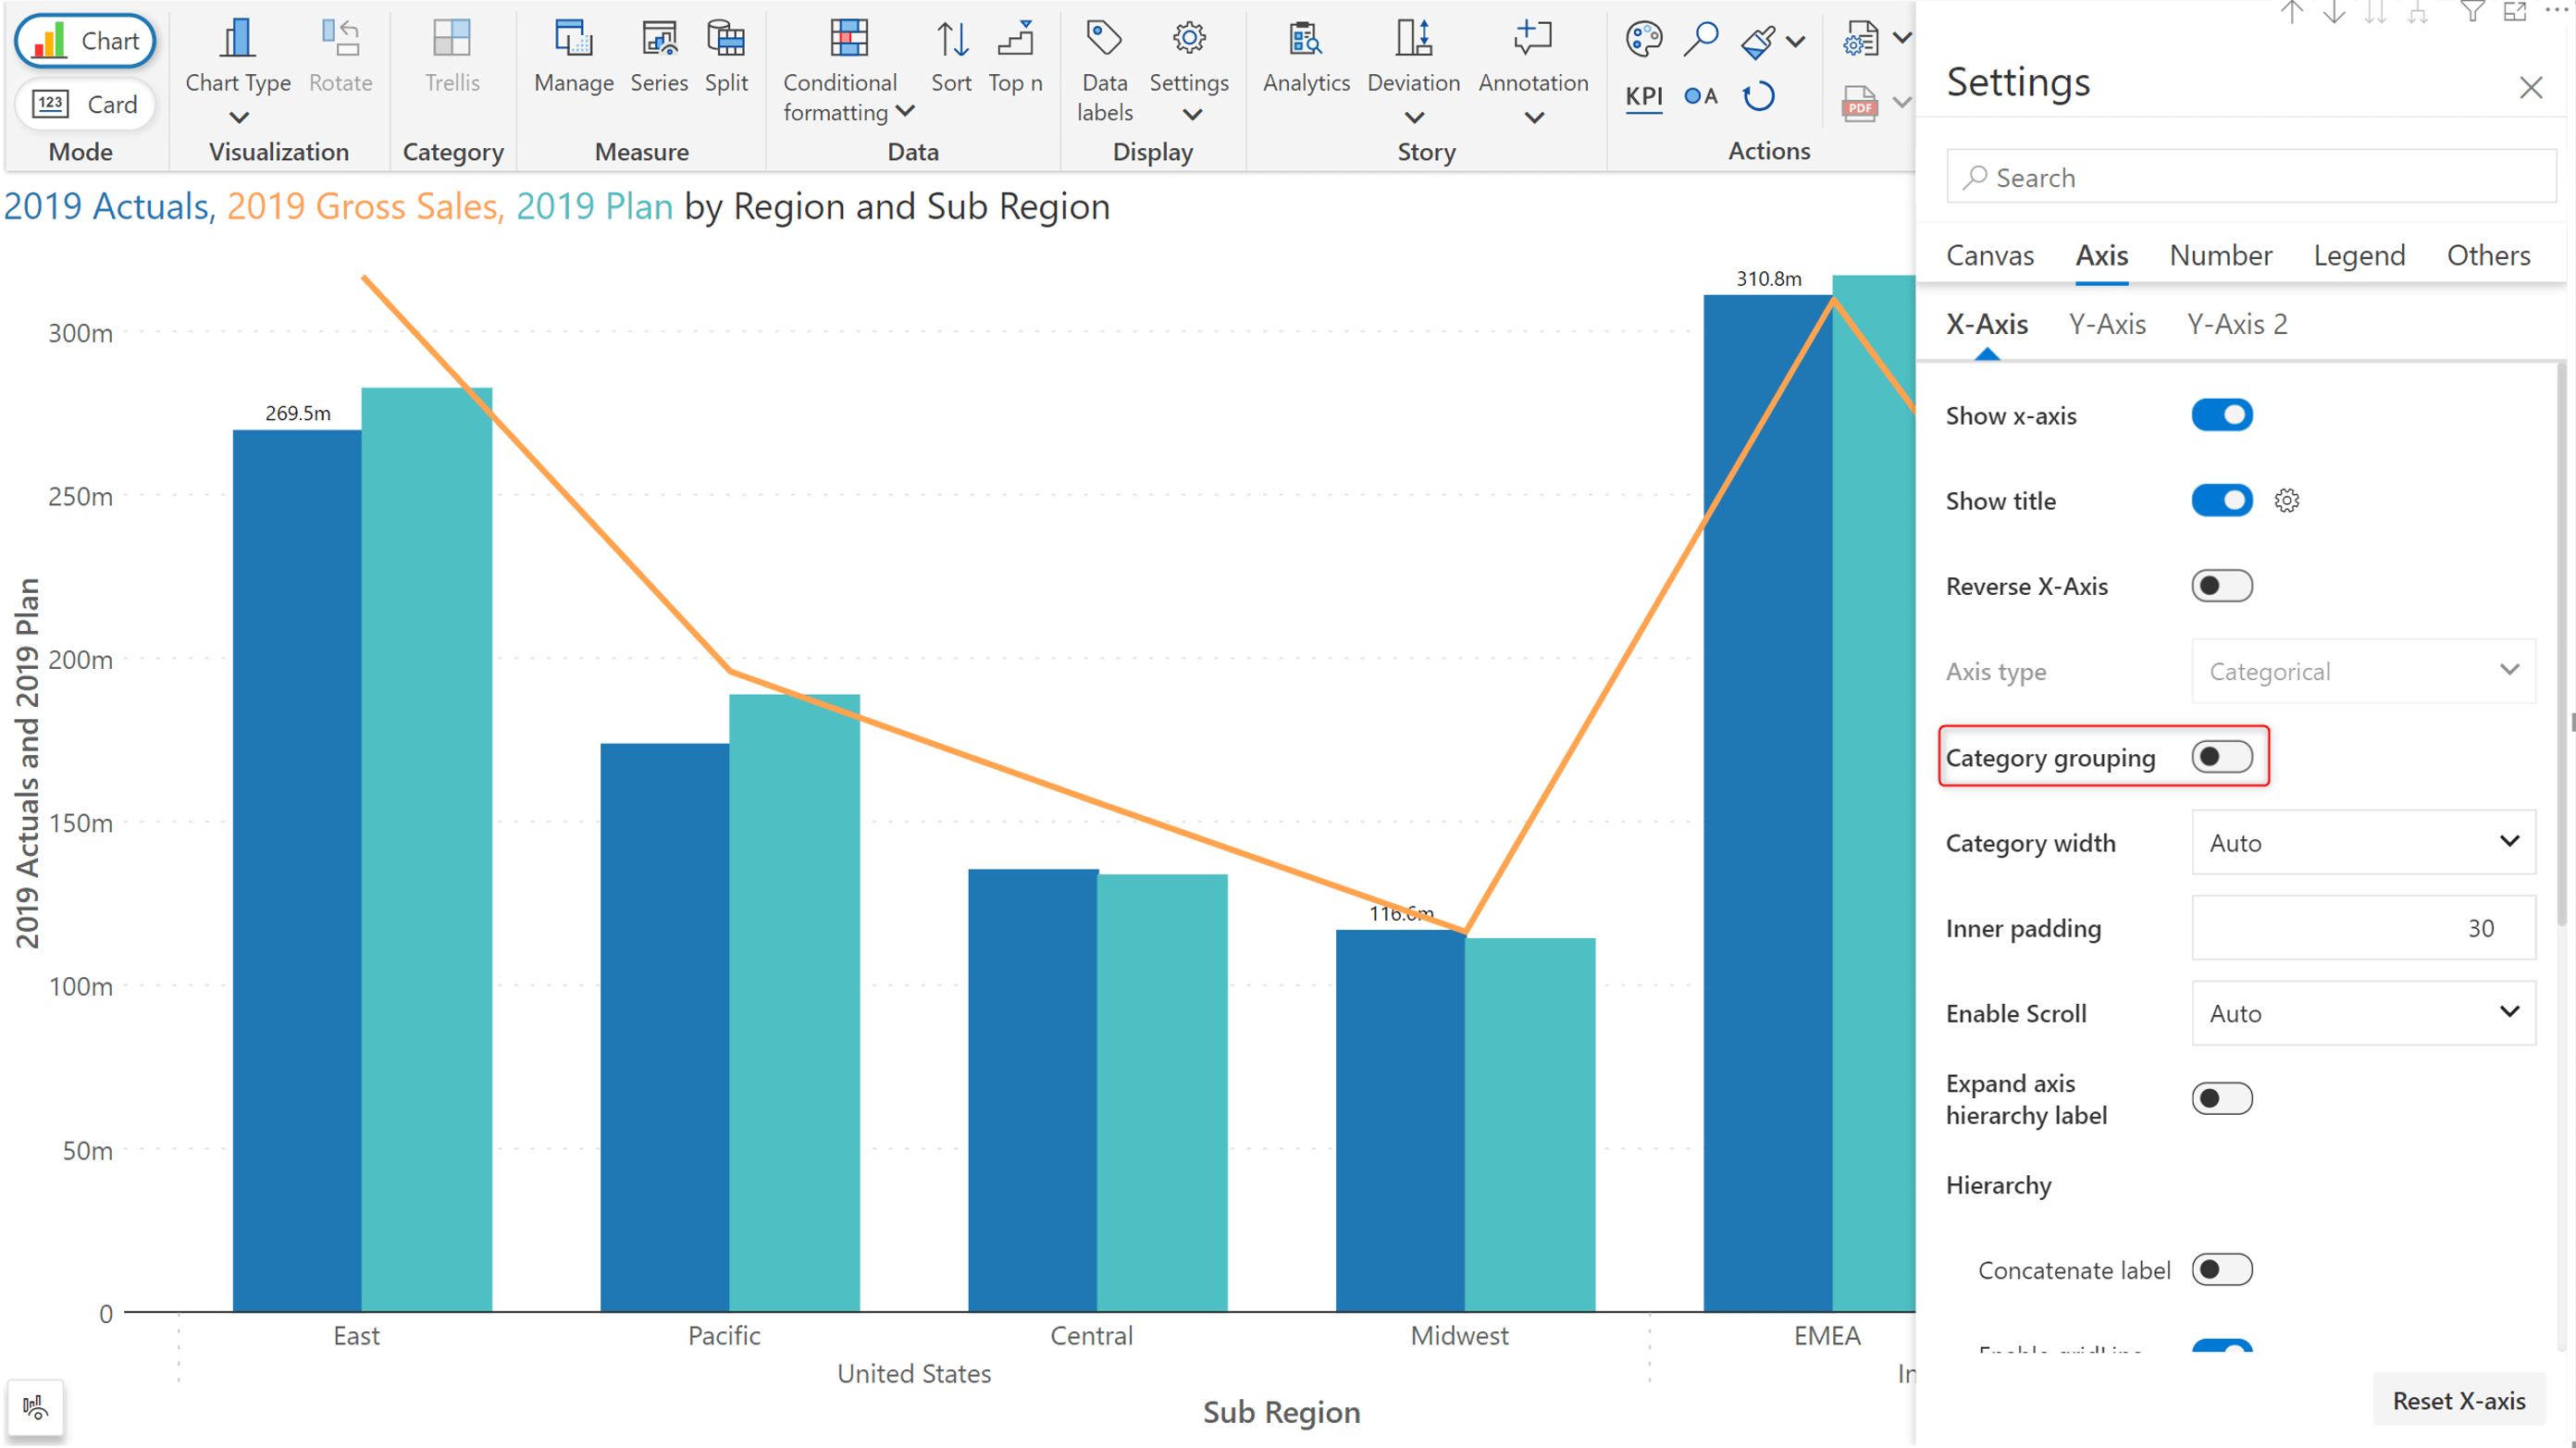
If your reports use hierarchical dimensions as Axis parameters, Inforiver Analytics+ 3.1 gives the ability to expand and collapse the hierarchy. With this feature, you can focus on specific levels of the hierarchy by expanding only those levels. Inforiver Analytics+ supports expand/collapse on rows, columns and axes.
You can turn off the Category Grouping setting to disable the expand/collapse feature for hierarchical axis.
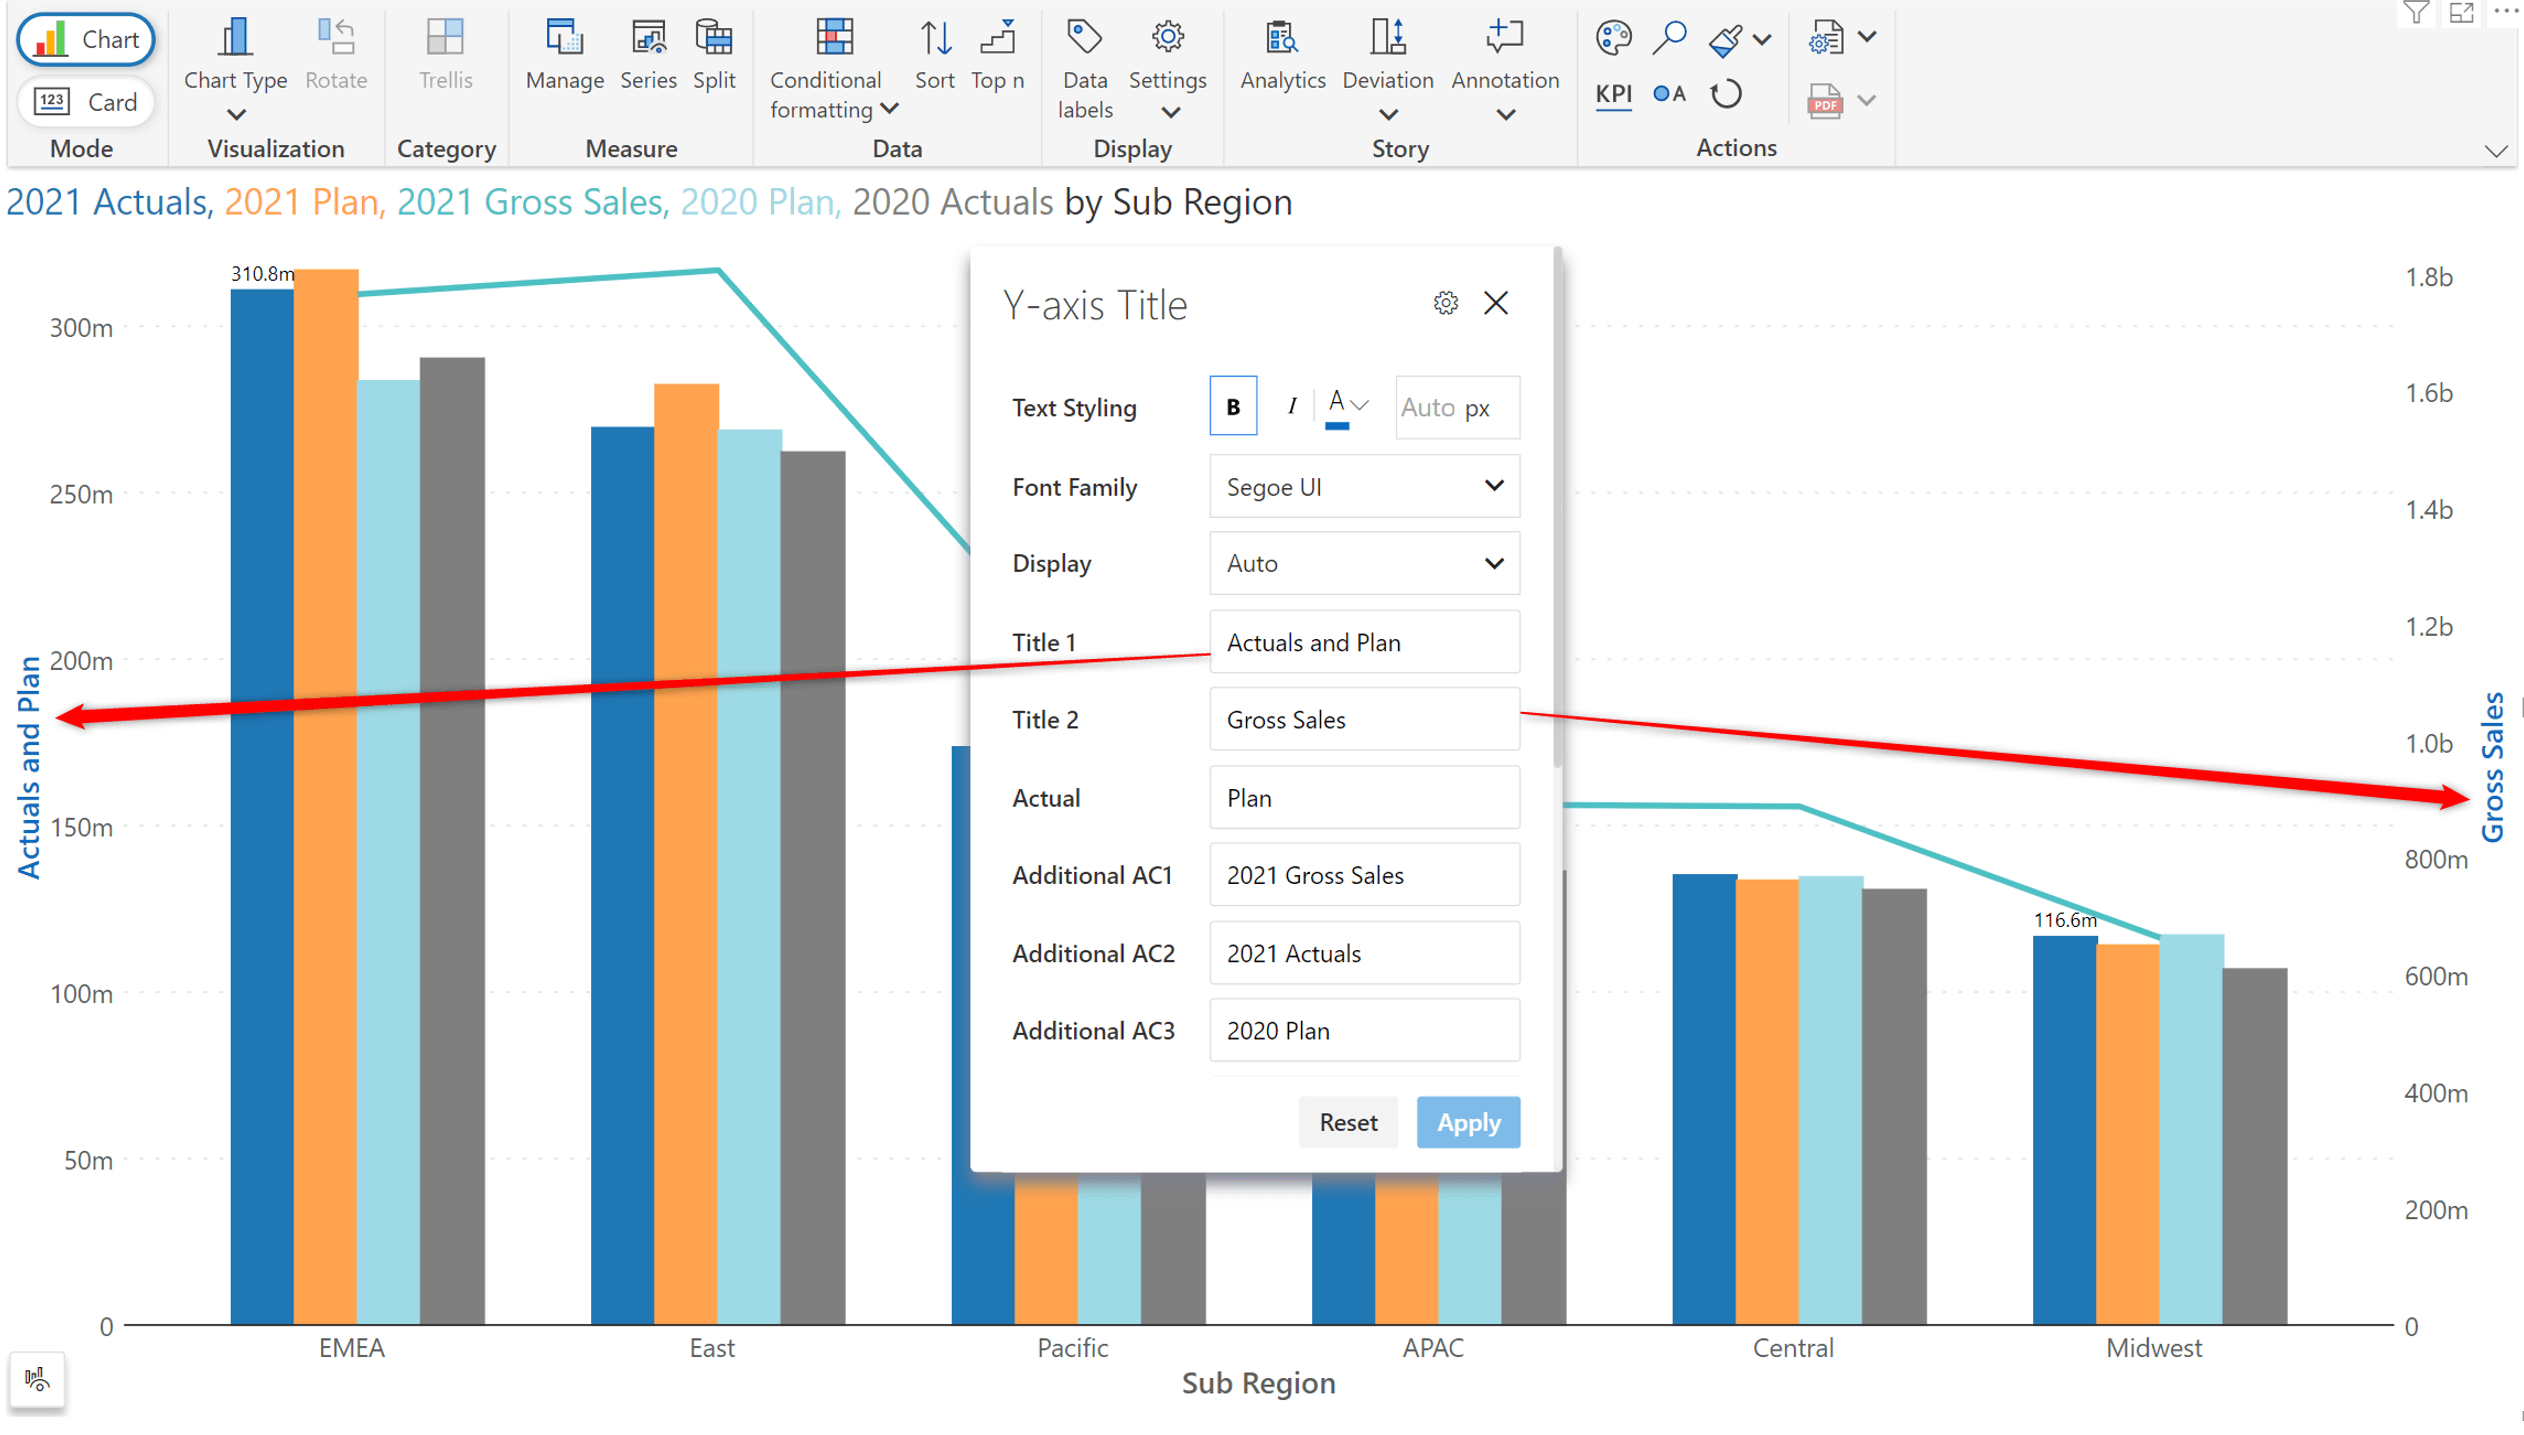
Custom Y-axis title
If your report contains multiple measures on the y-axis, with the 3.1. release, you can use the title UI to customize the Y-axis title:
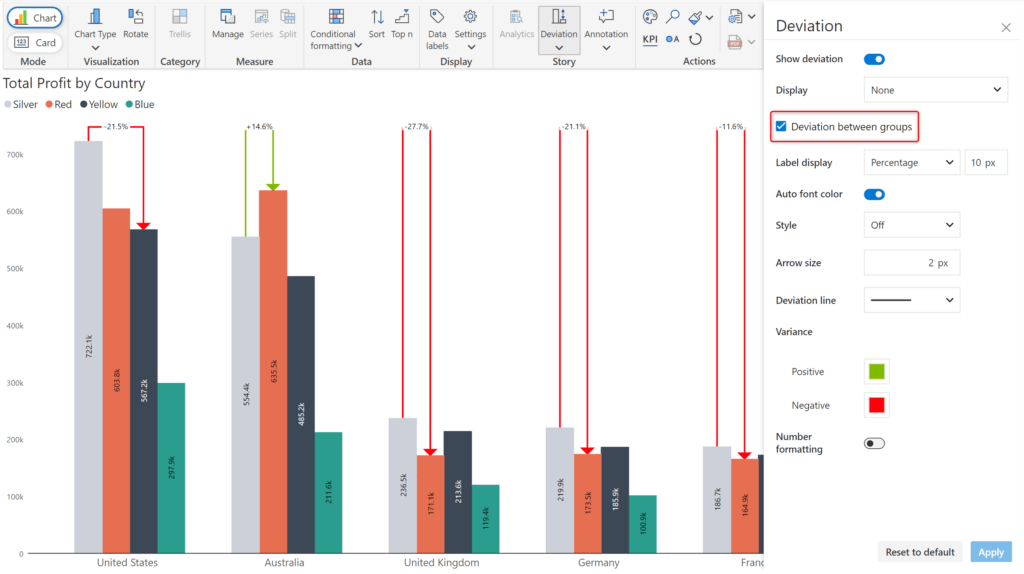
The deviation feature is now available for cluster column and stacked column charts as well.
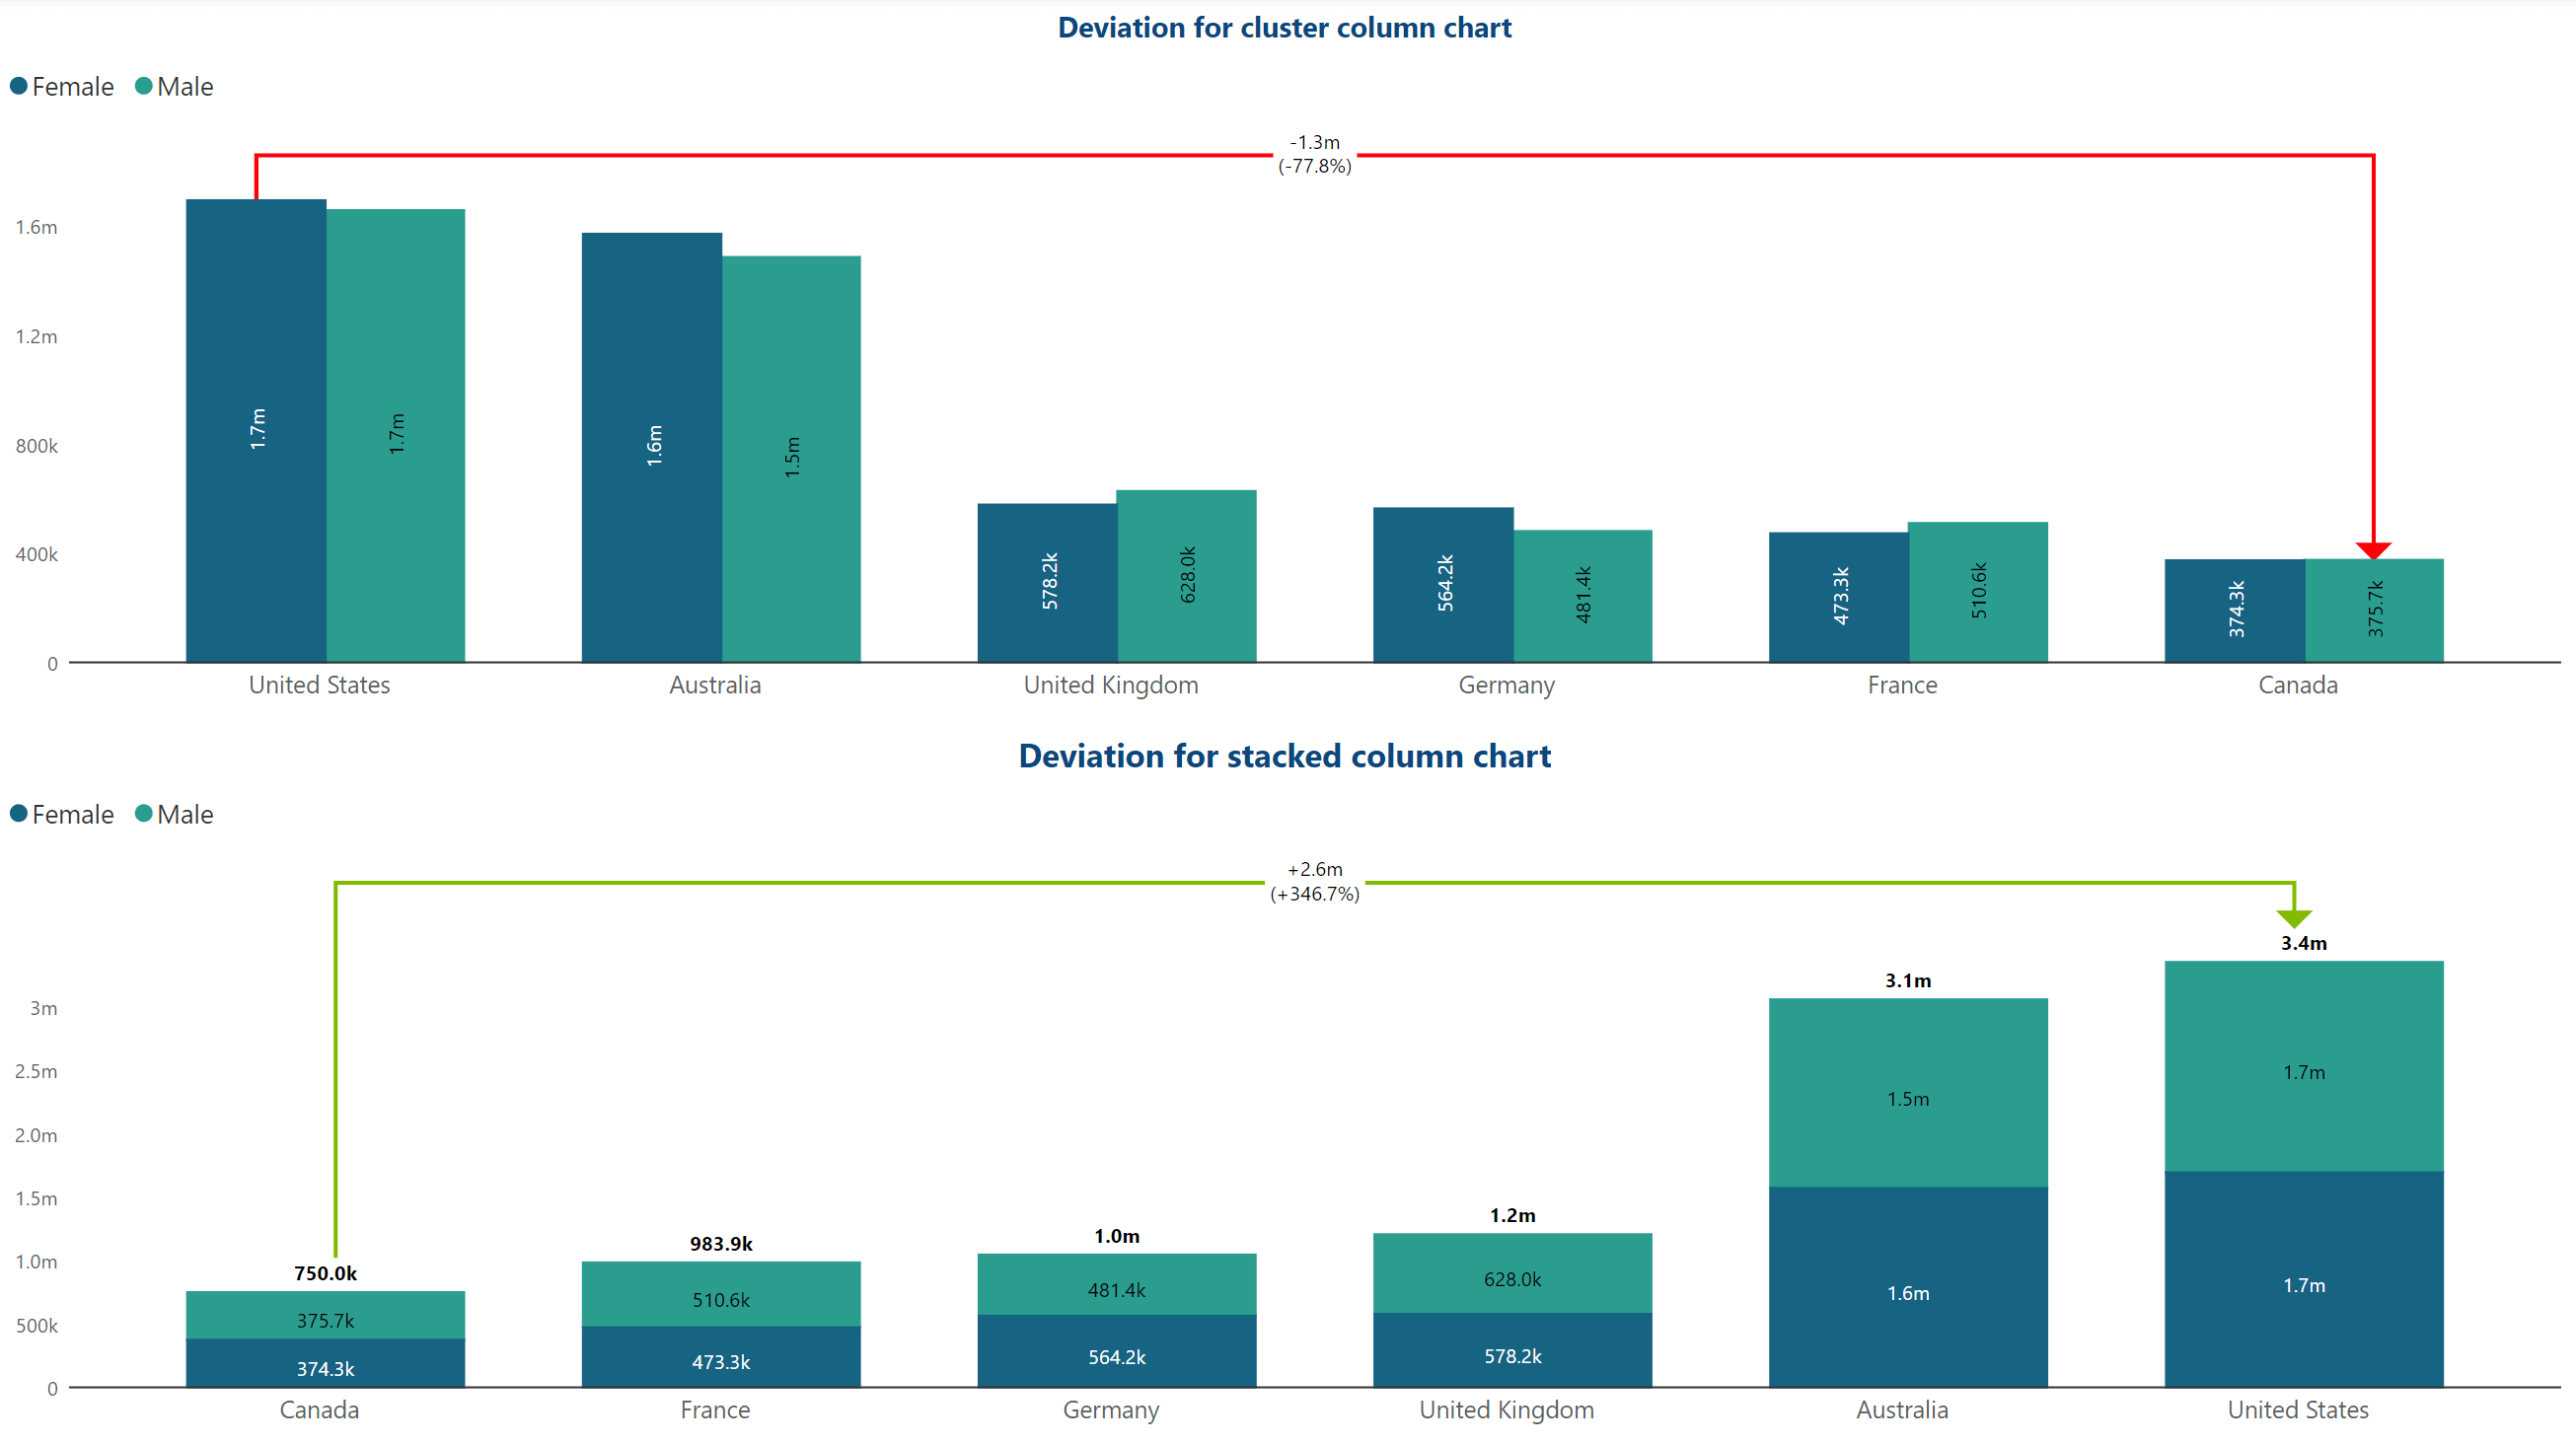
If you are using group dimensions in your cluster charts, you can also choose to display the deviation between each group.
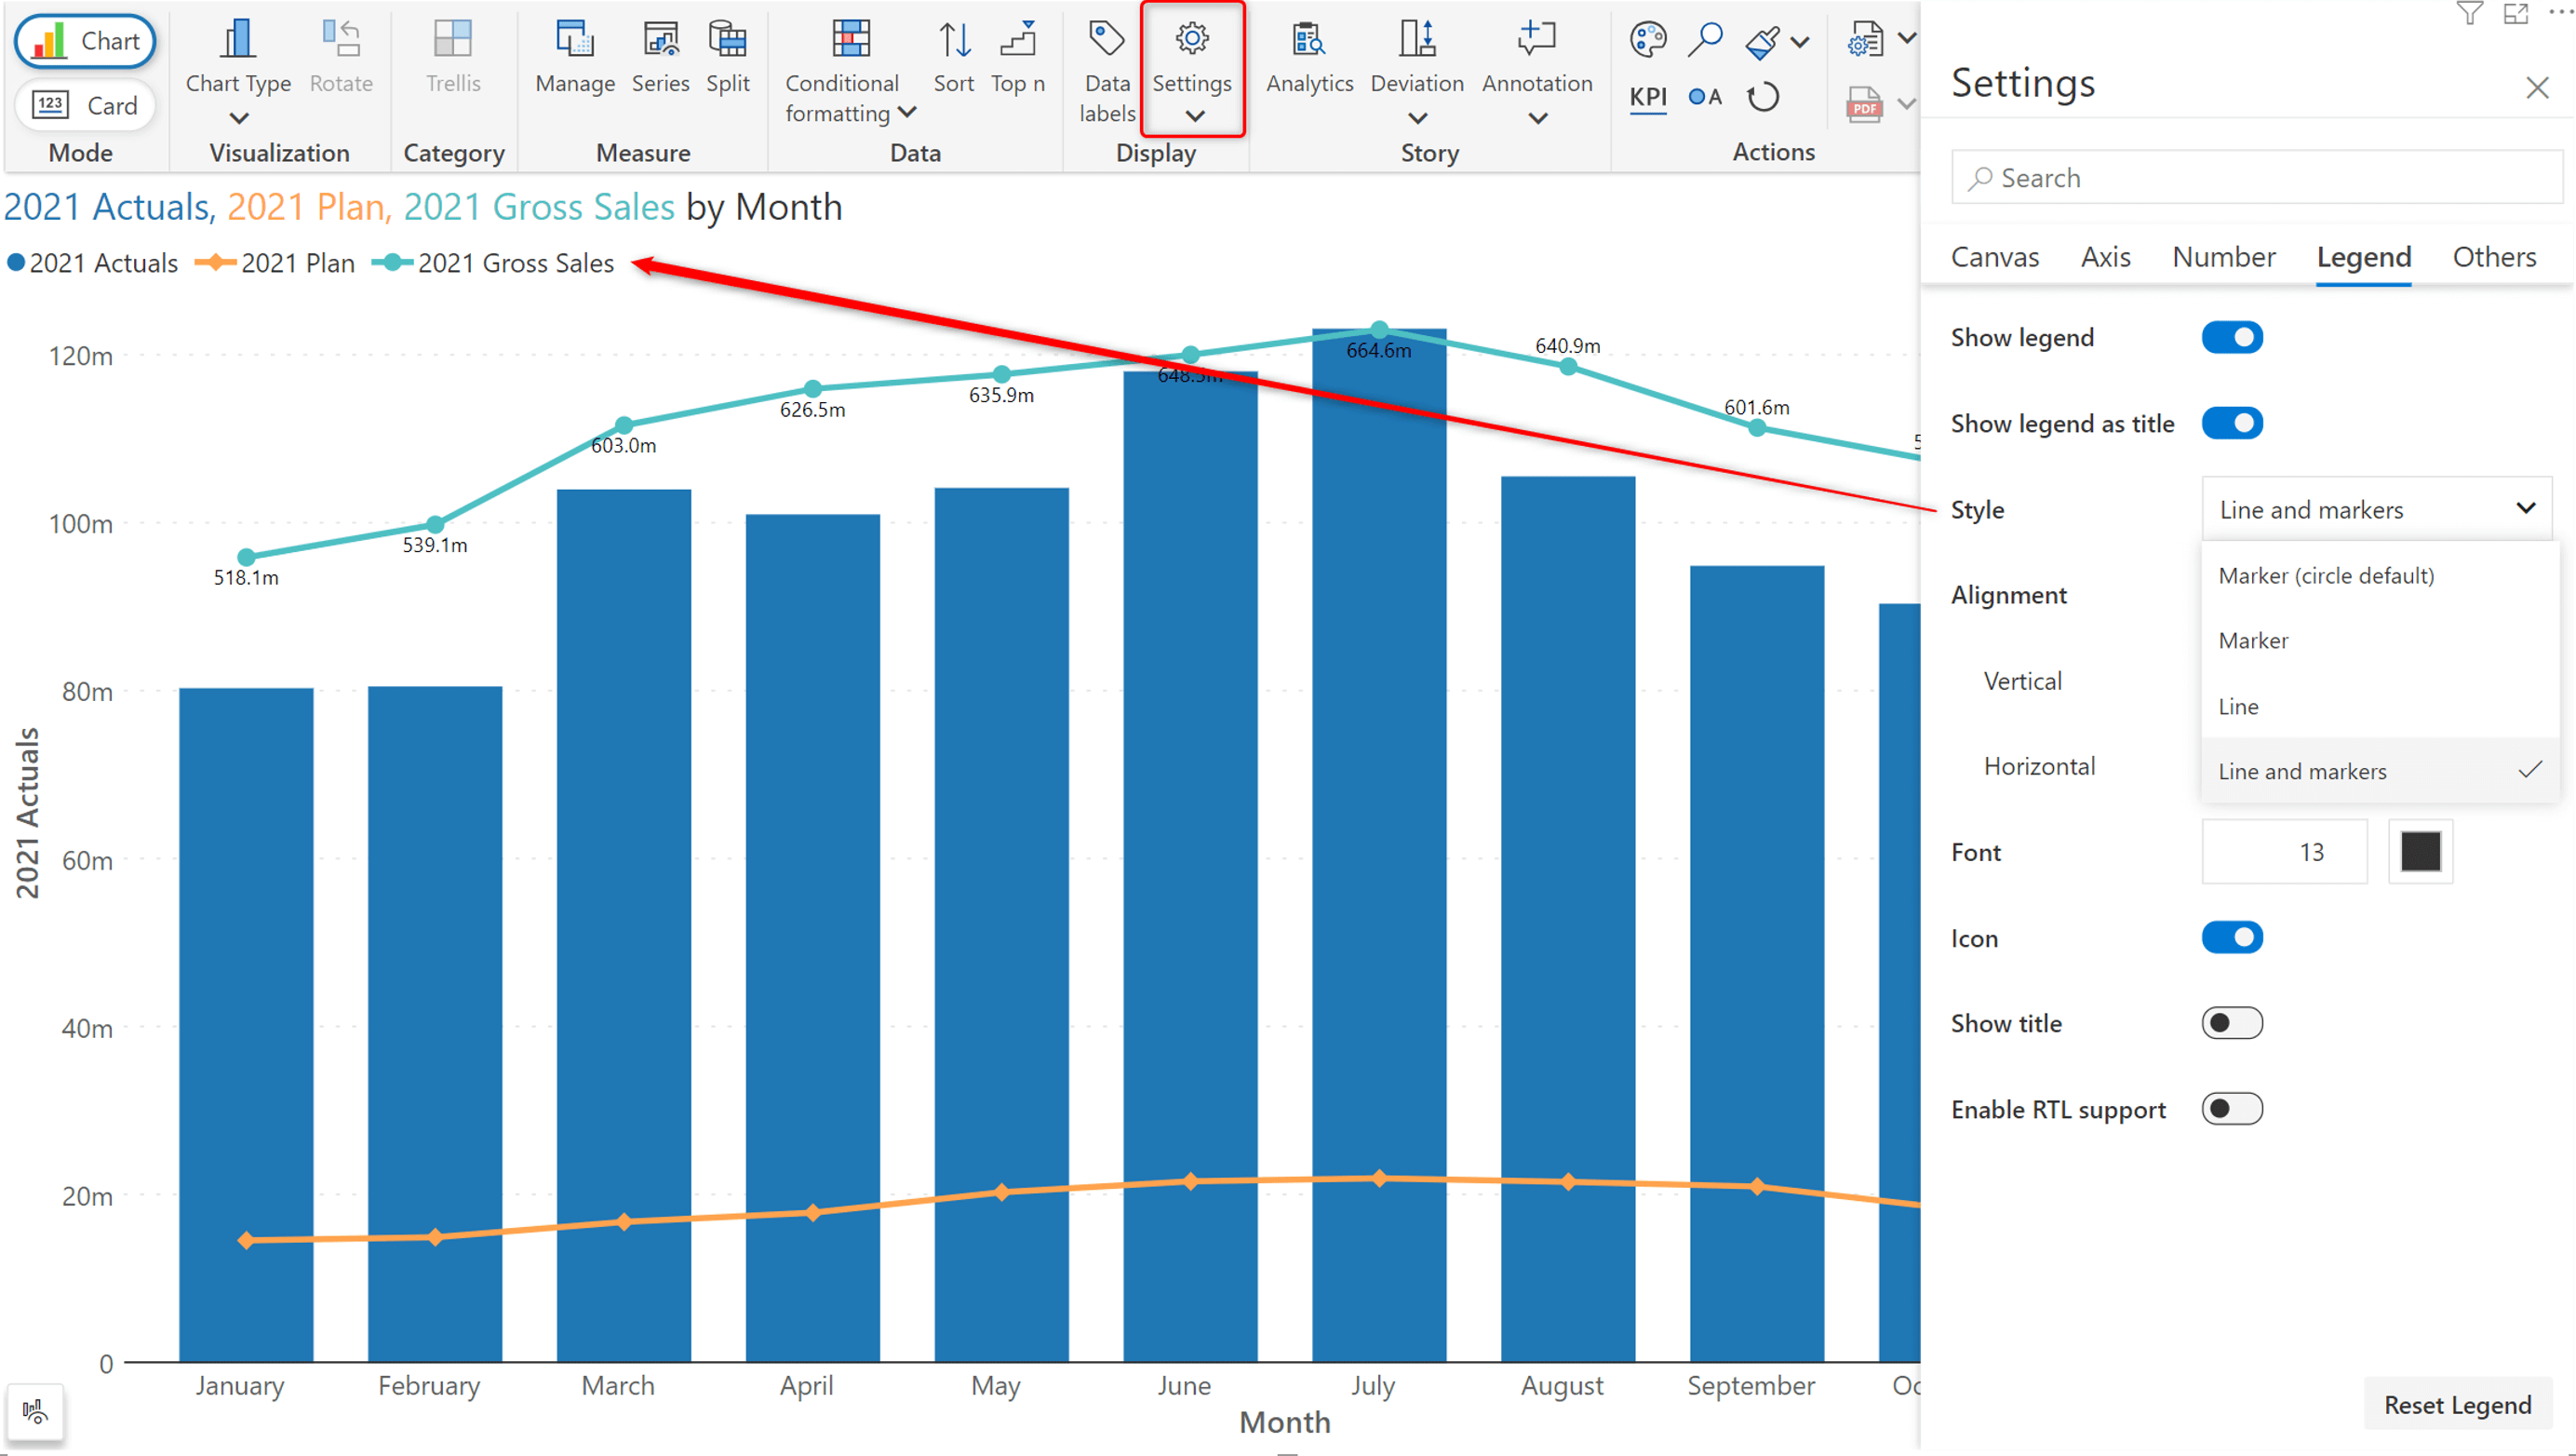
The legend can now display markers used in the chart, making it easier to co-relate the data. You can select the marker style from the dropdown menu.
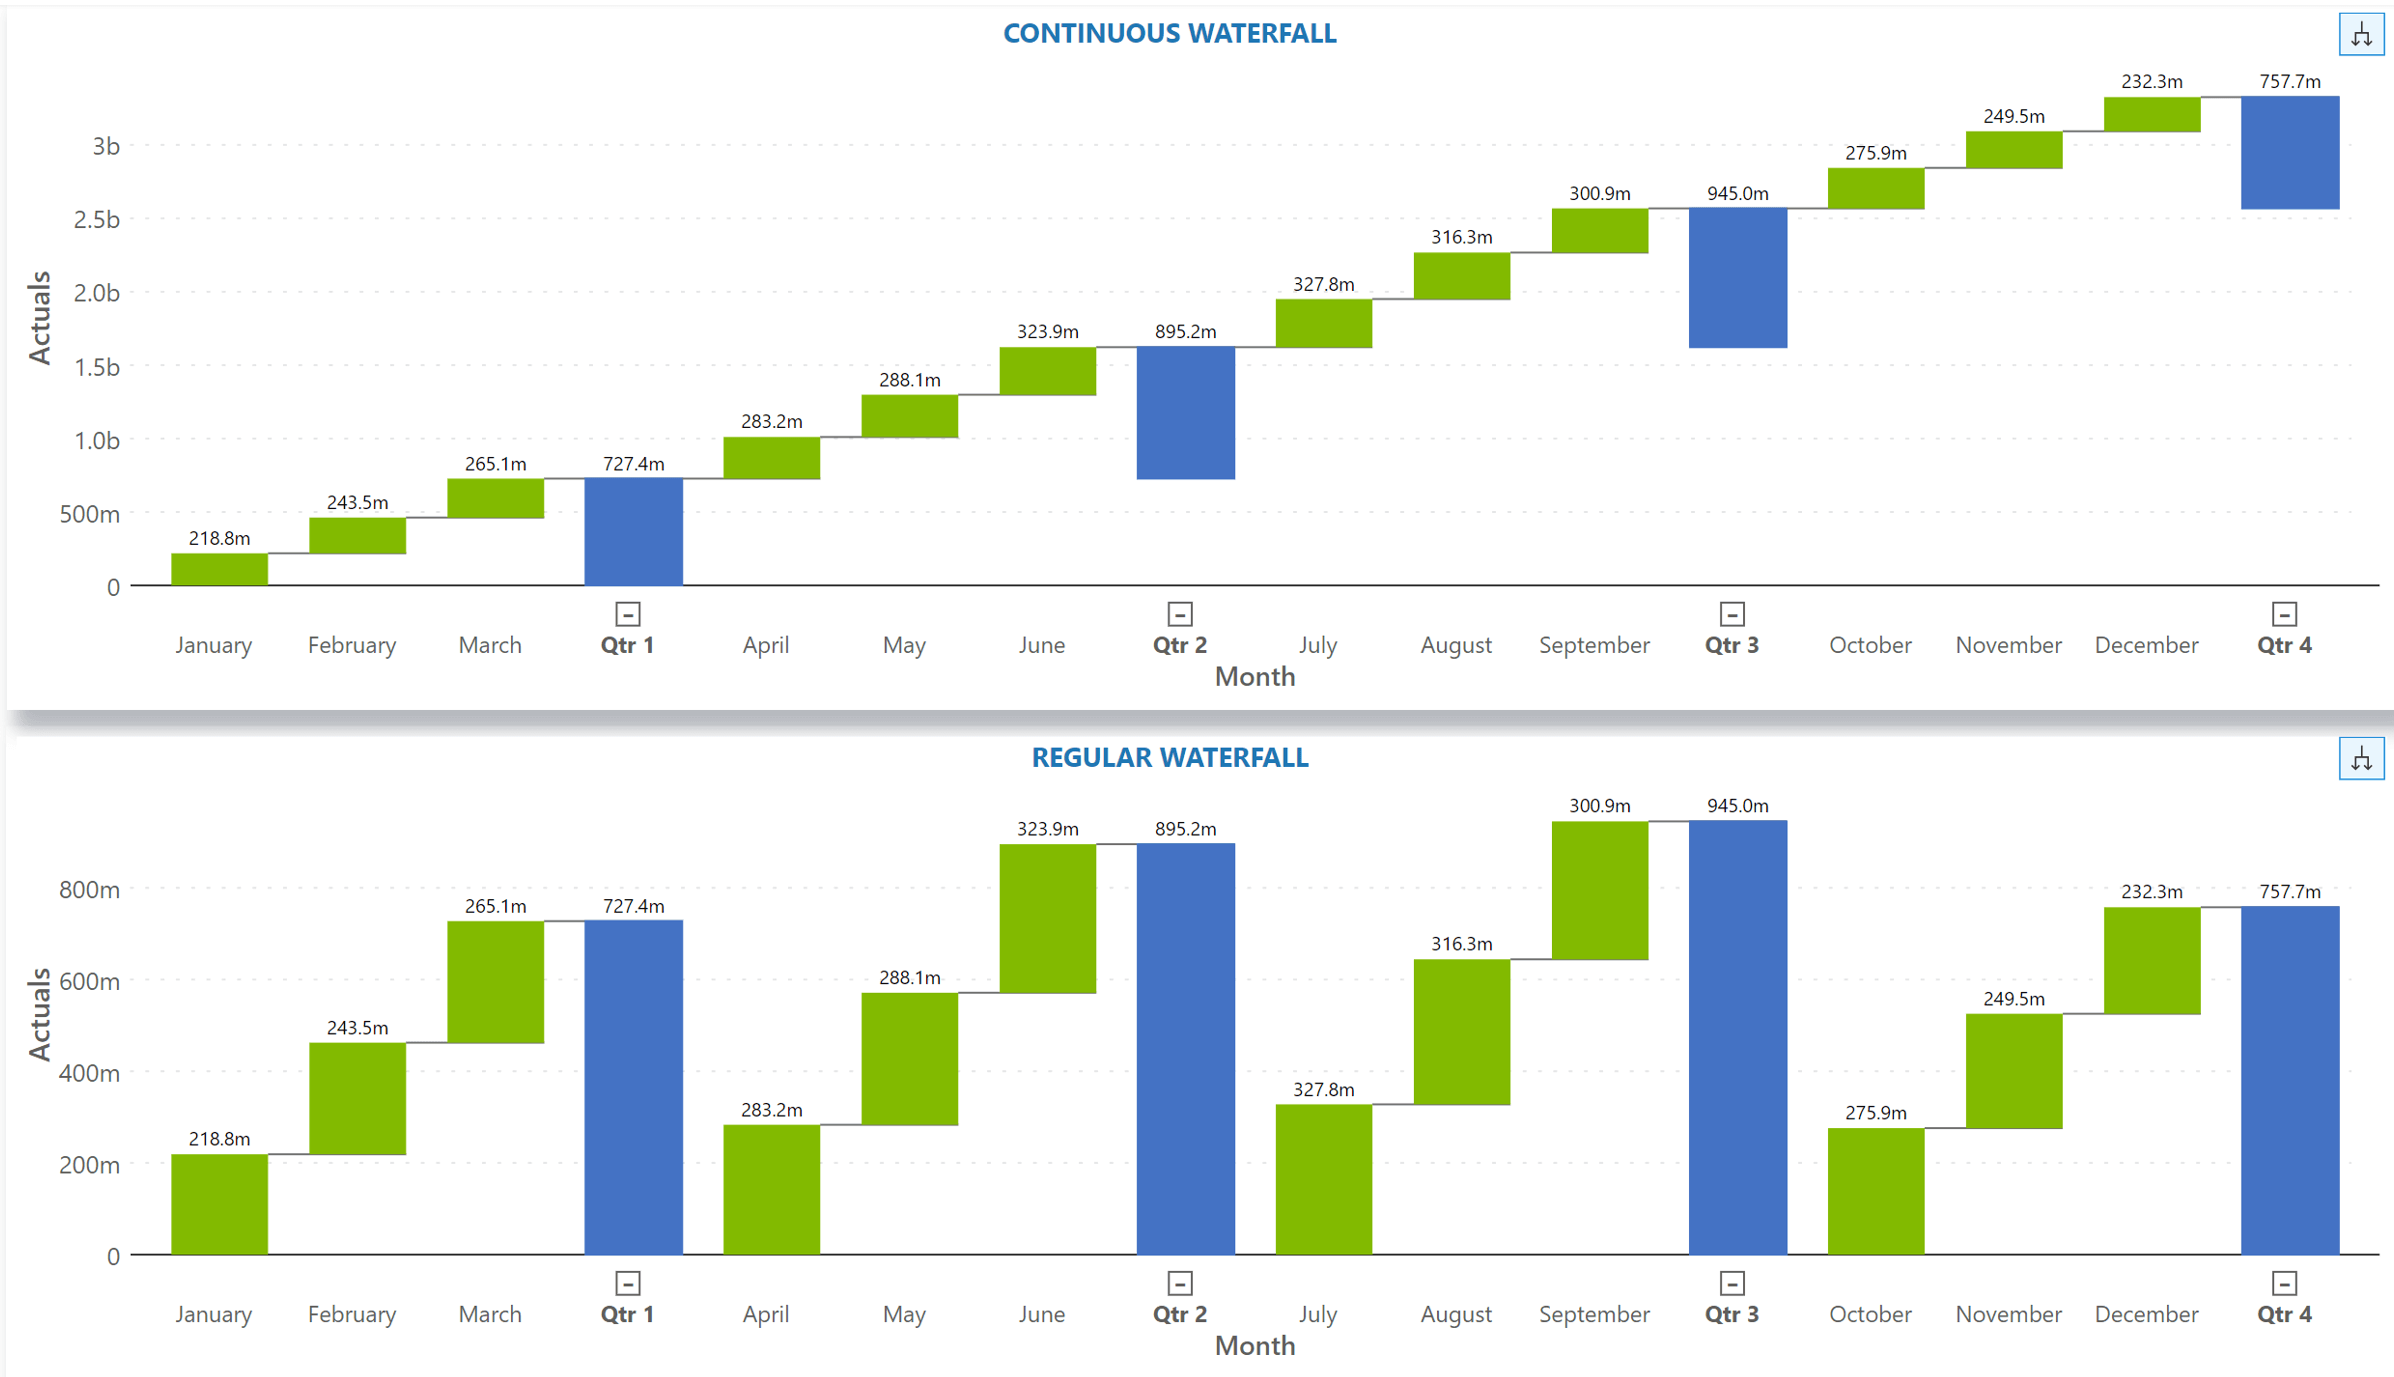
If your report uses waterfall charts, you can seamlessly switch between a regular waterfall or a continuous waterfall using the Settings > Canvas > Waterfall type option.
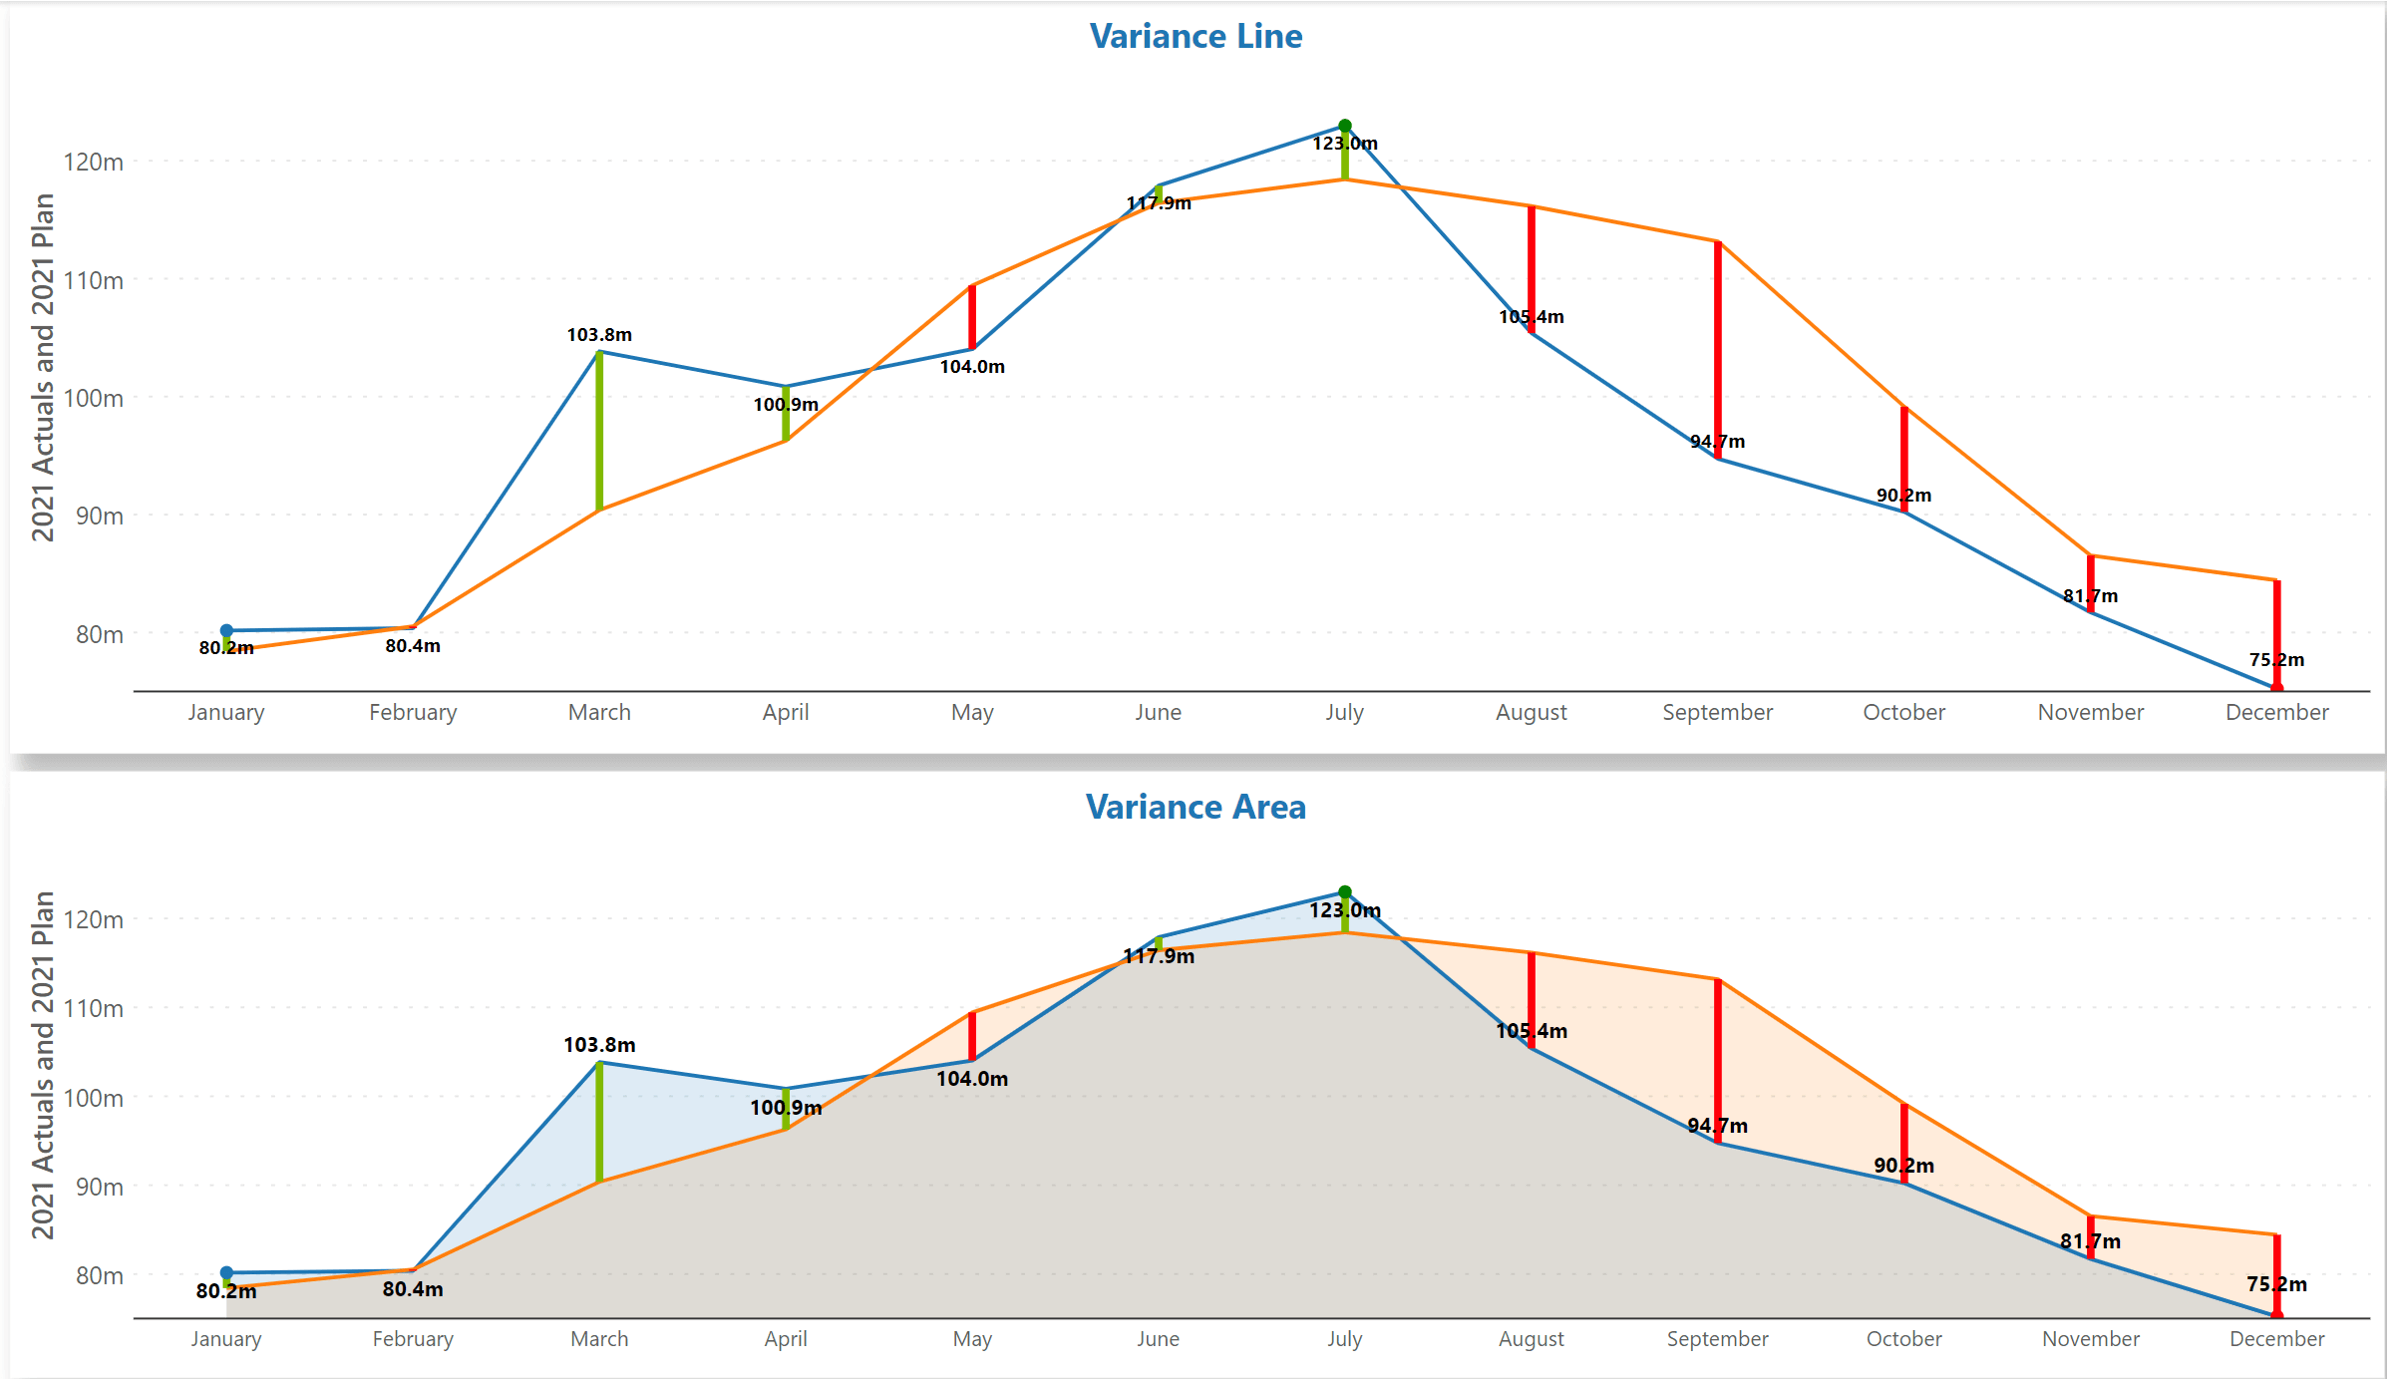
For variance line and area charts, you can now opt for a ‘line’ fill – a line is rendered at each data point, highlighting the positive and negative variance. To enable this setting, navigate to Settings > Canvas > Variance fill type > select Area or Line from the dropdown.
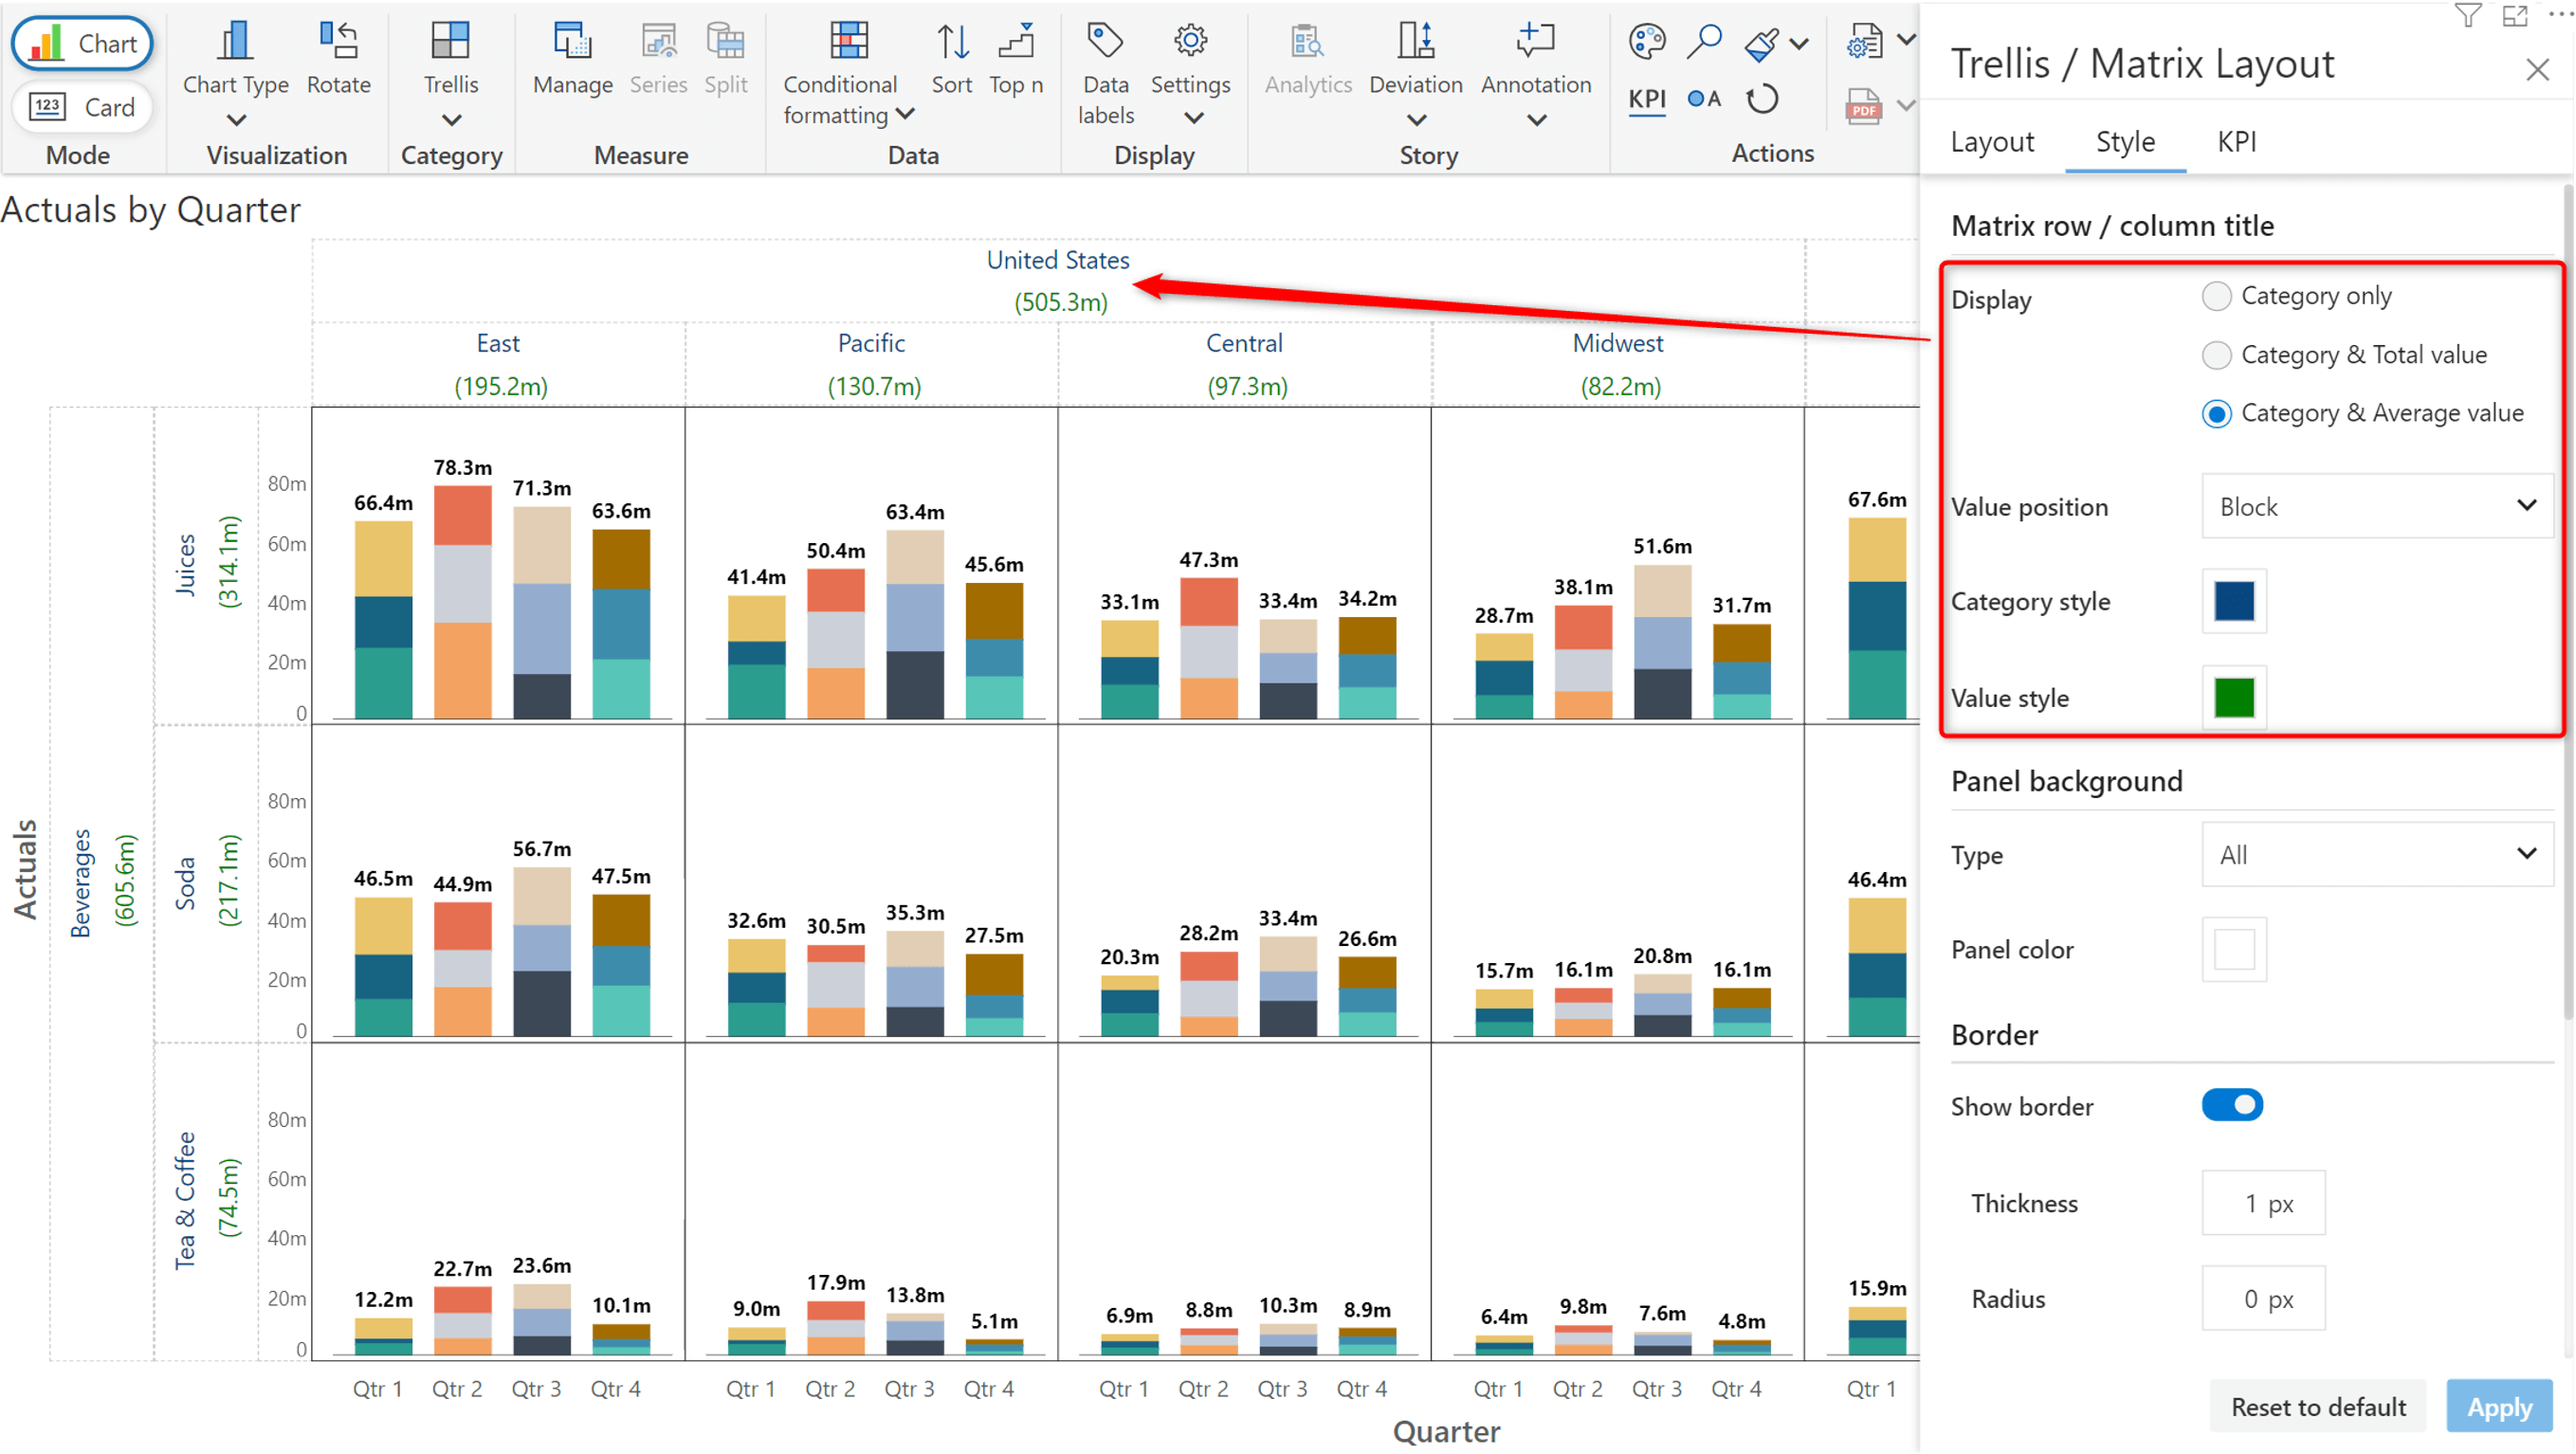
Category title customization
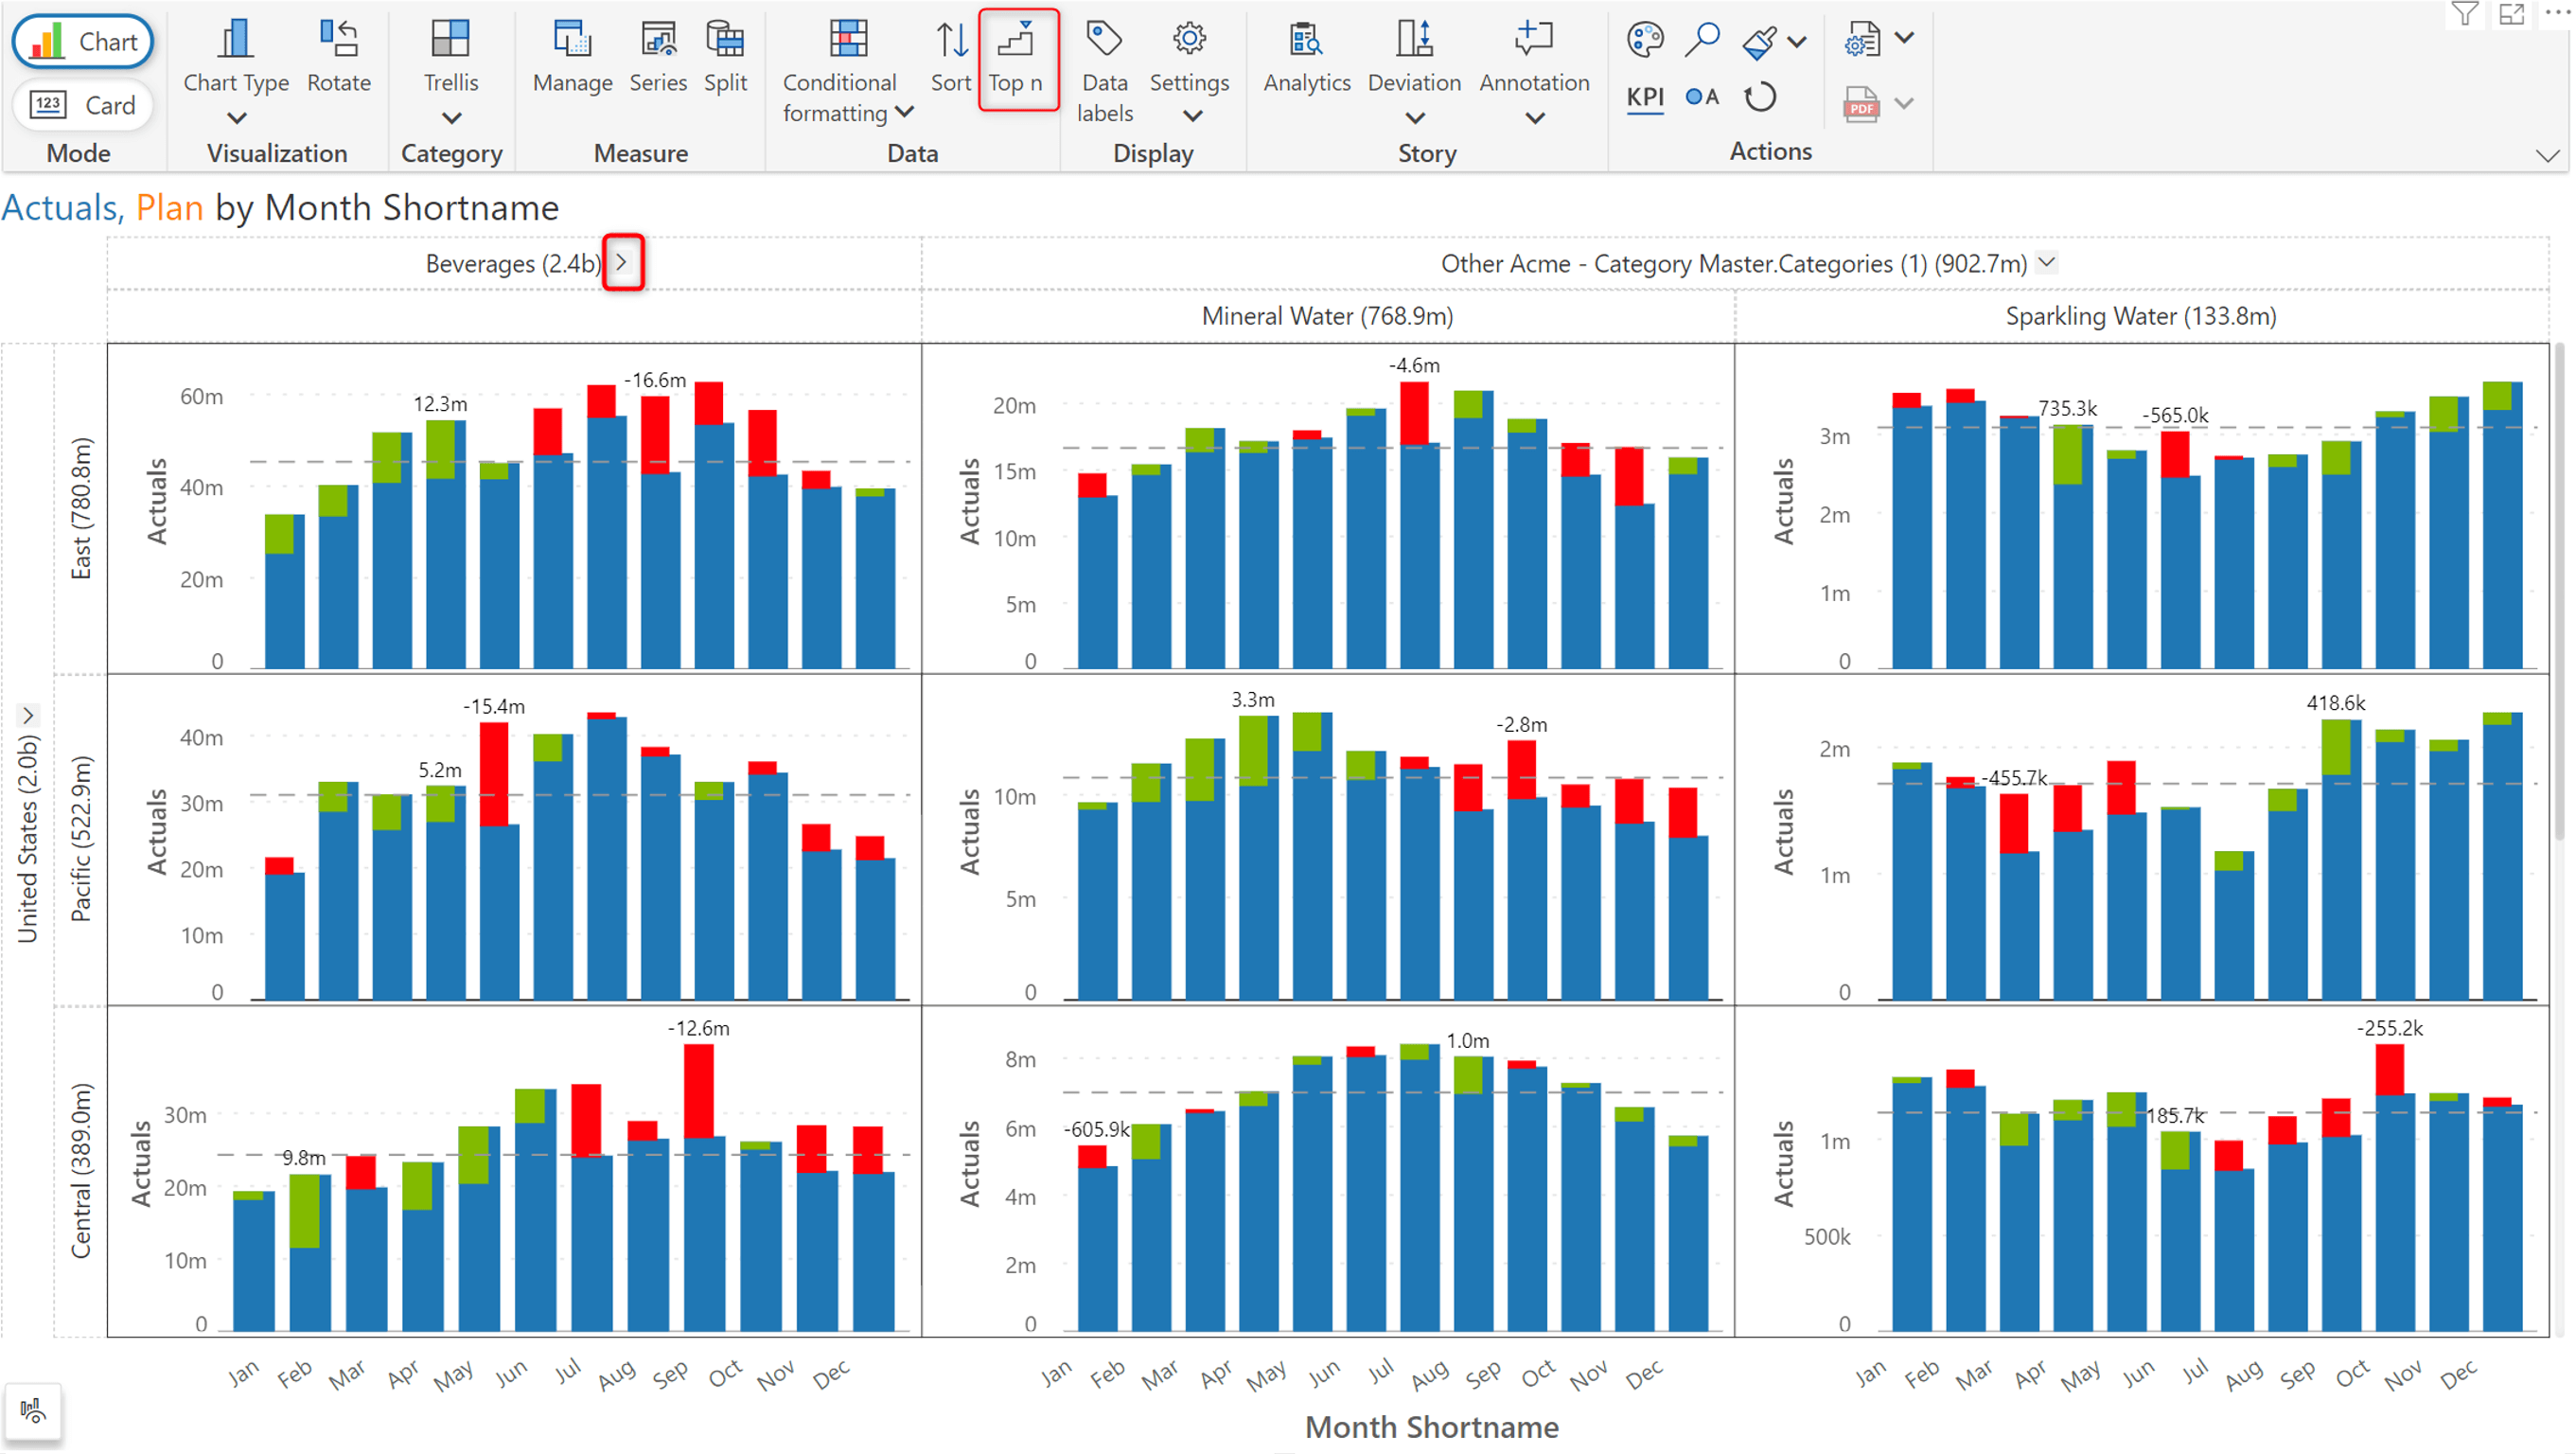
Inforiver 3.1. allows you to add perspective to the category titles by appending the total or average values. You can also choose to display only the category name.
Expand/collapse for Top N ranking
You can now expand or collapse hierarchical charts even when applying Top N + Others rules.
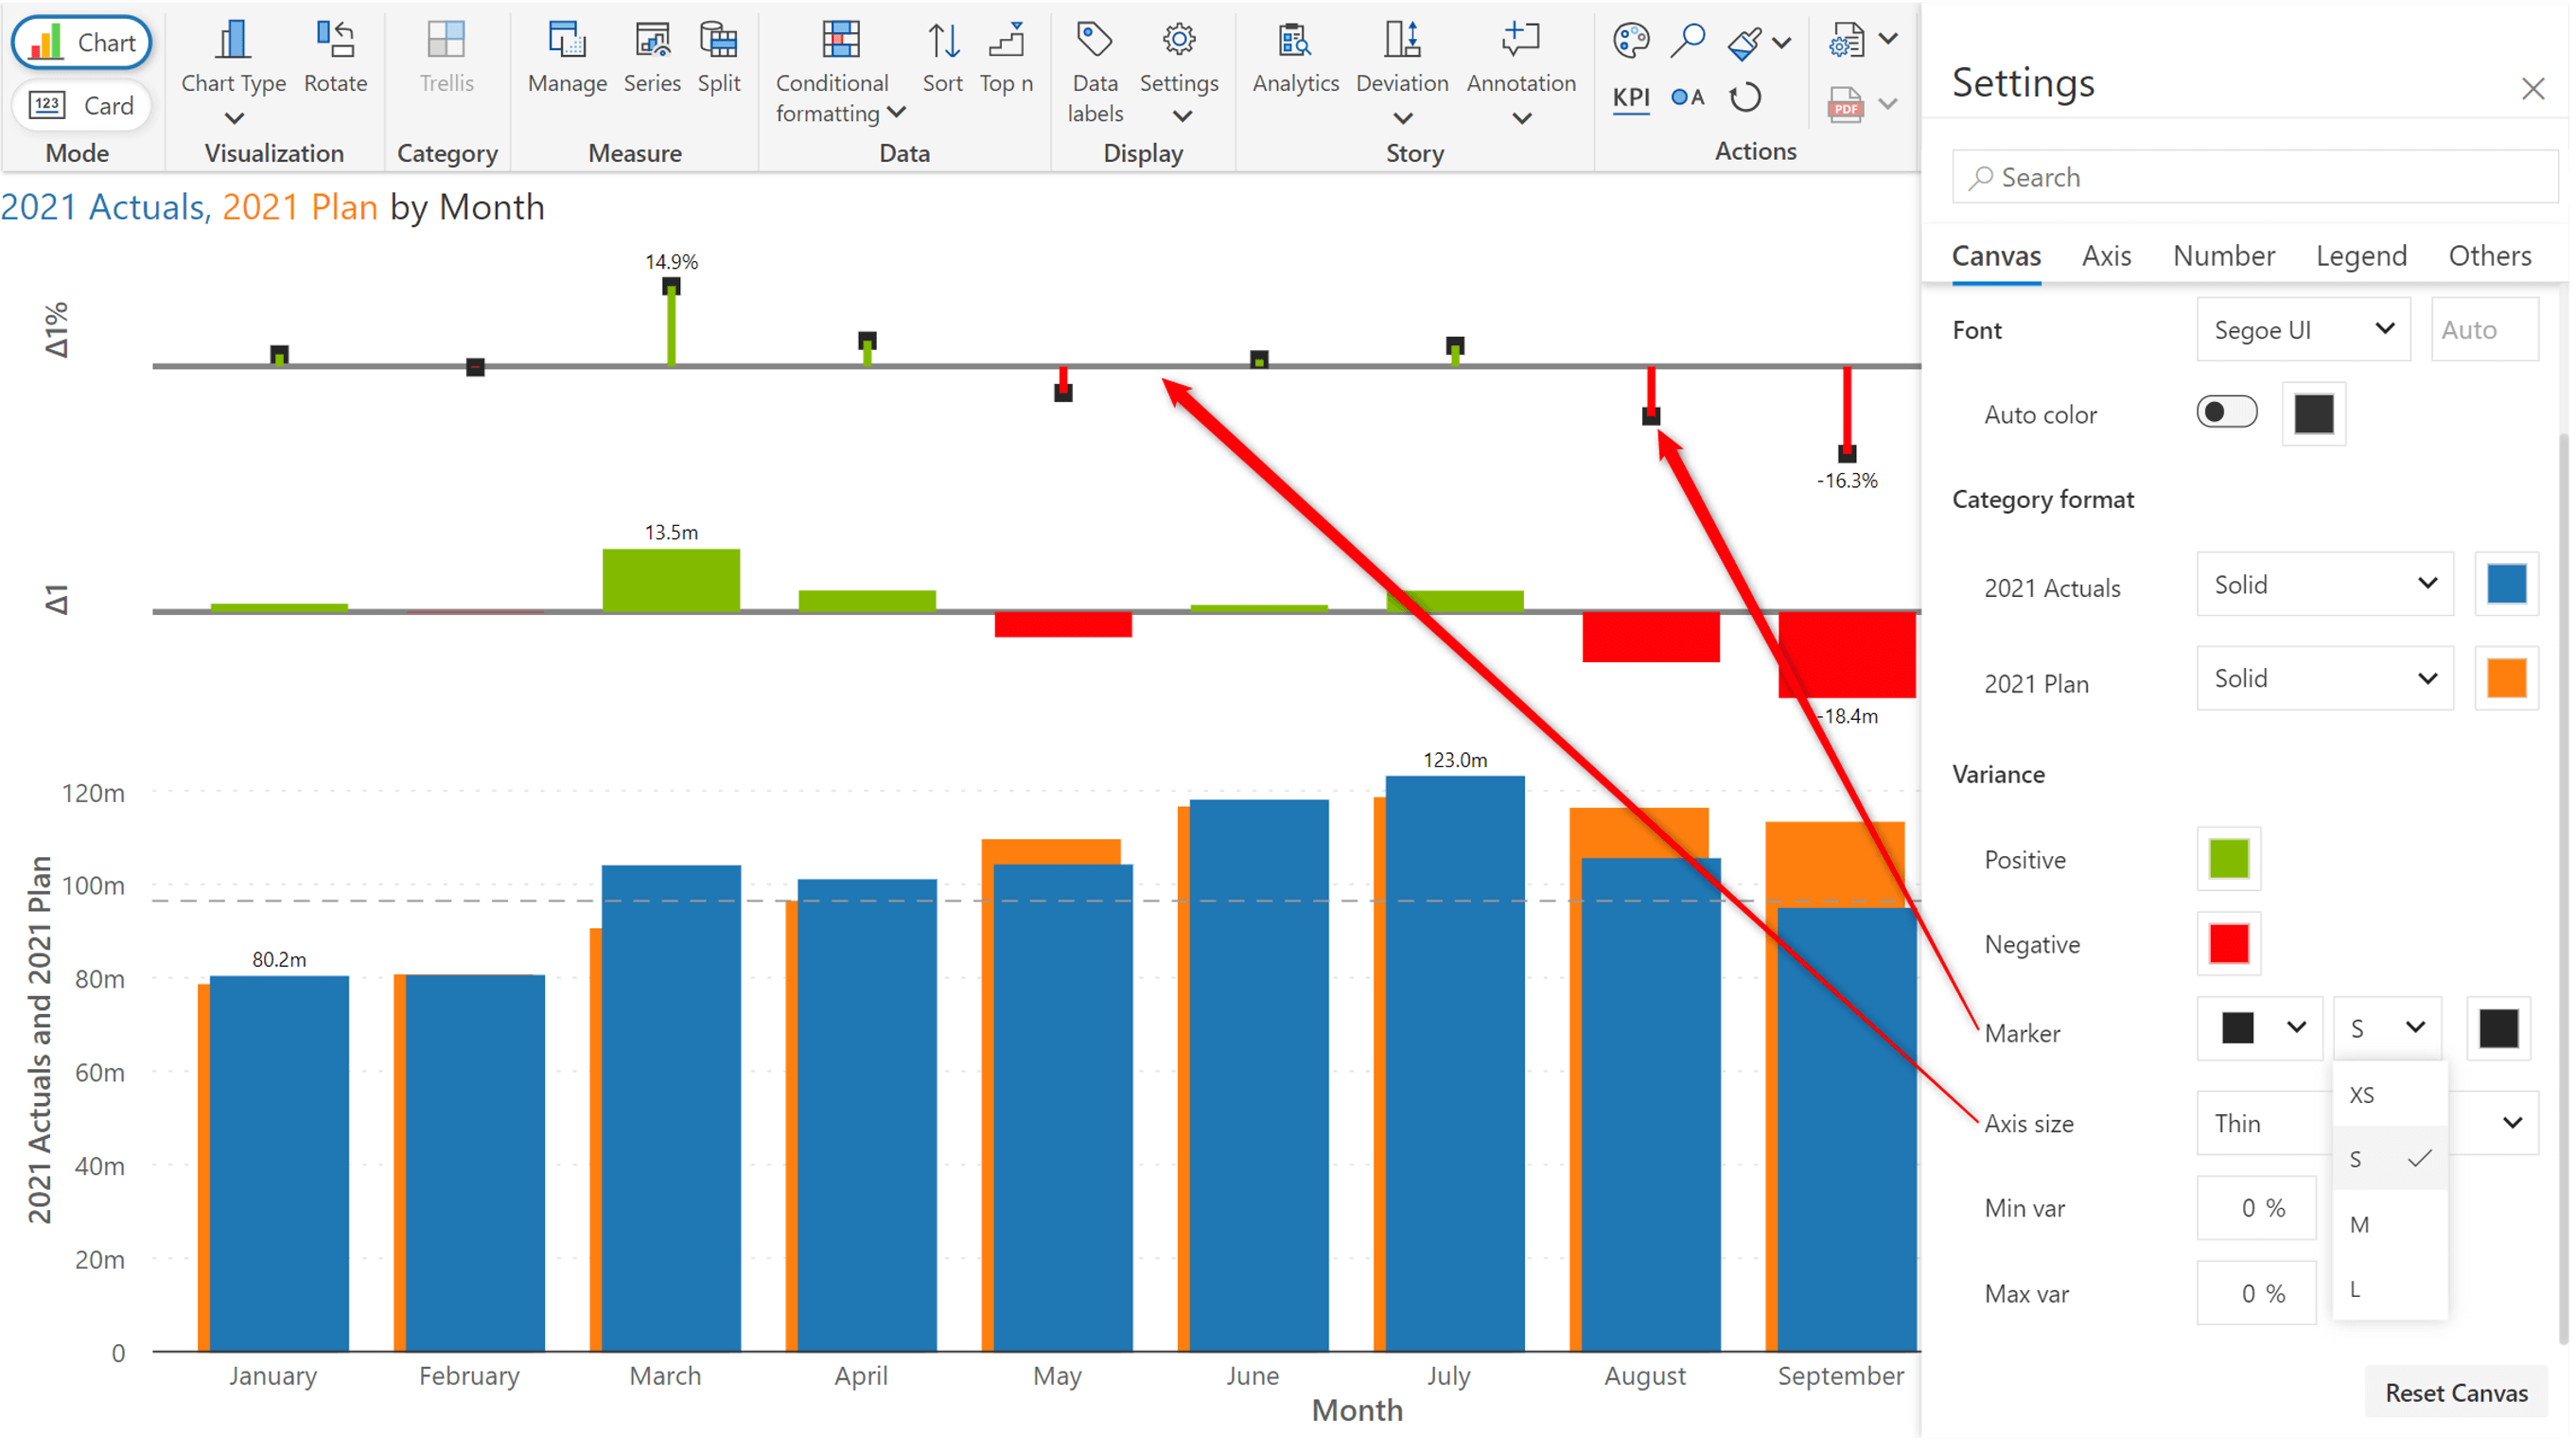
When your report requires variance and variance percentage, Inforiver Analytics+ 3.1. allows you to set the size of the marker and semantic axis.
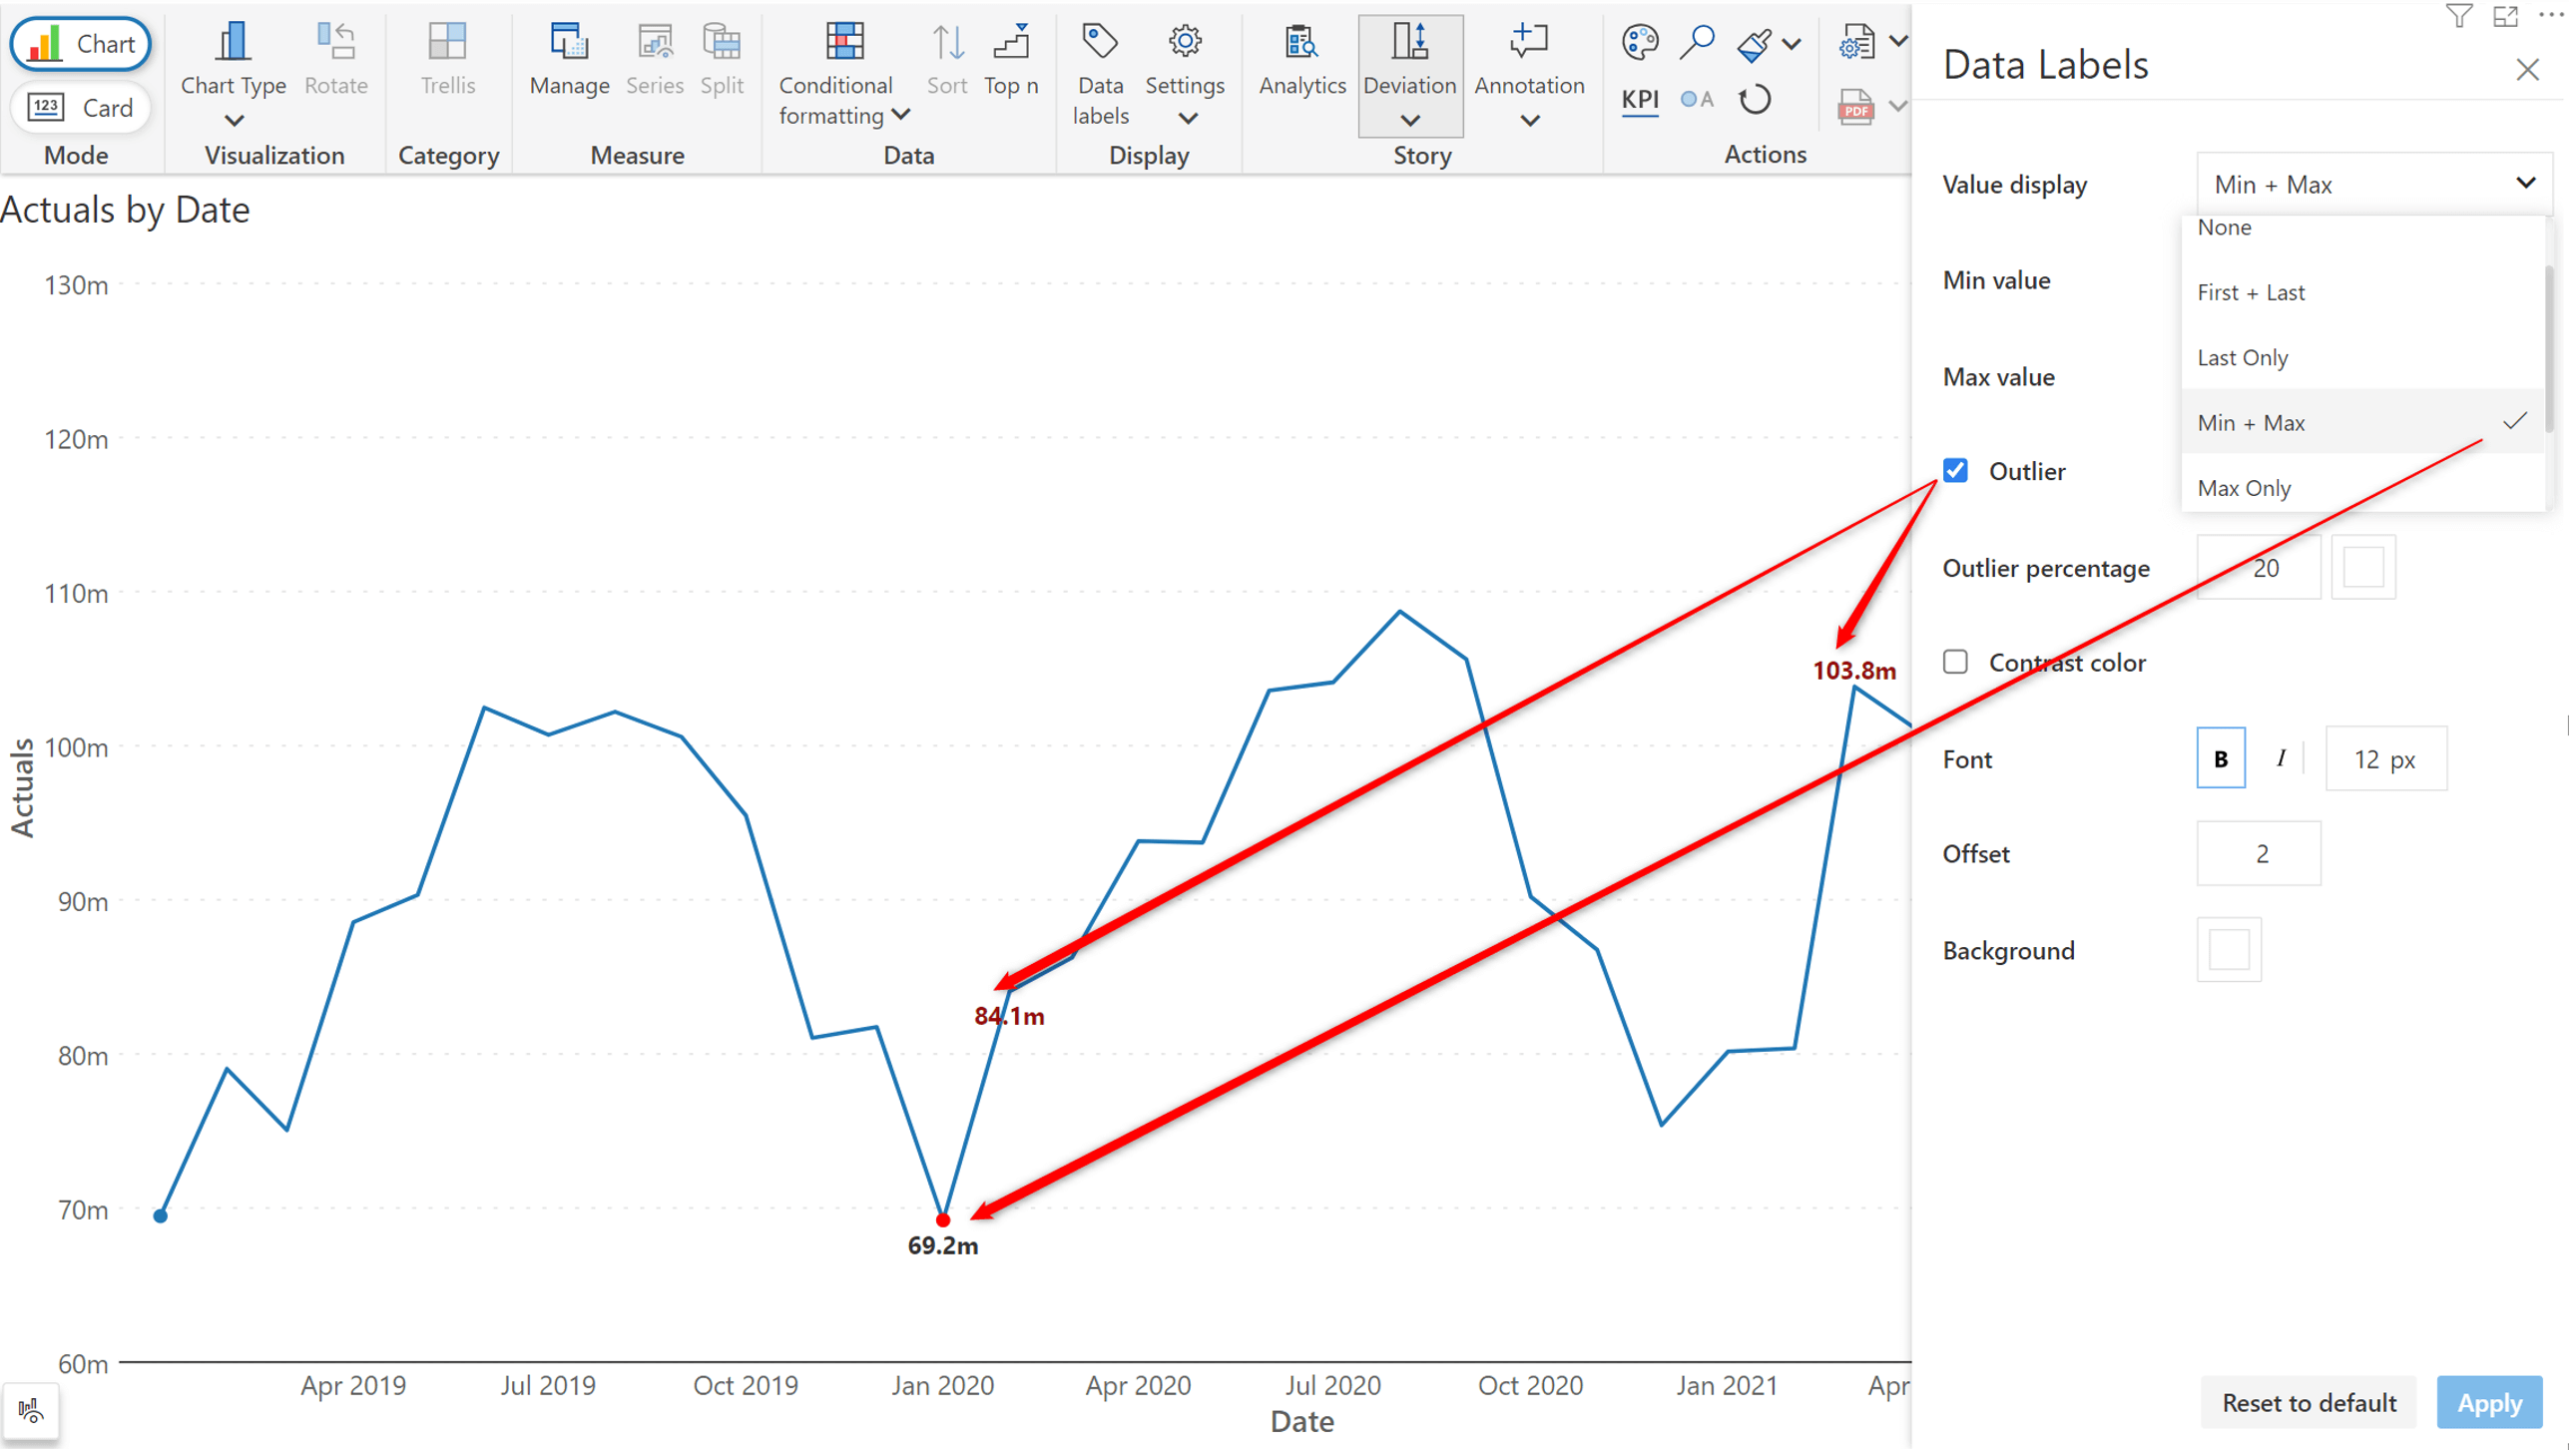
You can now explicitly show the outliers along with other data points.
When you enter comments, the visual is not aware of the context - which can be set by a filter or a slicer in the report. In the image below, notice how the comment for ‘Consumer’ segment is still visible even after the segment has been changed to ‘Corporate’.
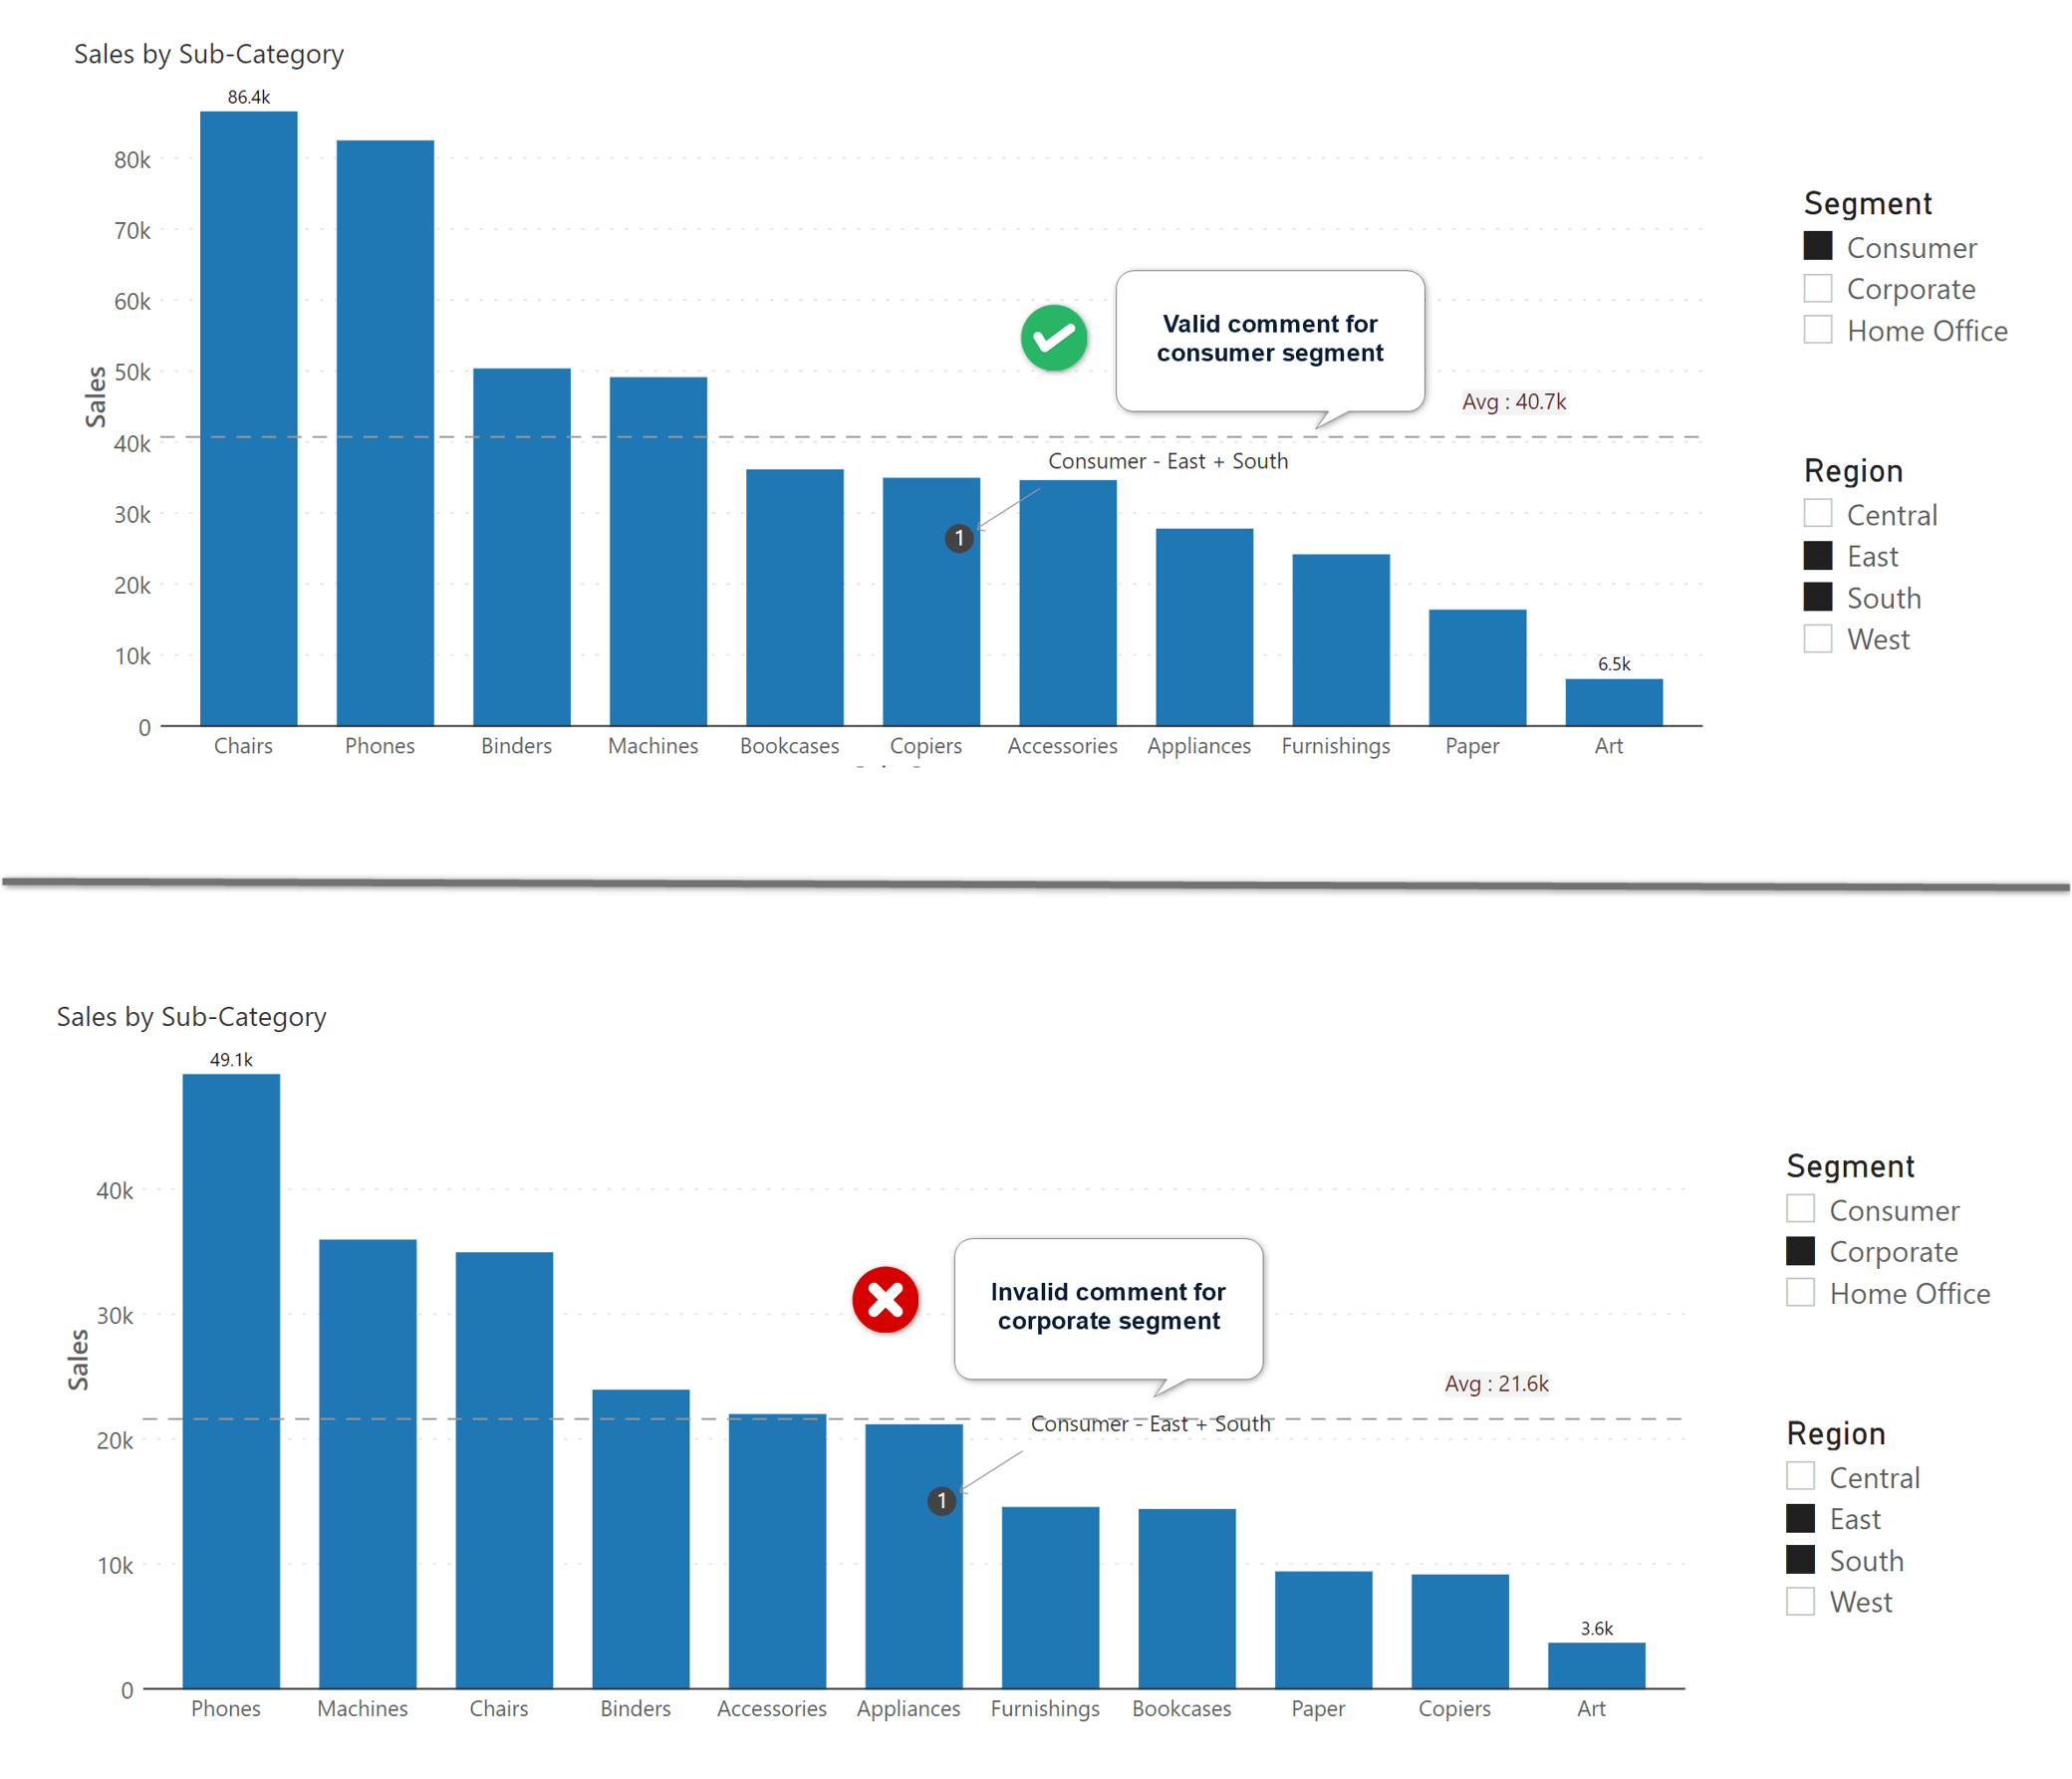
With the Inforiver Analytics+ 3.1. release, you can implement context-aware commenting in your Power BI reports in a few clicks. As you apply filters, the comments will change dynamically. Follow the steps below to configure filter-context measures in Inforiver.
Learn how to implement true, dynamic commentary in Inforiver Matrix that respond to the context set by filters/slicers here.
There are two ways to do this. One is to write the DAX measure yourself. The second way is to let Inforiver automatically generate the DAX script for you to use.
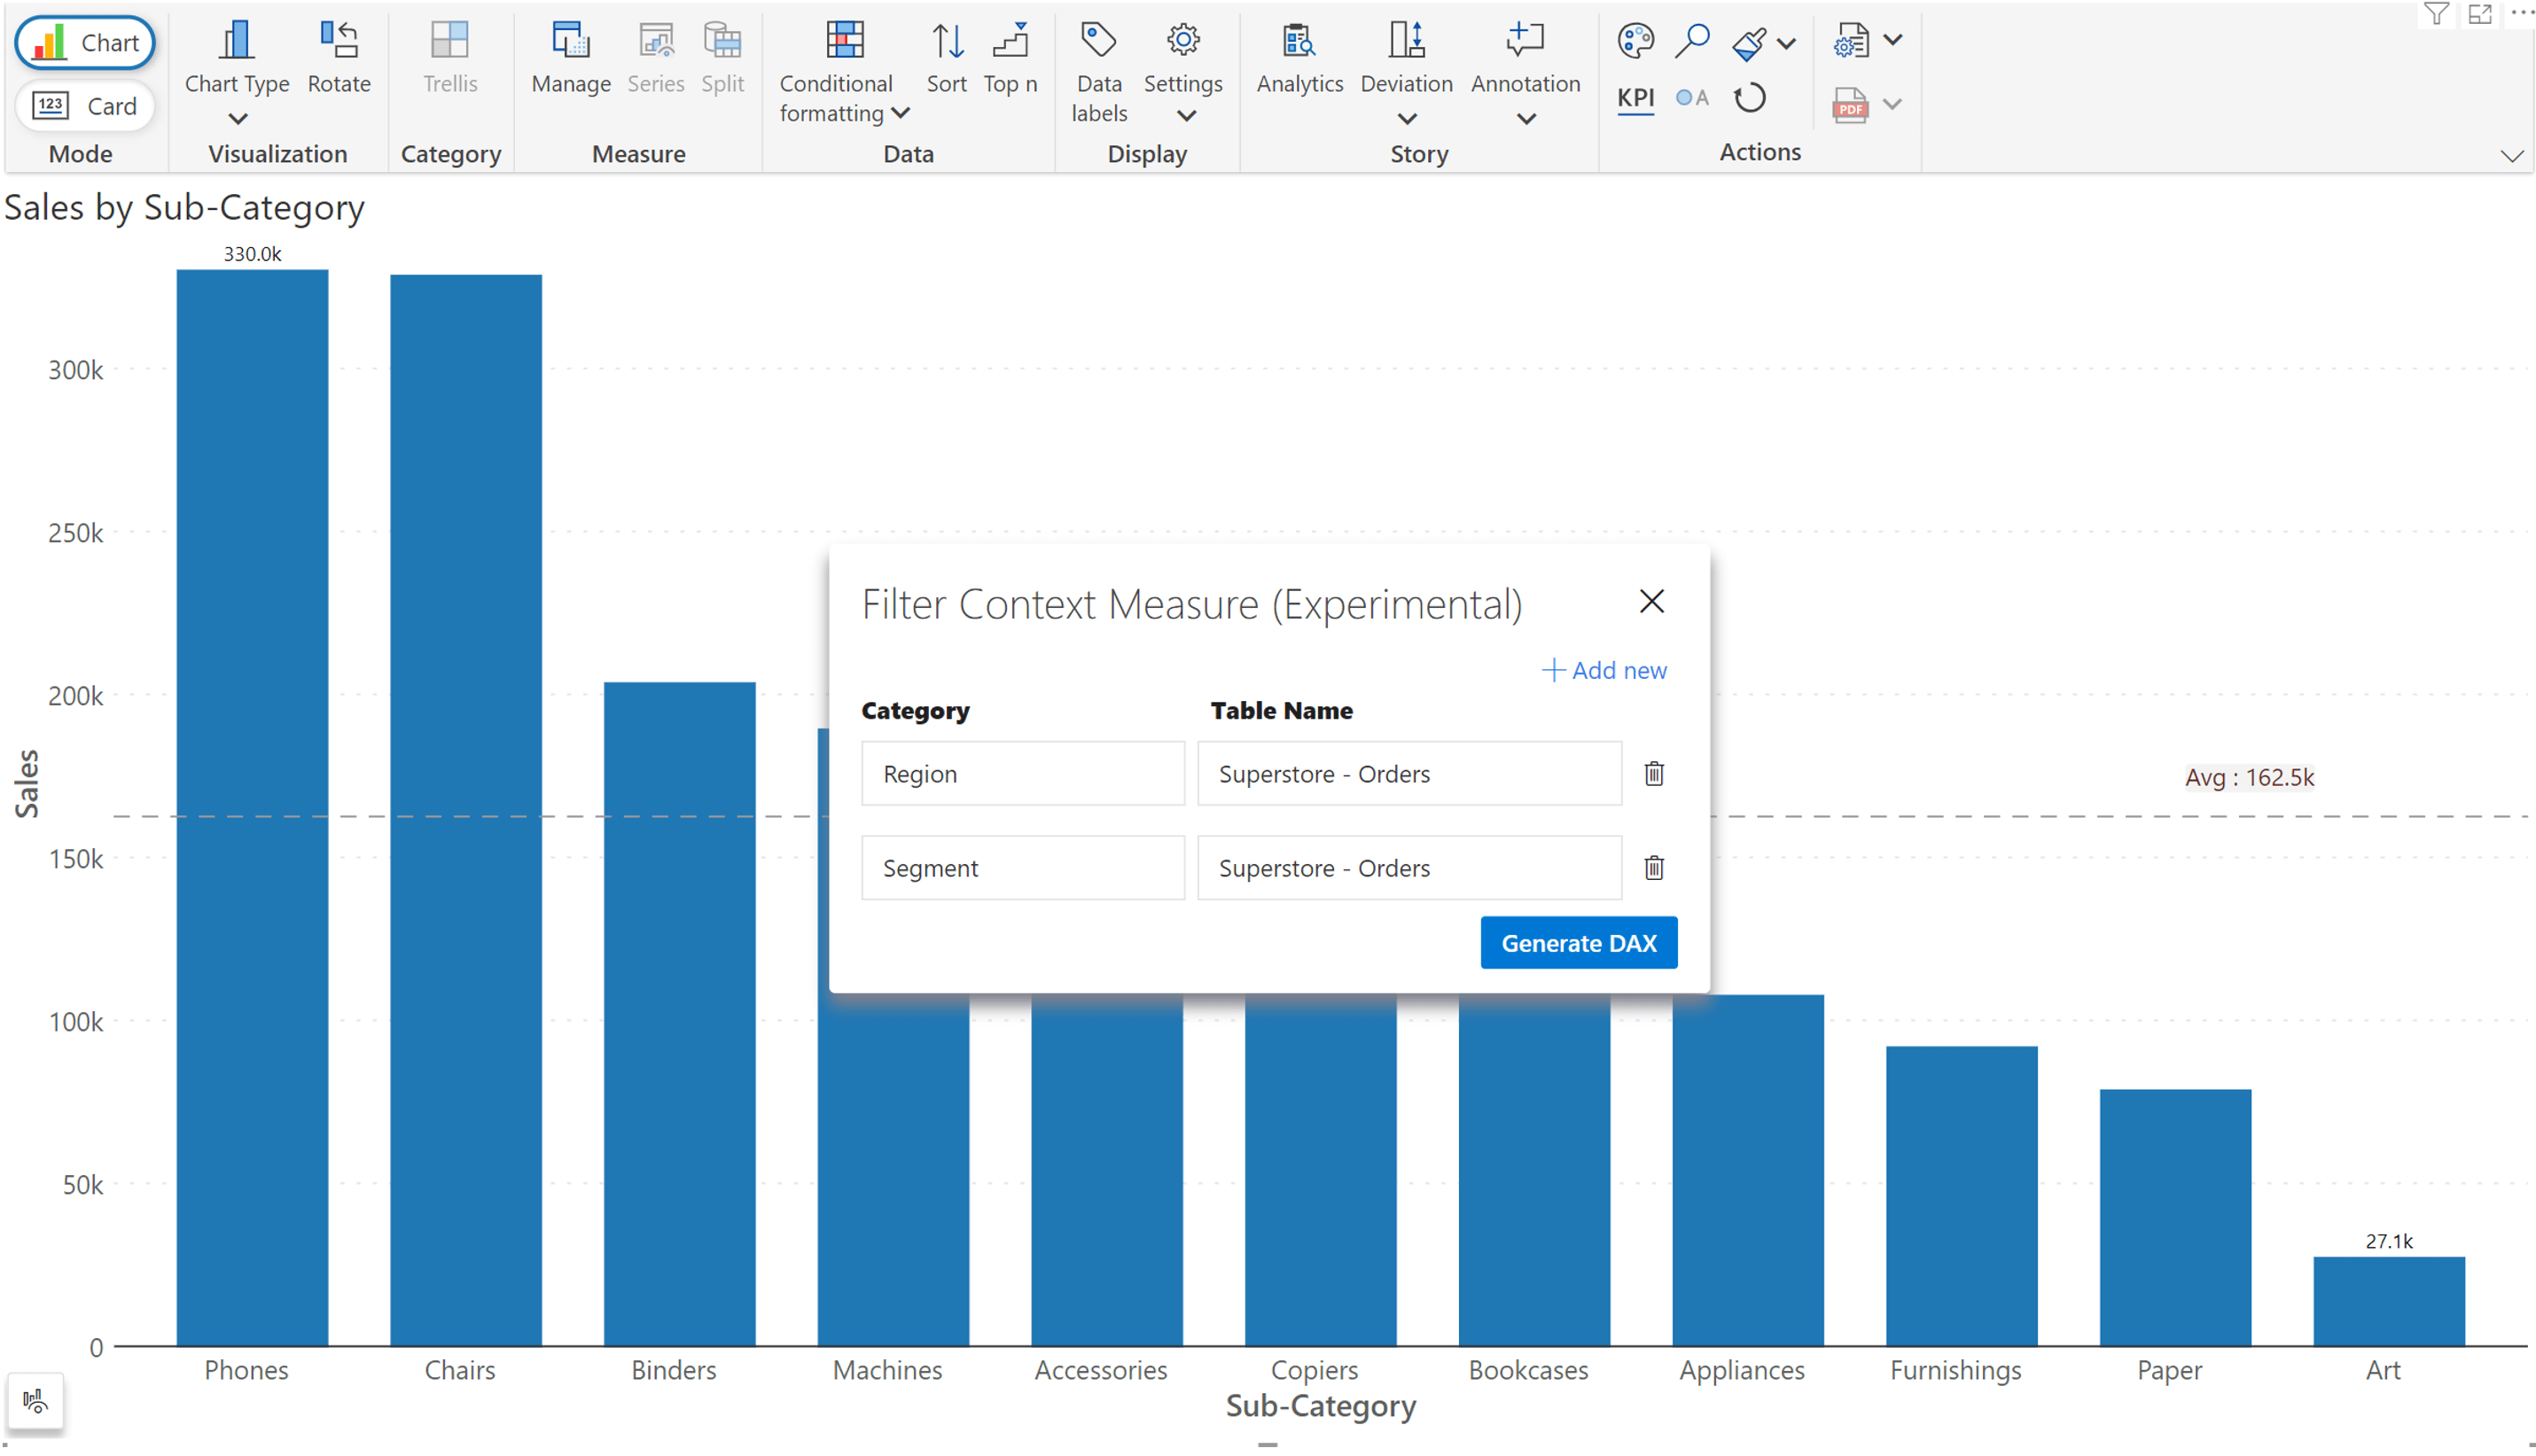
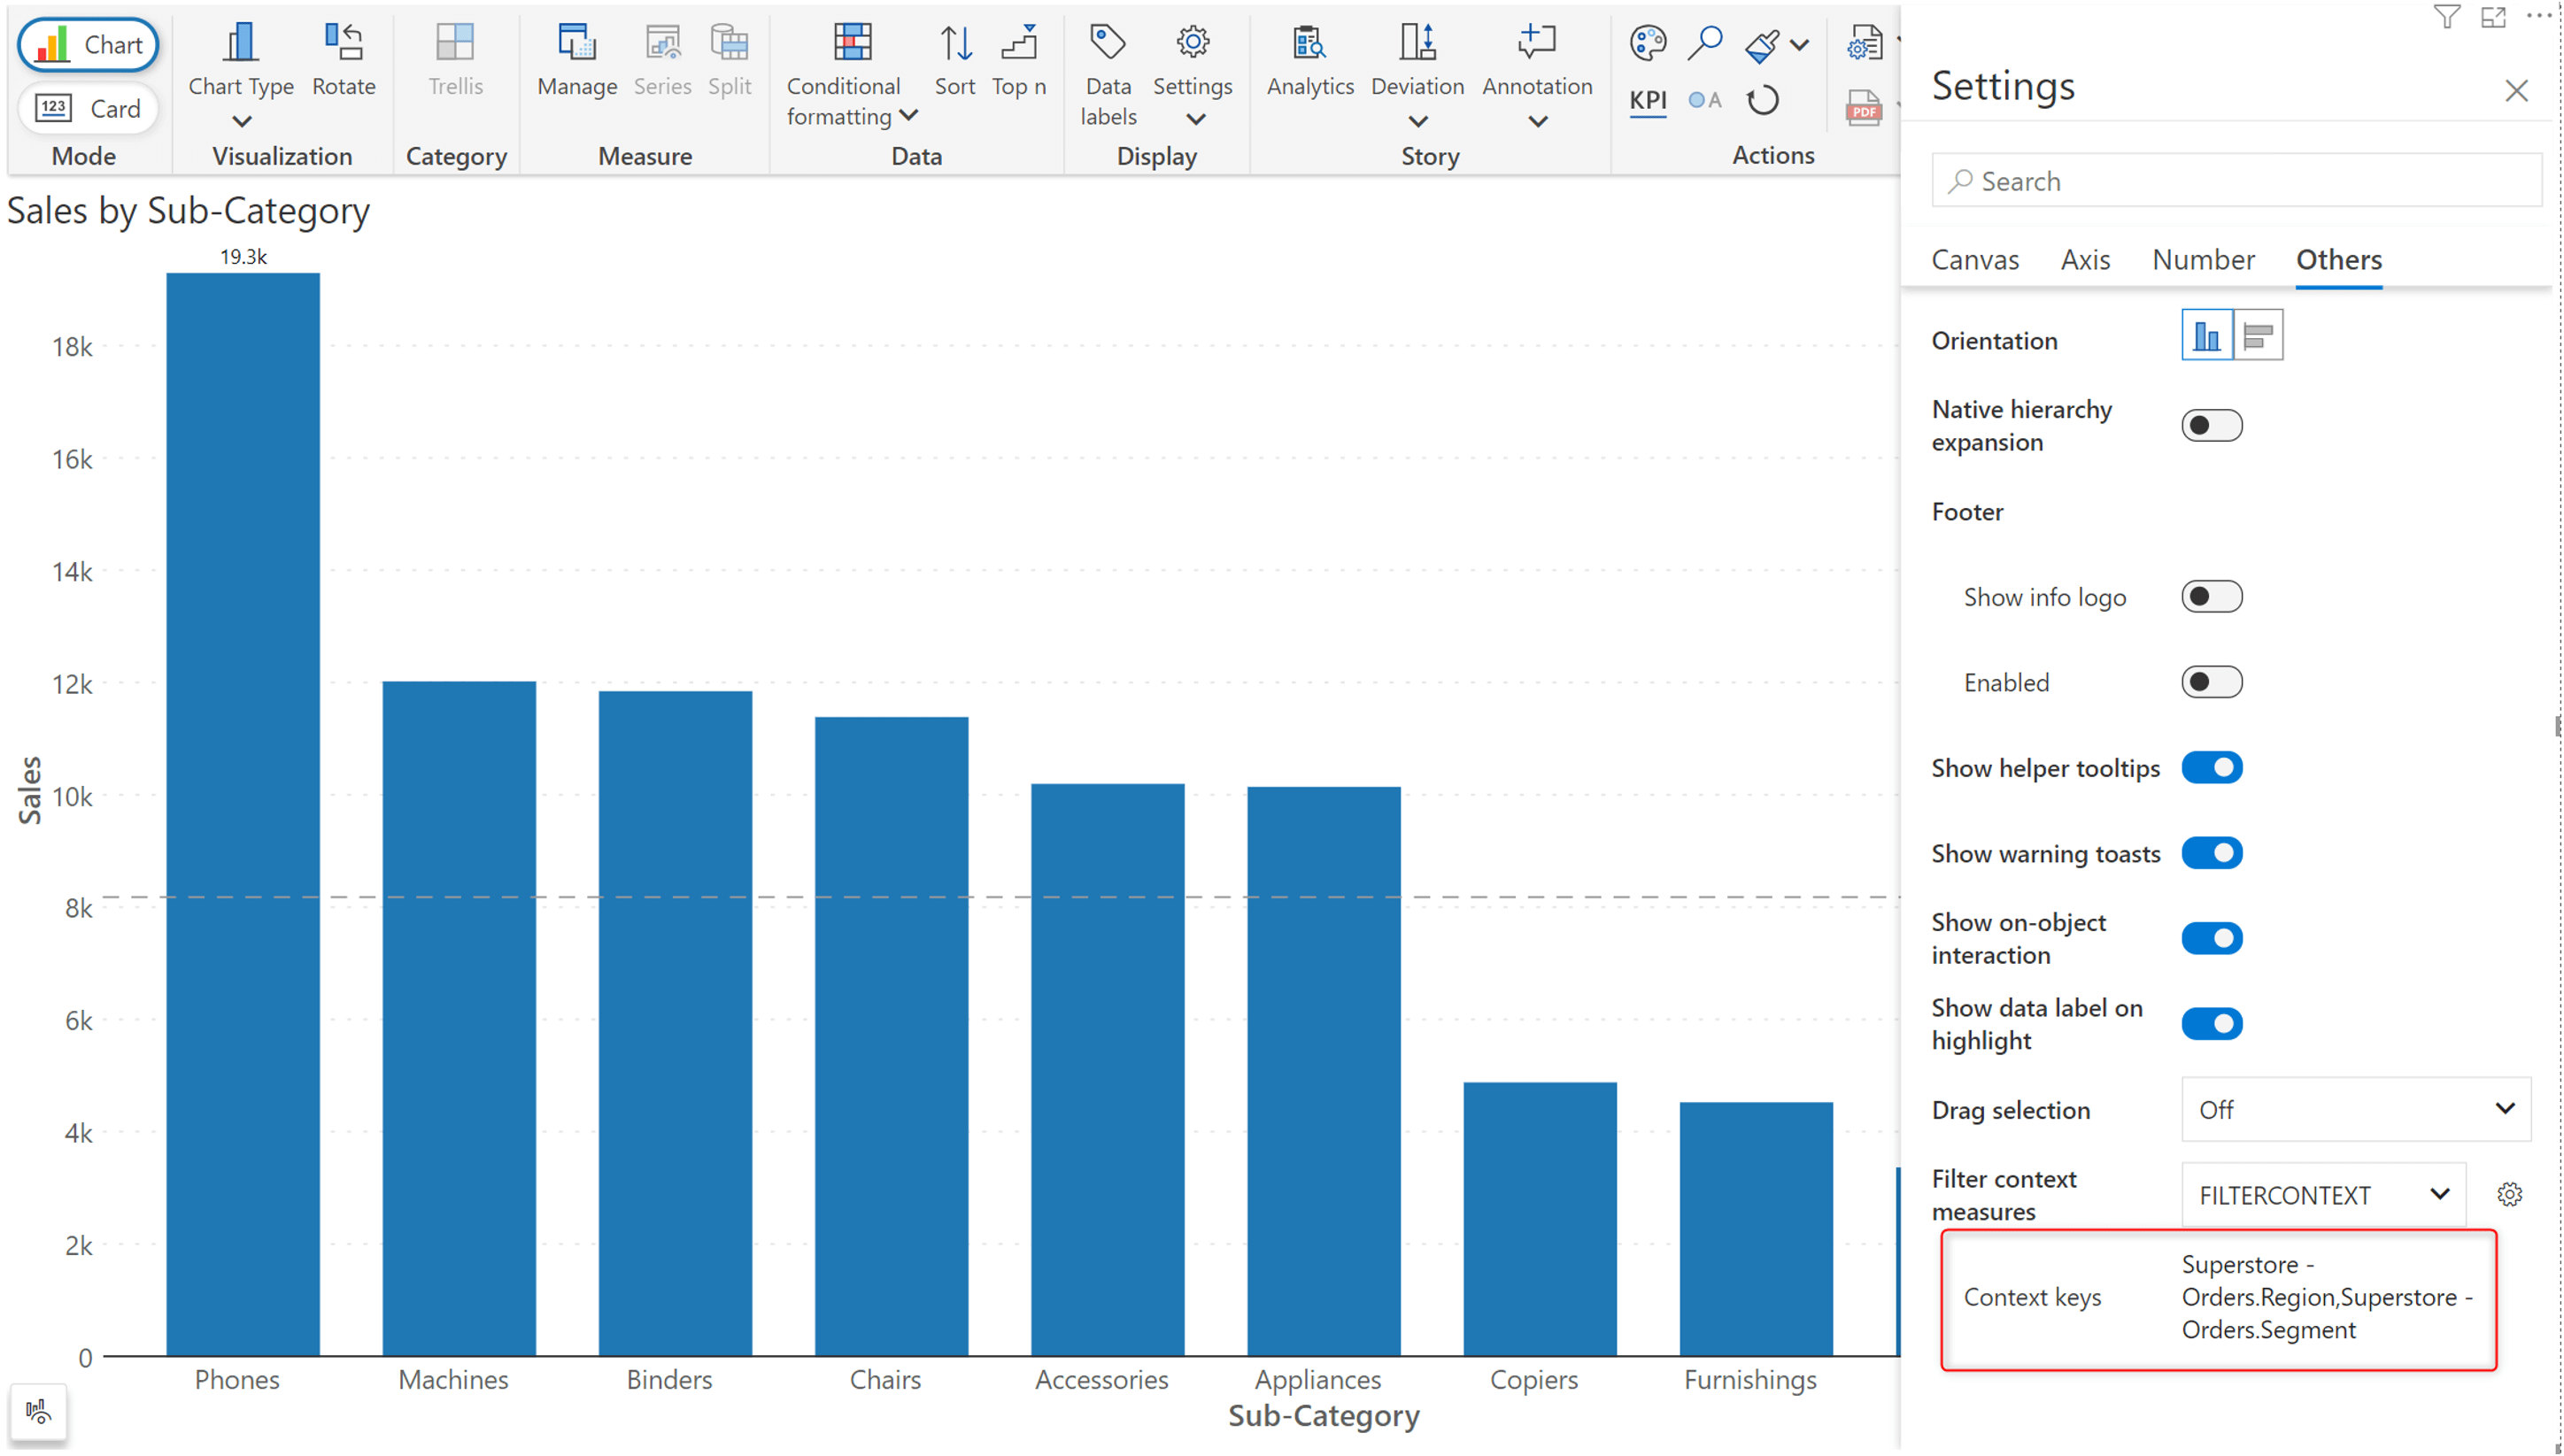
a. After creating your chart, navigate to Settings > Others. Click on the gear icon near the Filter context measures property.

b. Enter the filter categories for which you want to capture the context. You need to provide both the category name and the corresponding table name from the data model. Click on the Generate DAX button.
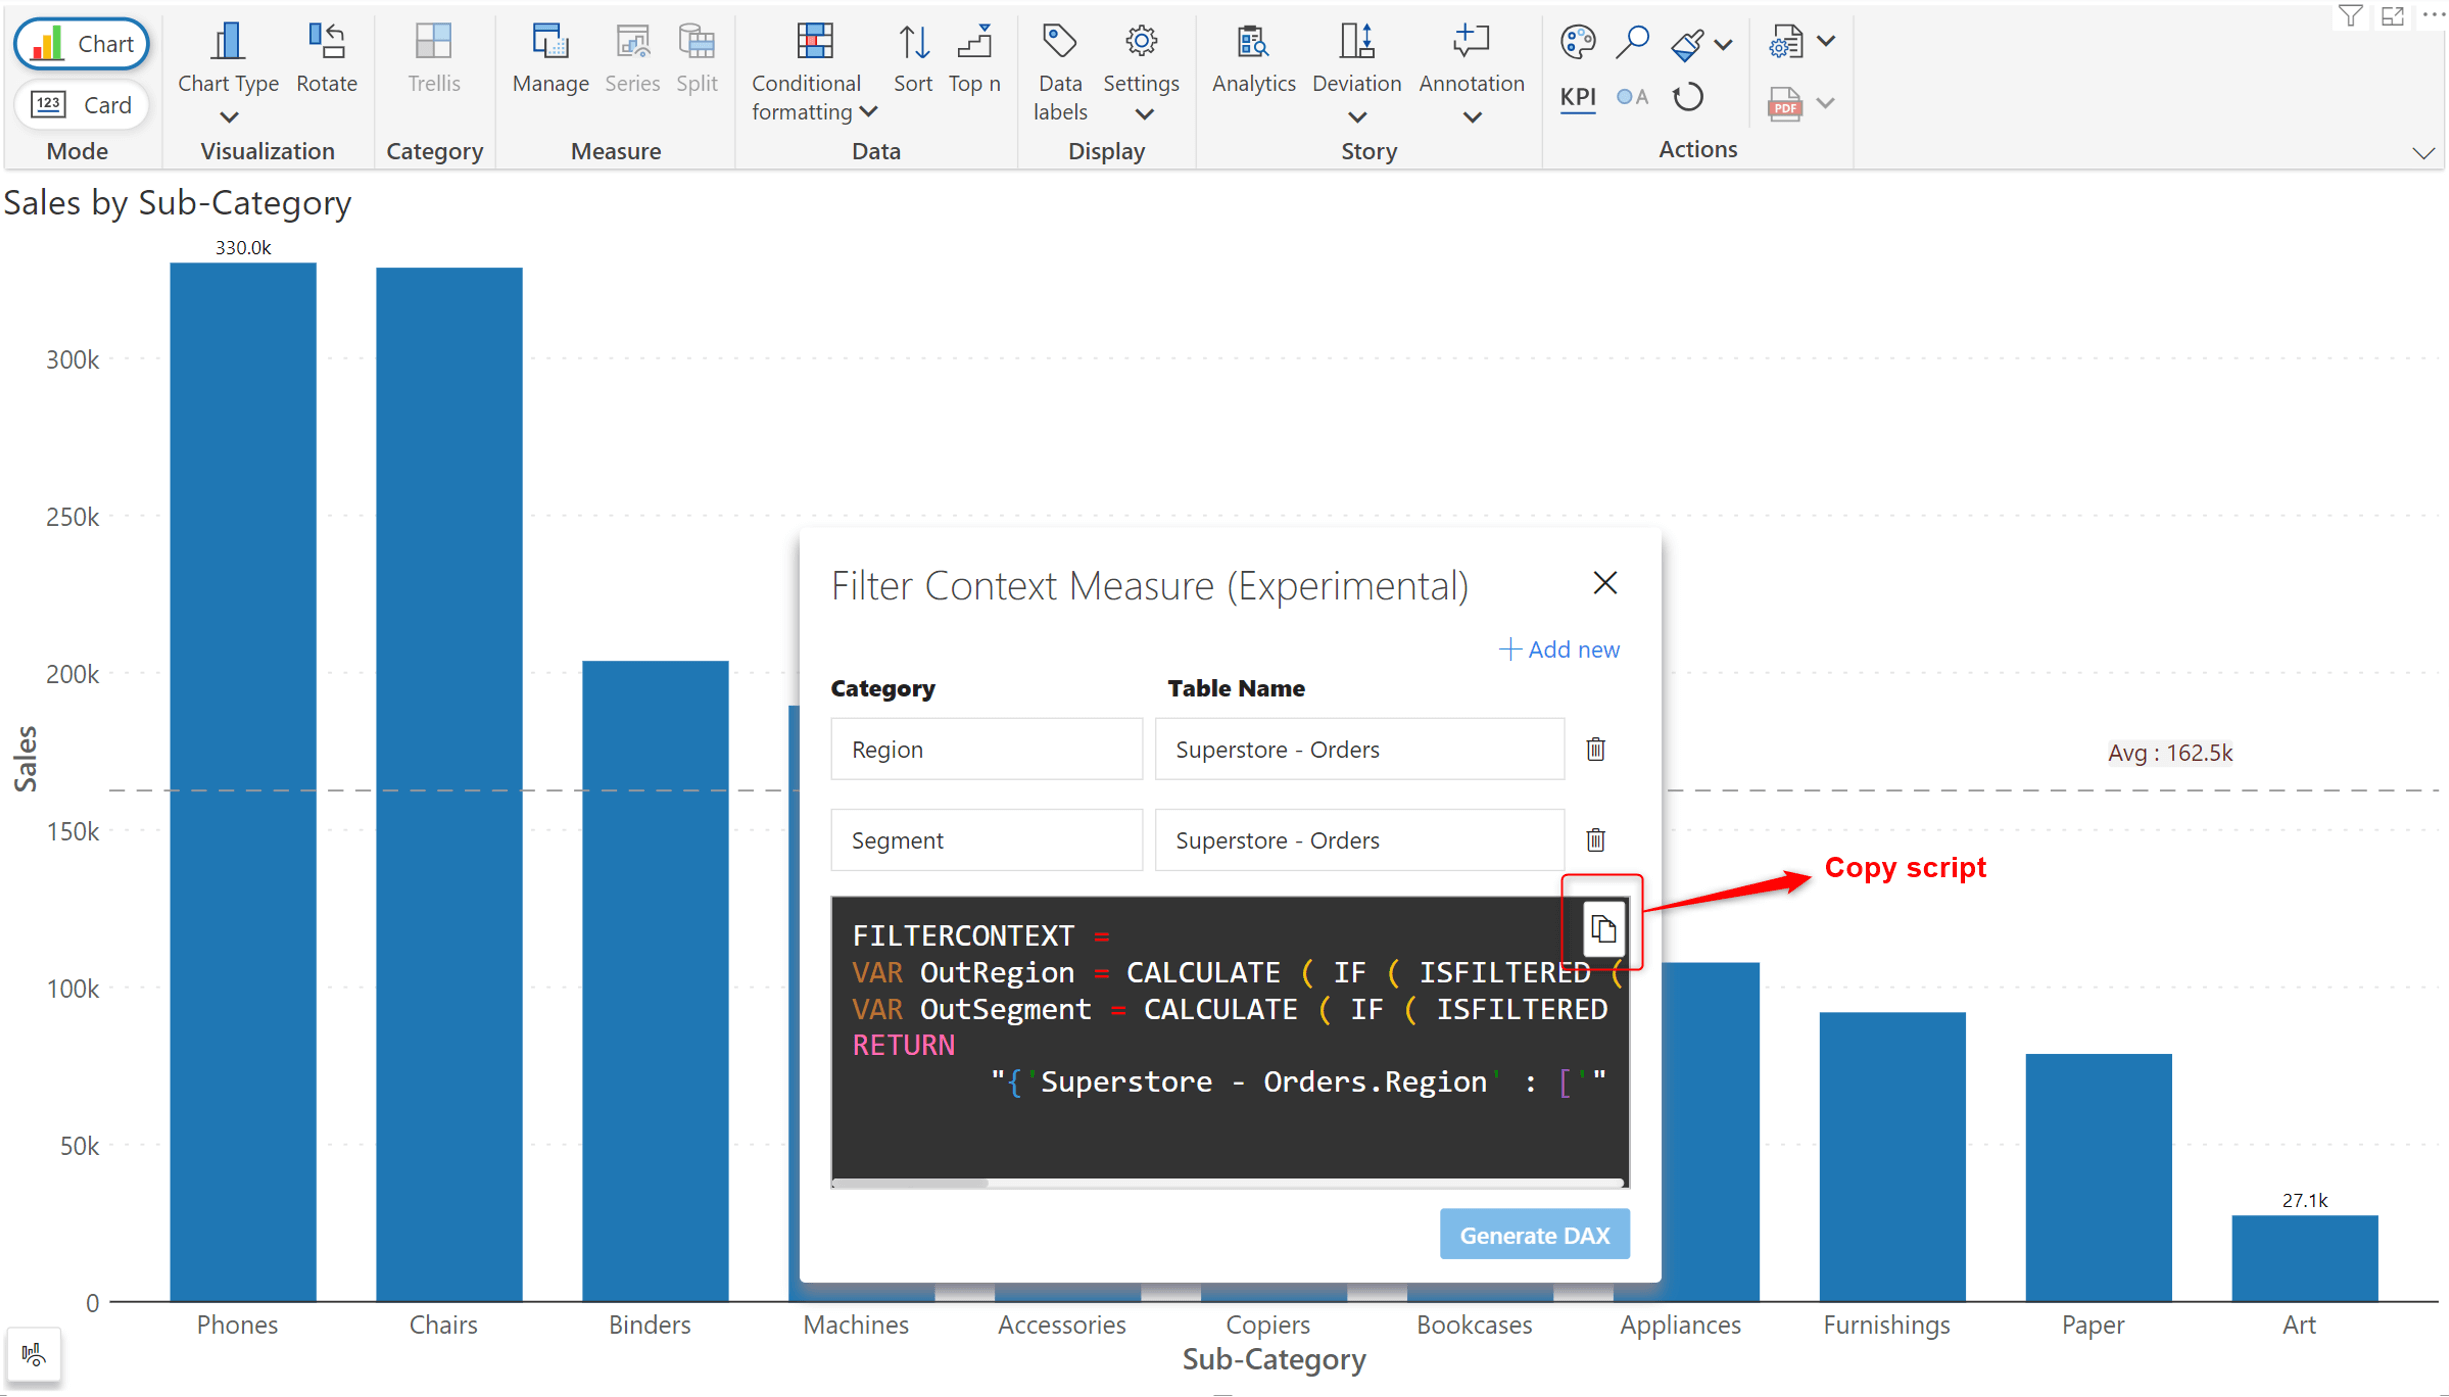
c. Inforiver will generate the script that you can copy (using the copy icon).
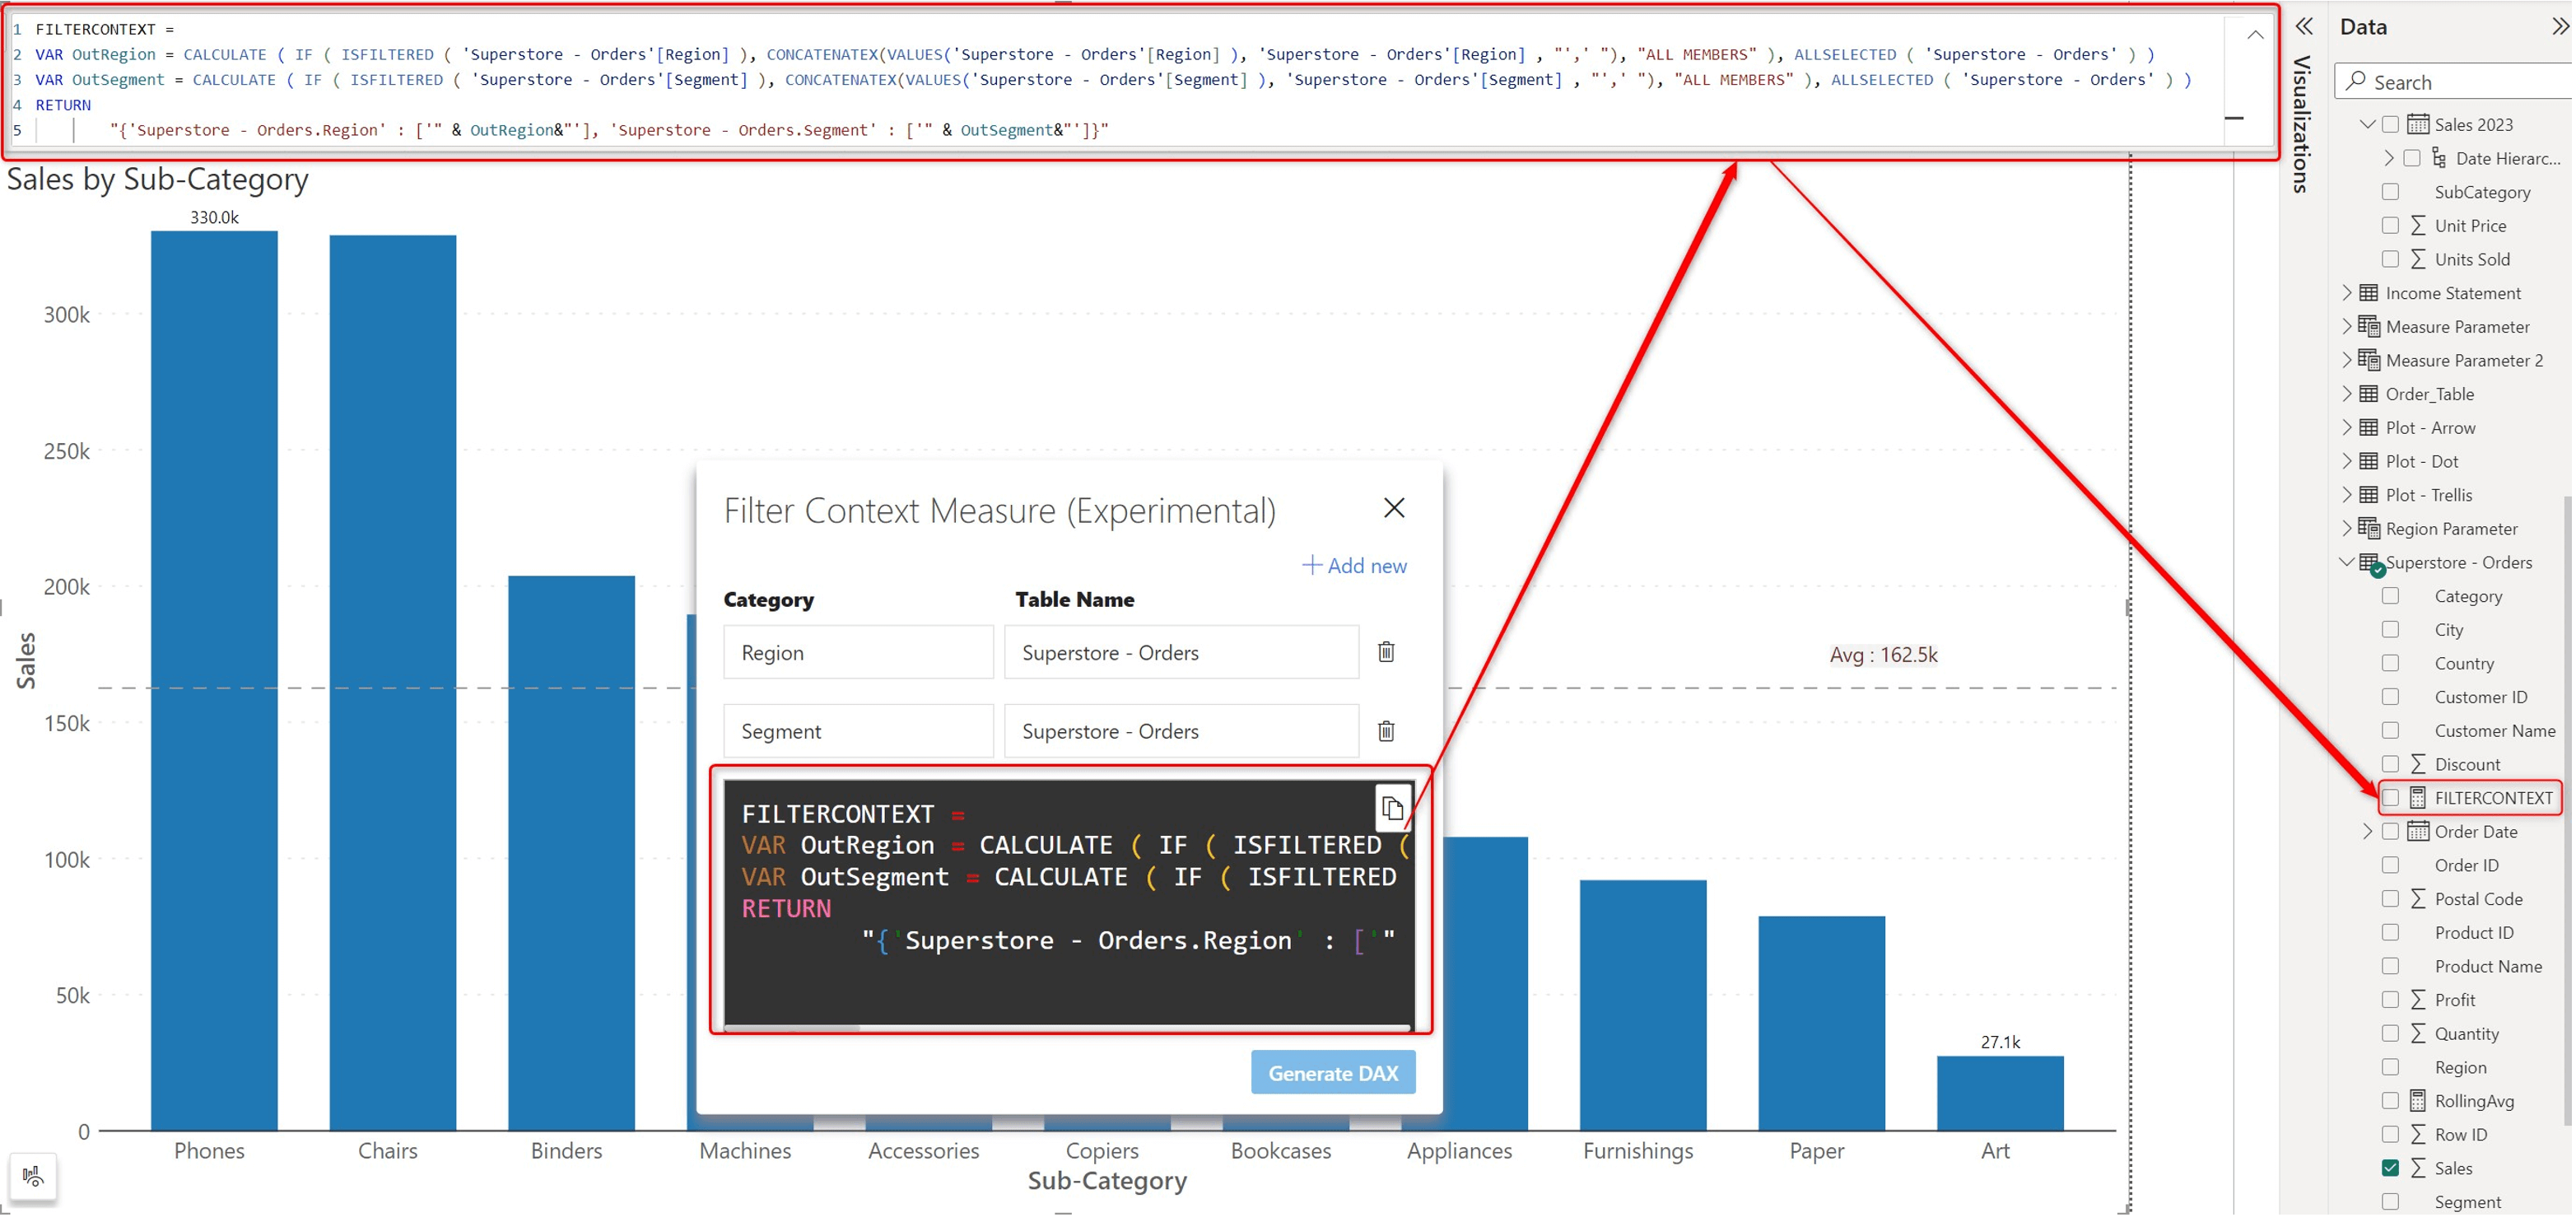
d. Create the filter context measure using the script.
Add the measure we created above to the ‘Text Categories’ field. Navigate to Settings > Others. You will be able to select the filter context measure from the dropdown menu.
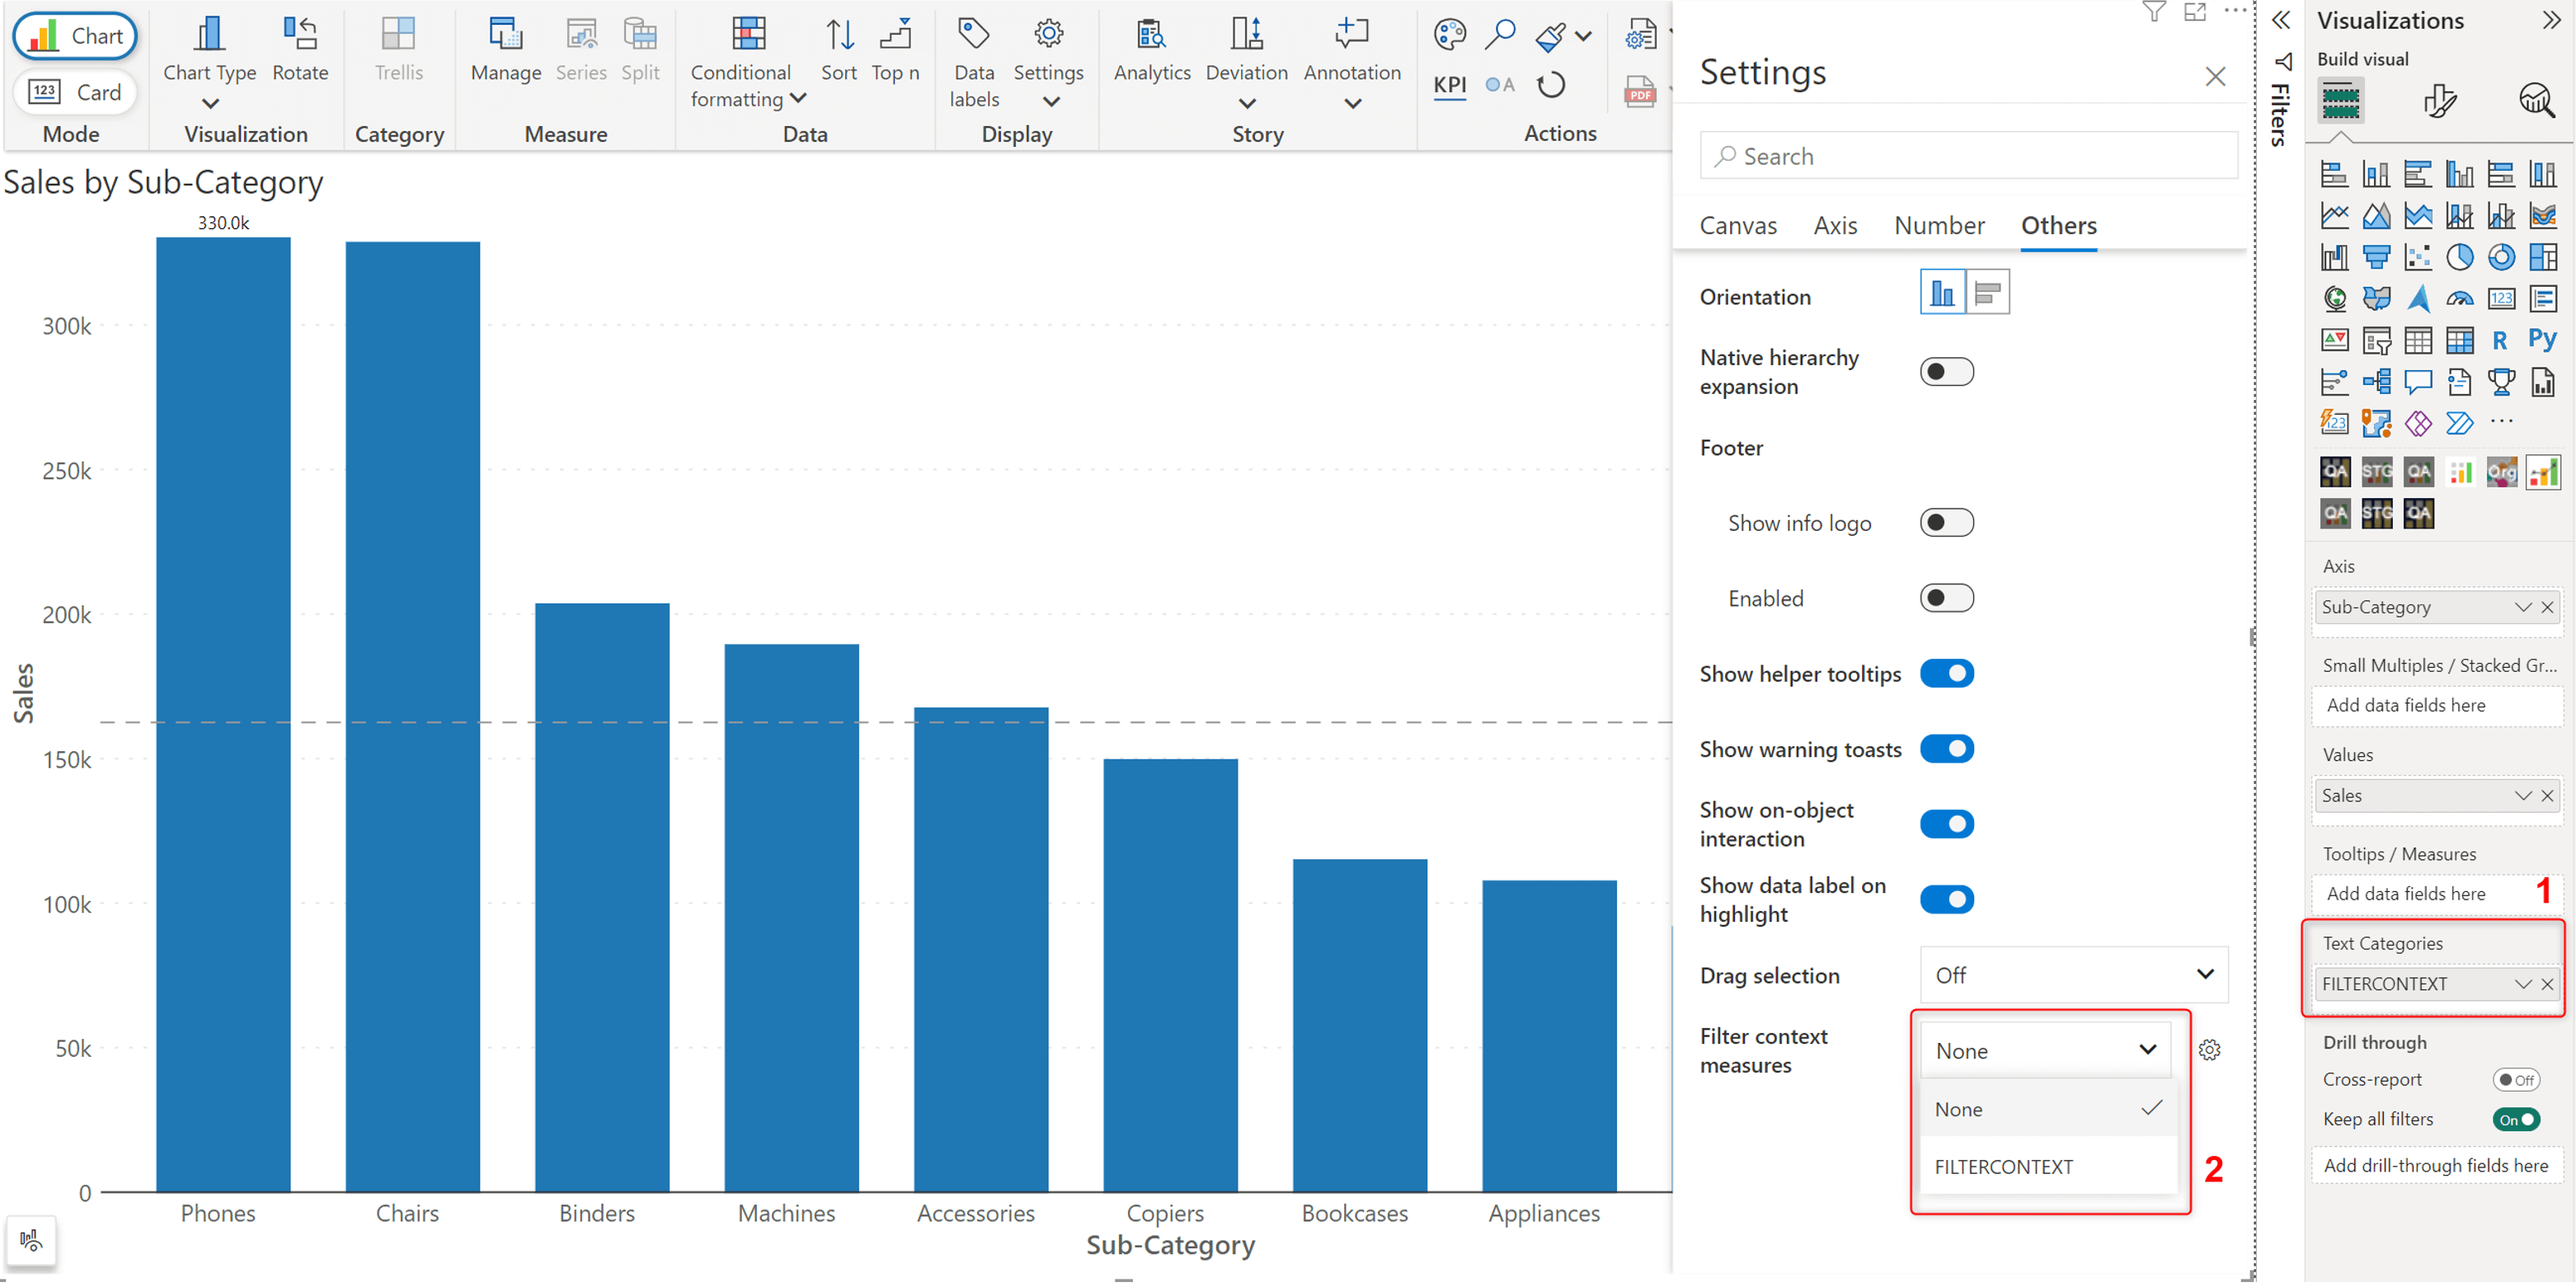
With the above steps, Inforiver will be aware of the filter context. All your annotations will now be tied to this context and updated in response to context changes. Note that this is a beta feature.
We'd love to hear your ideas for Inforiver – be it a cool new feature or an improvement on existing features. Visit the Inforiver Community to share your ideas, vote on other submissions, and interact with other users.
*Inforiver Charts has been renamed to Inforiver Analytics+, a 3-in-1 visual for dashboards and storyboards. It offers 50+ charts, cards, and tables.

Inforiver helps enterprises consolidate planning, reporting & analytics on a single platform (Power BI). The no-code, self-service award-winning platform has been recognized as the industry’s best and is adopted by many Fortune 100 firms.
Inforiver is a product of Lumel, the #1 Power BI AppSource Partner. The firm serves over 3,000 customers worldwide through its portfolio of products offered under the brands Inforiver, EDITable, ValQ, and xViz.