
Upcoming webinar on 'Inforiver Charts : The fastest way to deliver stories in Power BI', Aug 29th , Monday, 10.30 AM CST. Register Now
Upcoming webinar on 'Inforiver Charts : The fastest way to deliver stories in Power BI', Aug 29th , Monday, 10.30 AM CST. Register Now
Welcome to the December update for Analytics+! The 3.3. version ships with exciting new features like insight charts and includes enhancements across context awareness, measure grouping, and waterfall charts, as well as additional customizations for KPIs and data tables.
Feel welcome to explore the sections that interest you!
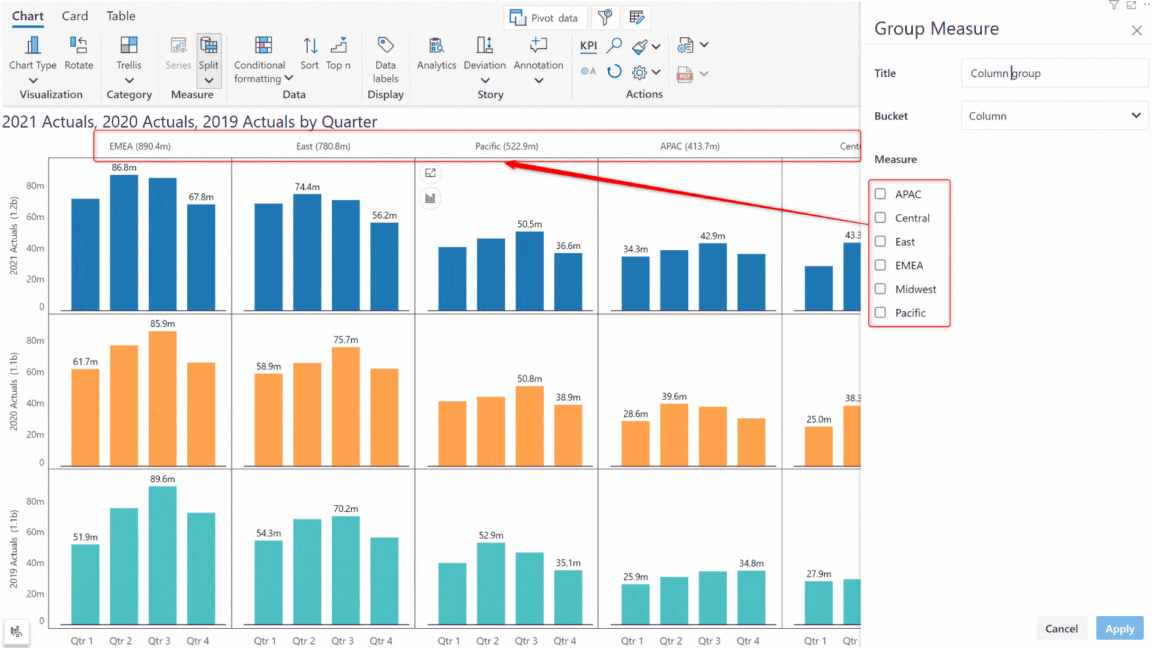
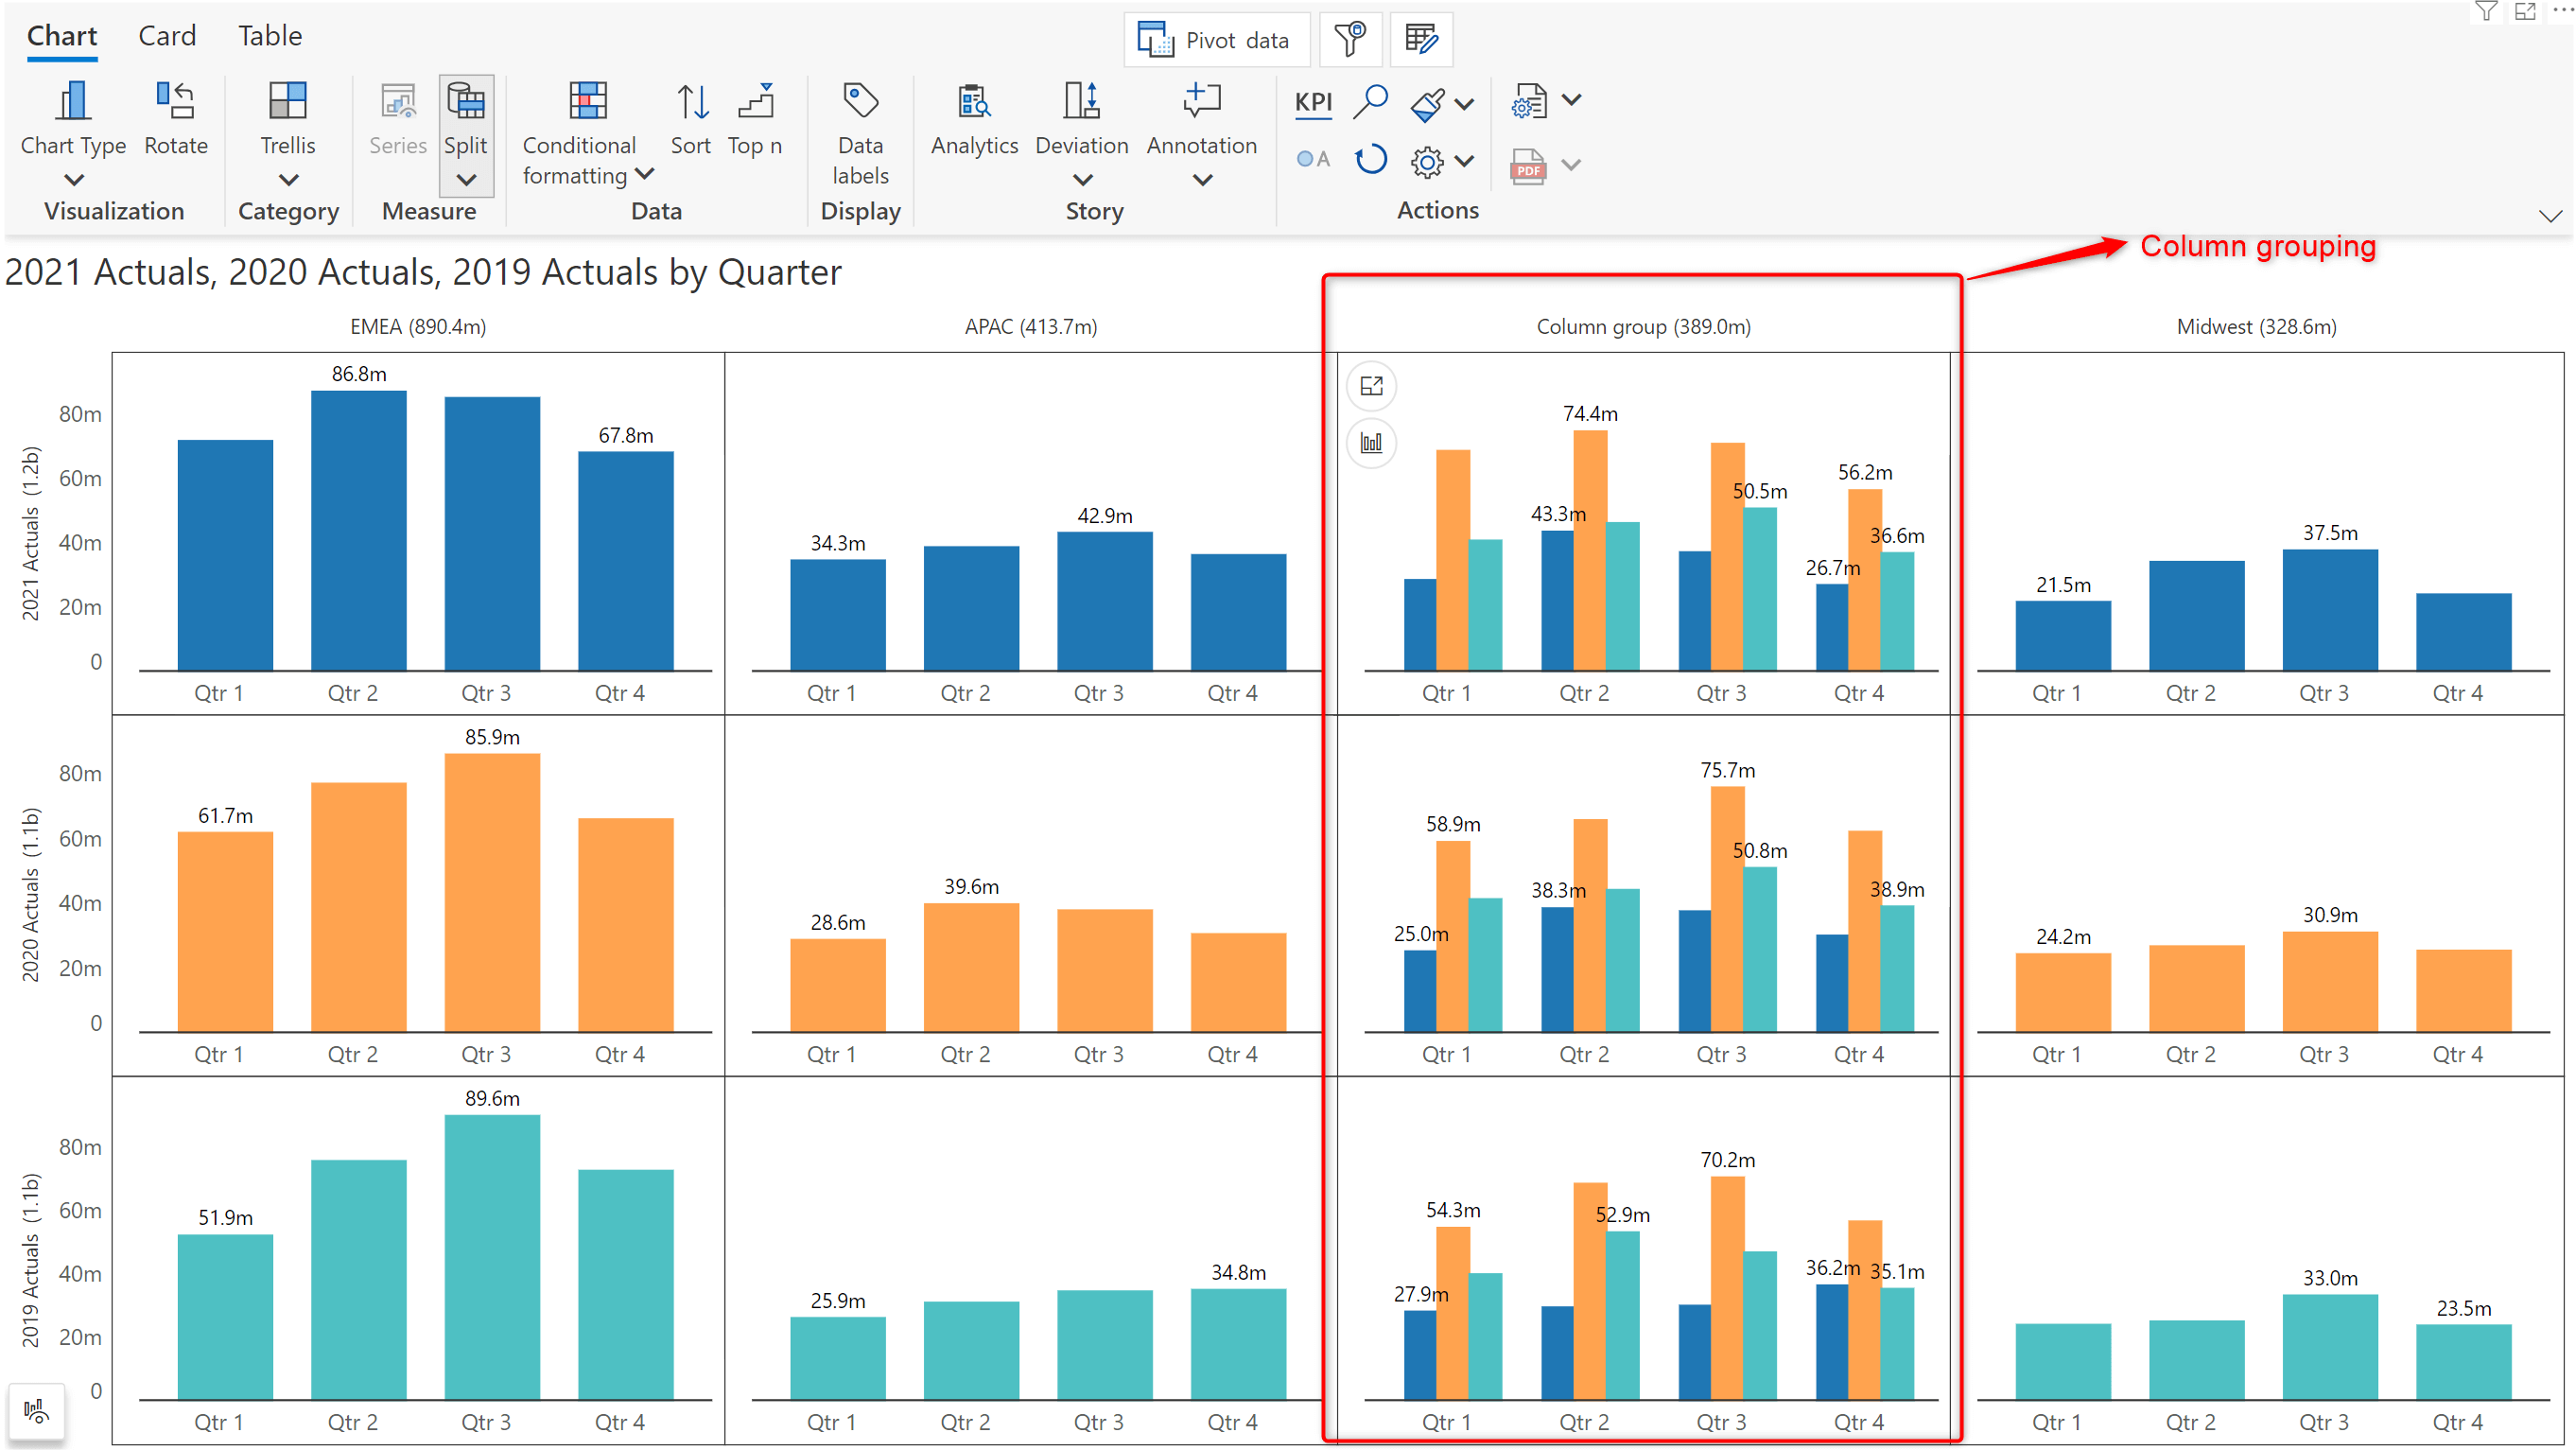
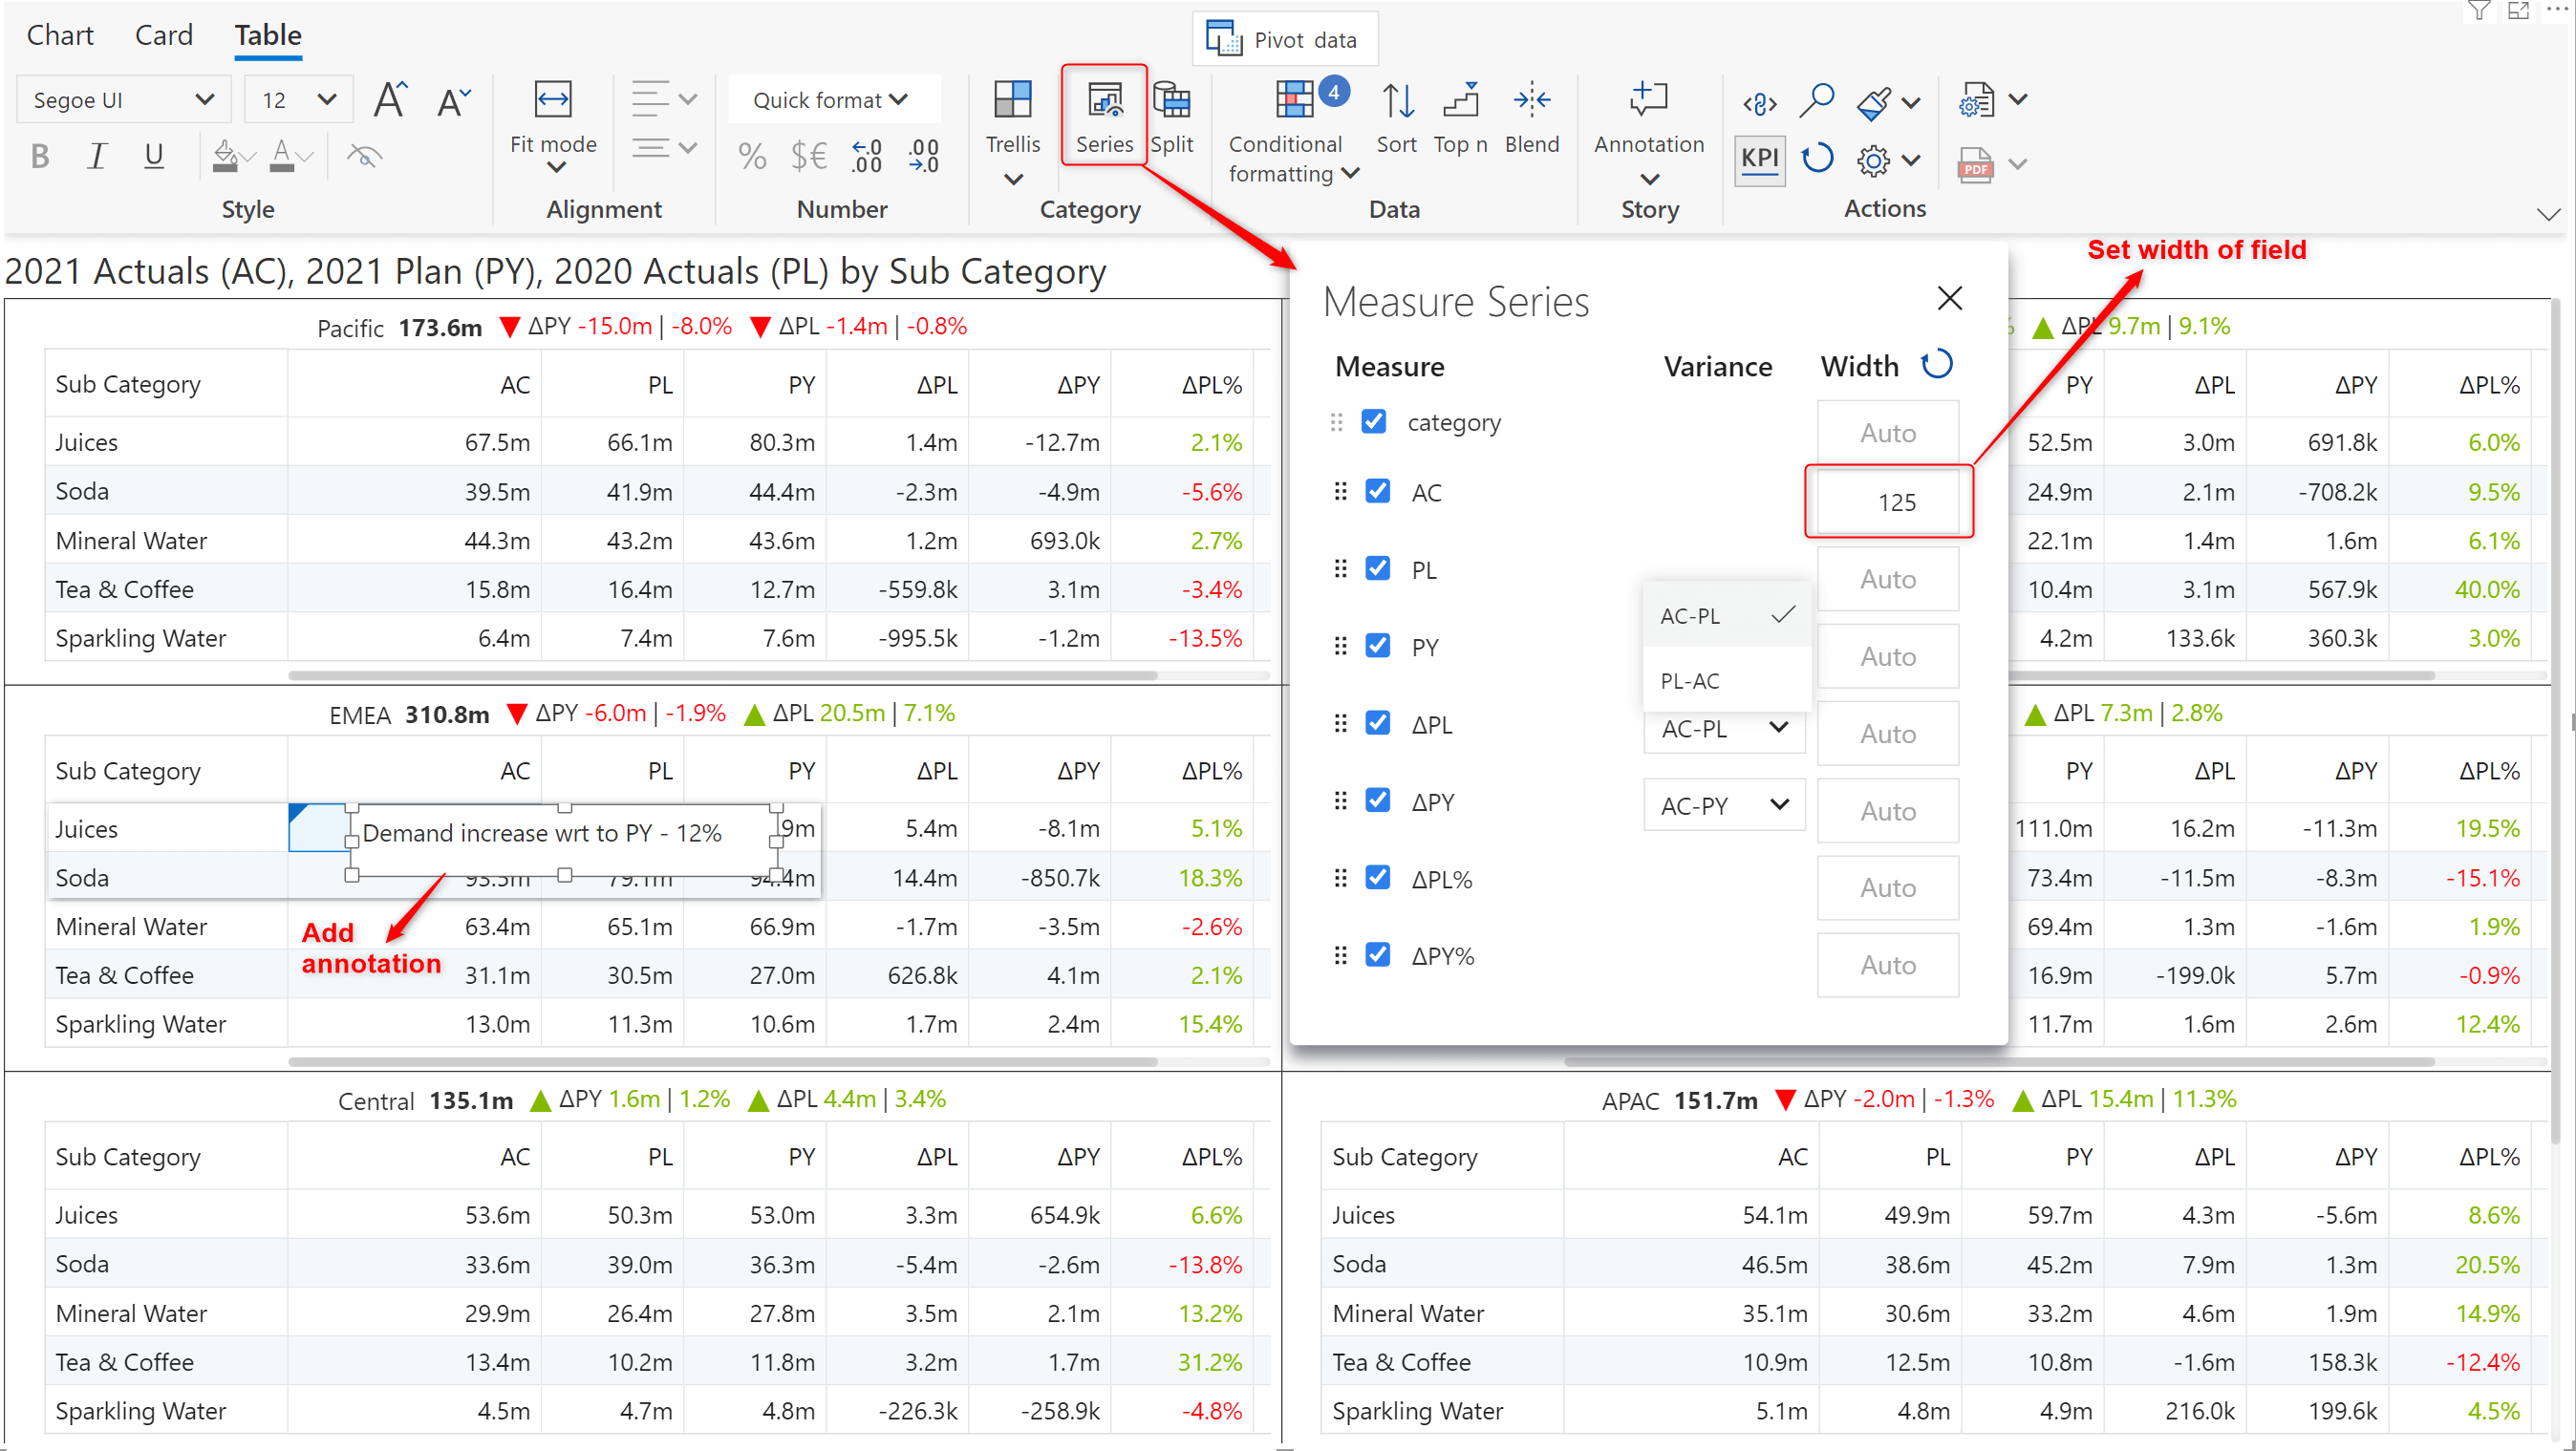
The measure grouping feature that was introduced in the November release allows you to club multiple measures into a single panel. Measure grouping can now be applied in Matrix mode, i.e., when you have a small multiple dimension as a row or a column. You can group either the rows or columns, but not both.
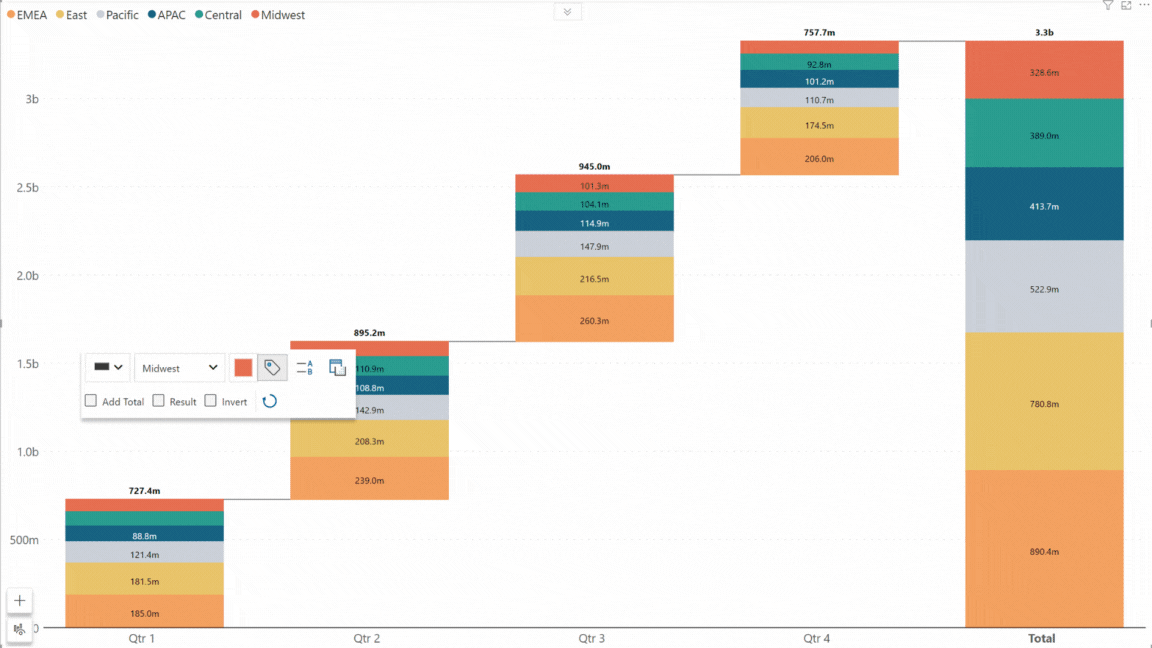
We have created a row group that combines the Central, East, and Pacific columns into a single panel.
The on-object interaction menu for waterfall charts now gives you the ability to add interim total bars at any point in the waterfall.
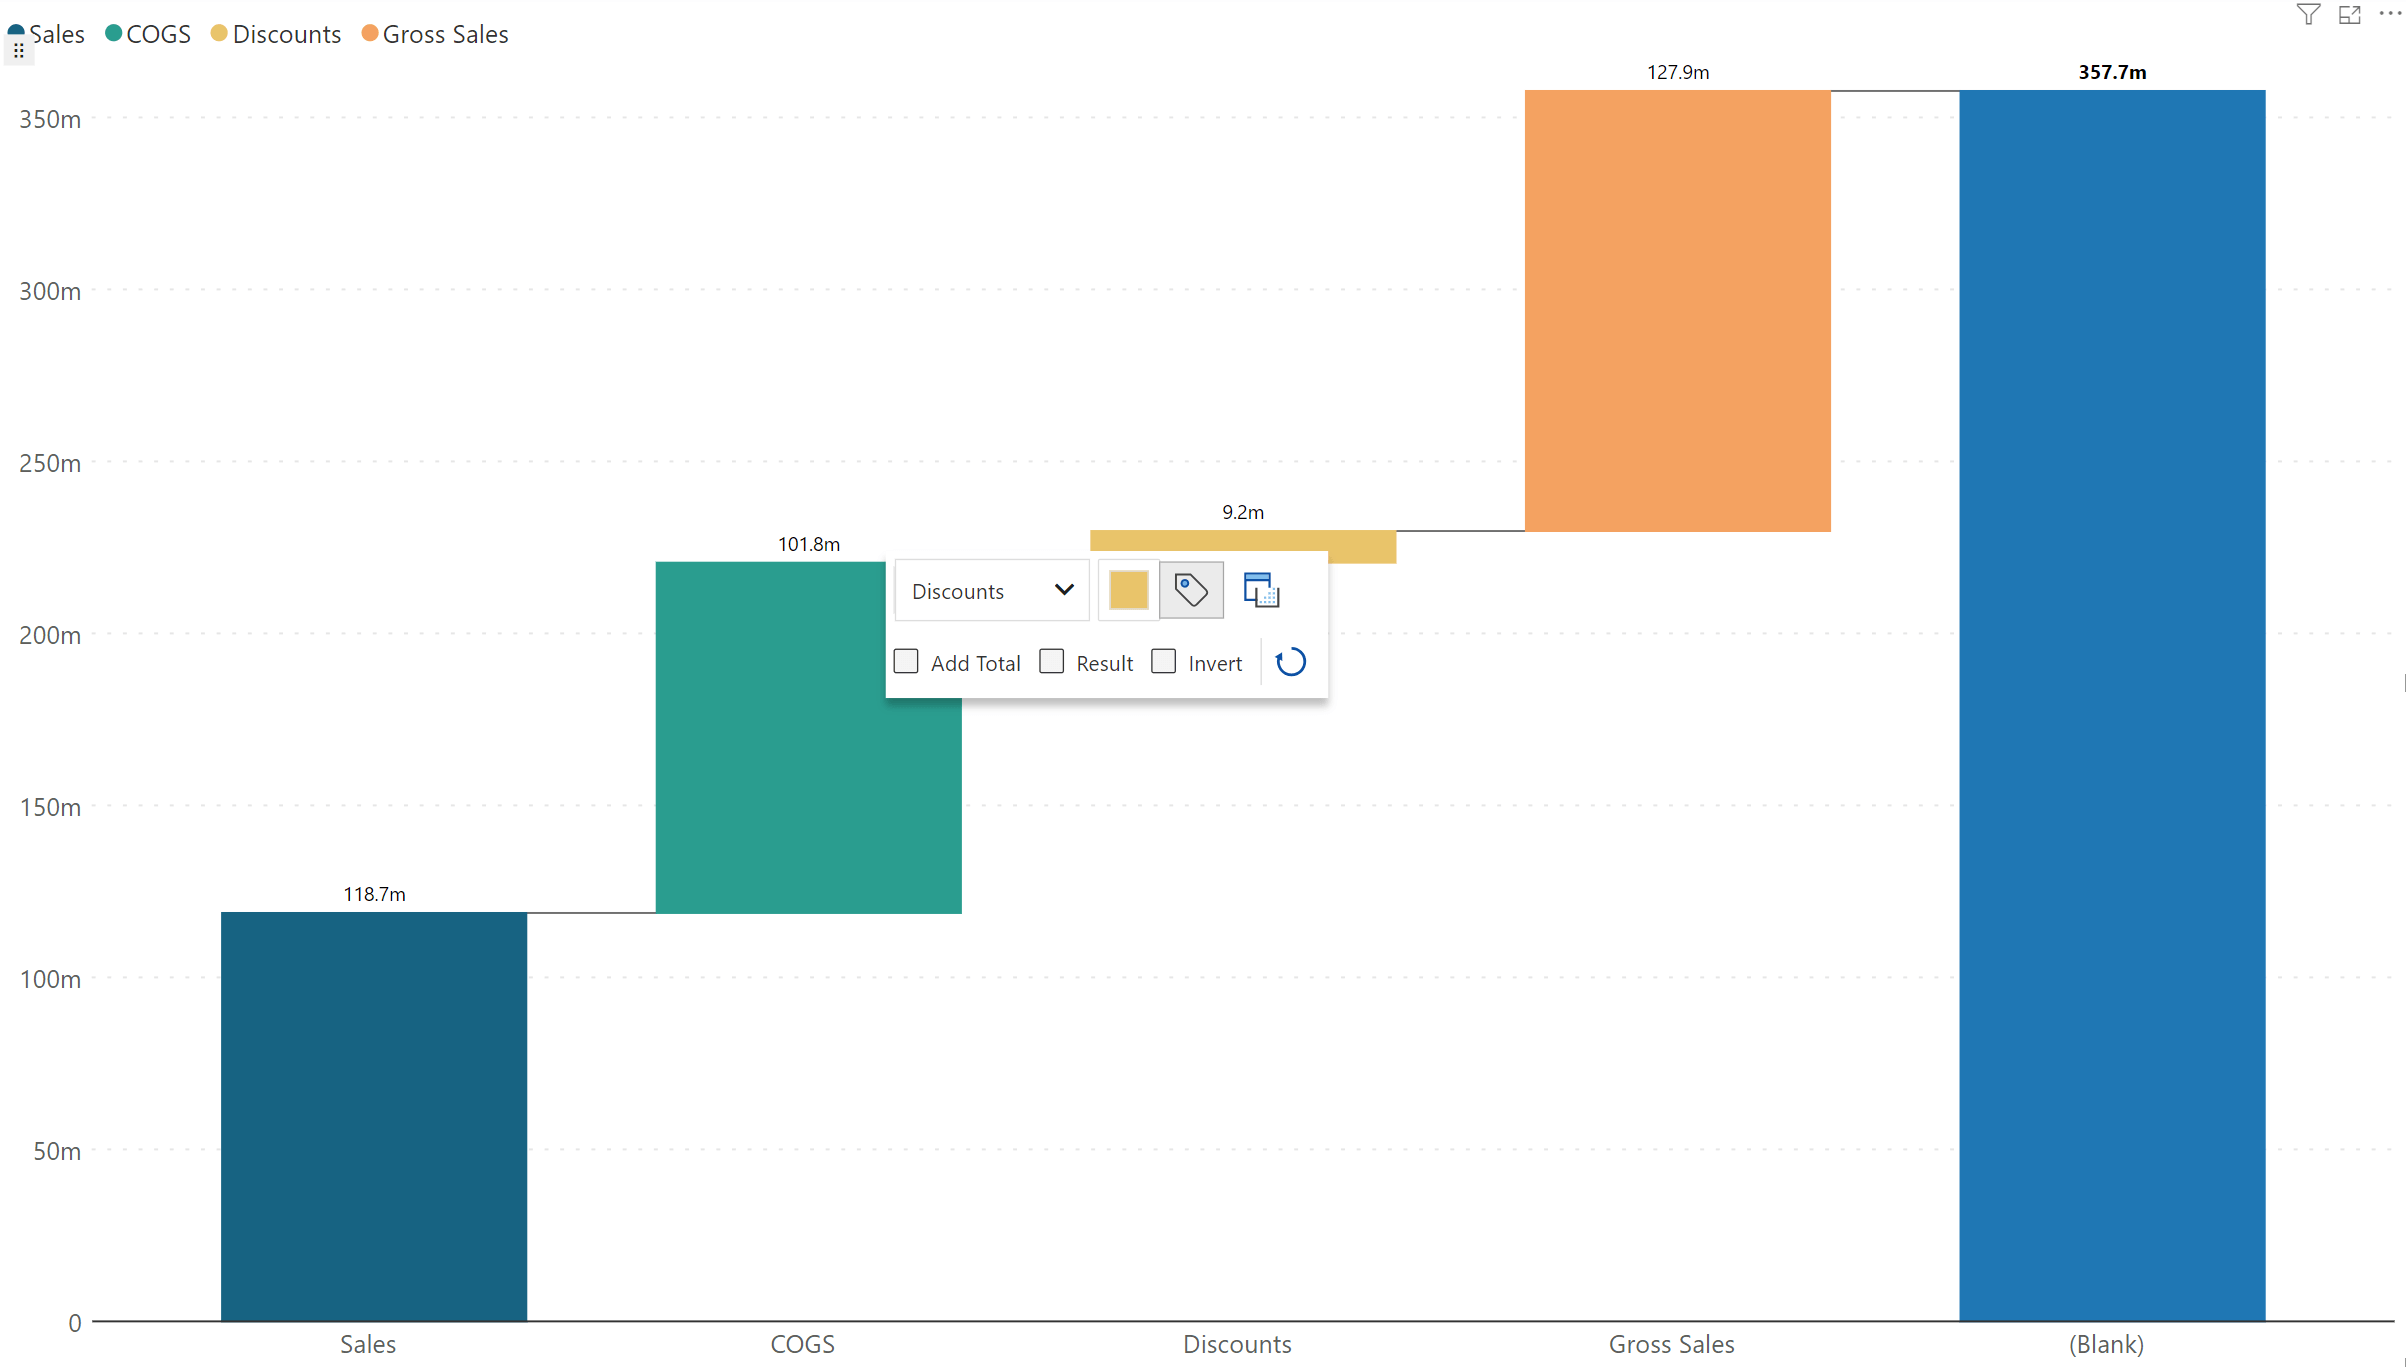
You can also convert any bar into a result pillar or invert a bar in a single click.
The 3.3 release enables you to display the deviation, add interim totals, invert rows, and add result pillars for measure-only waterfalls (breakdown waterfall charts without an axis parameter).
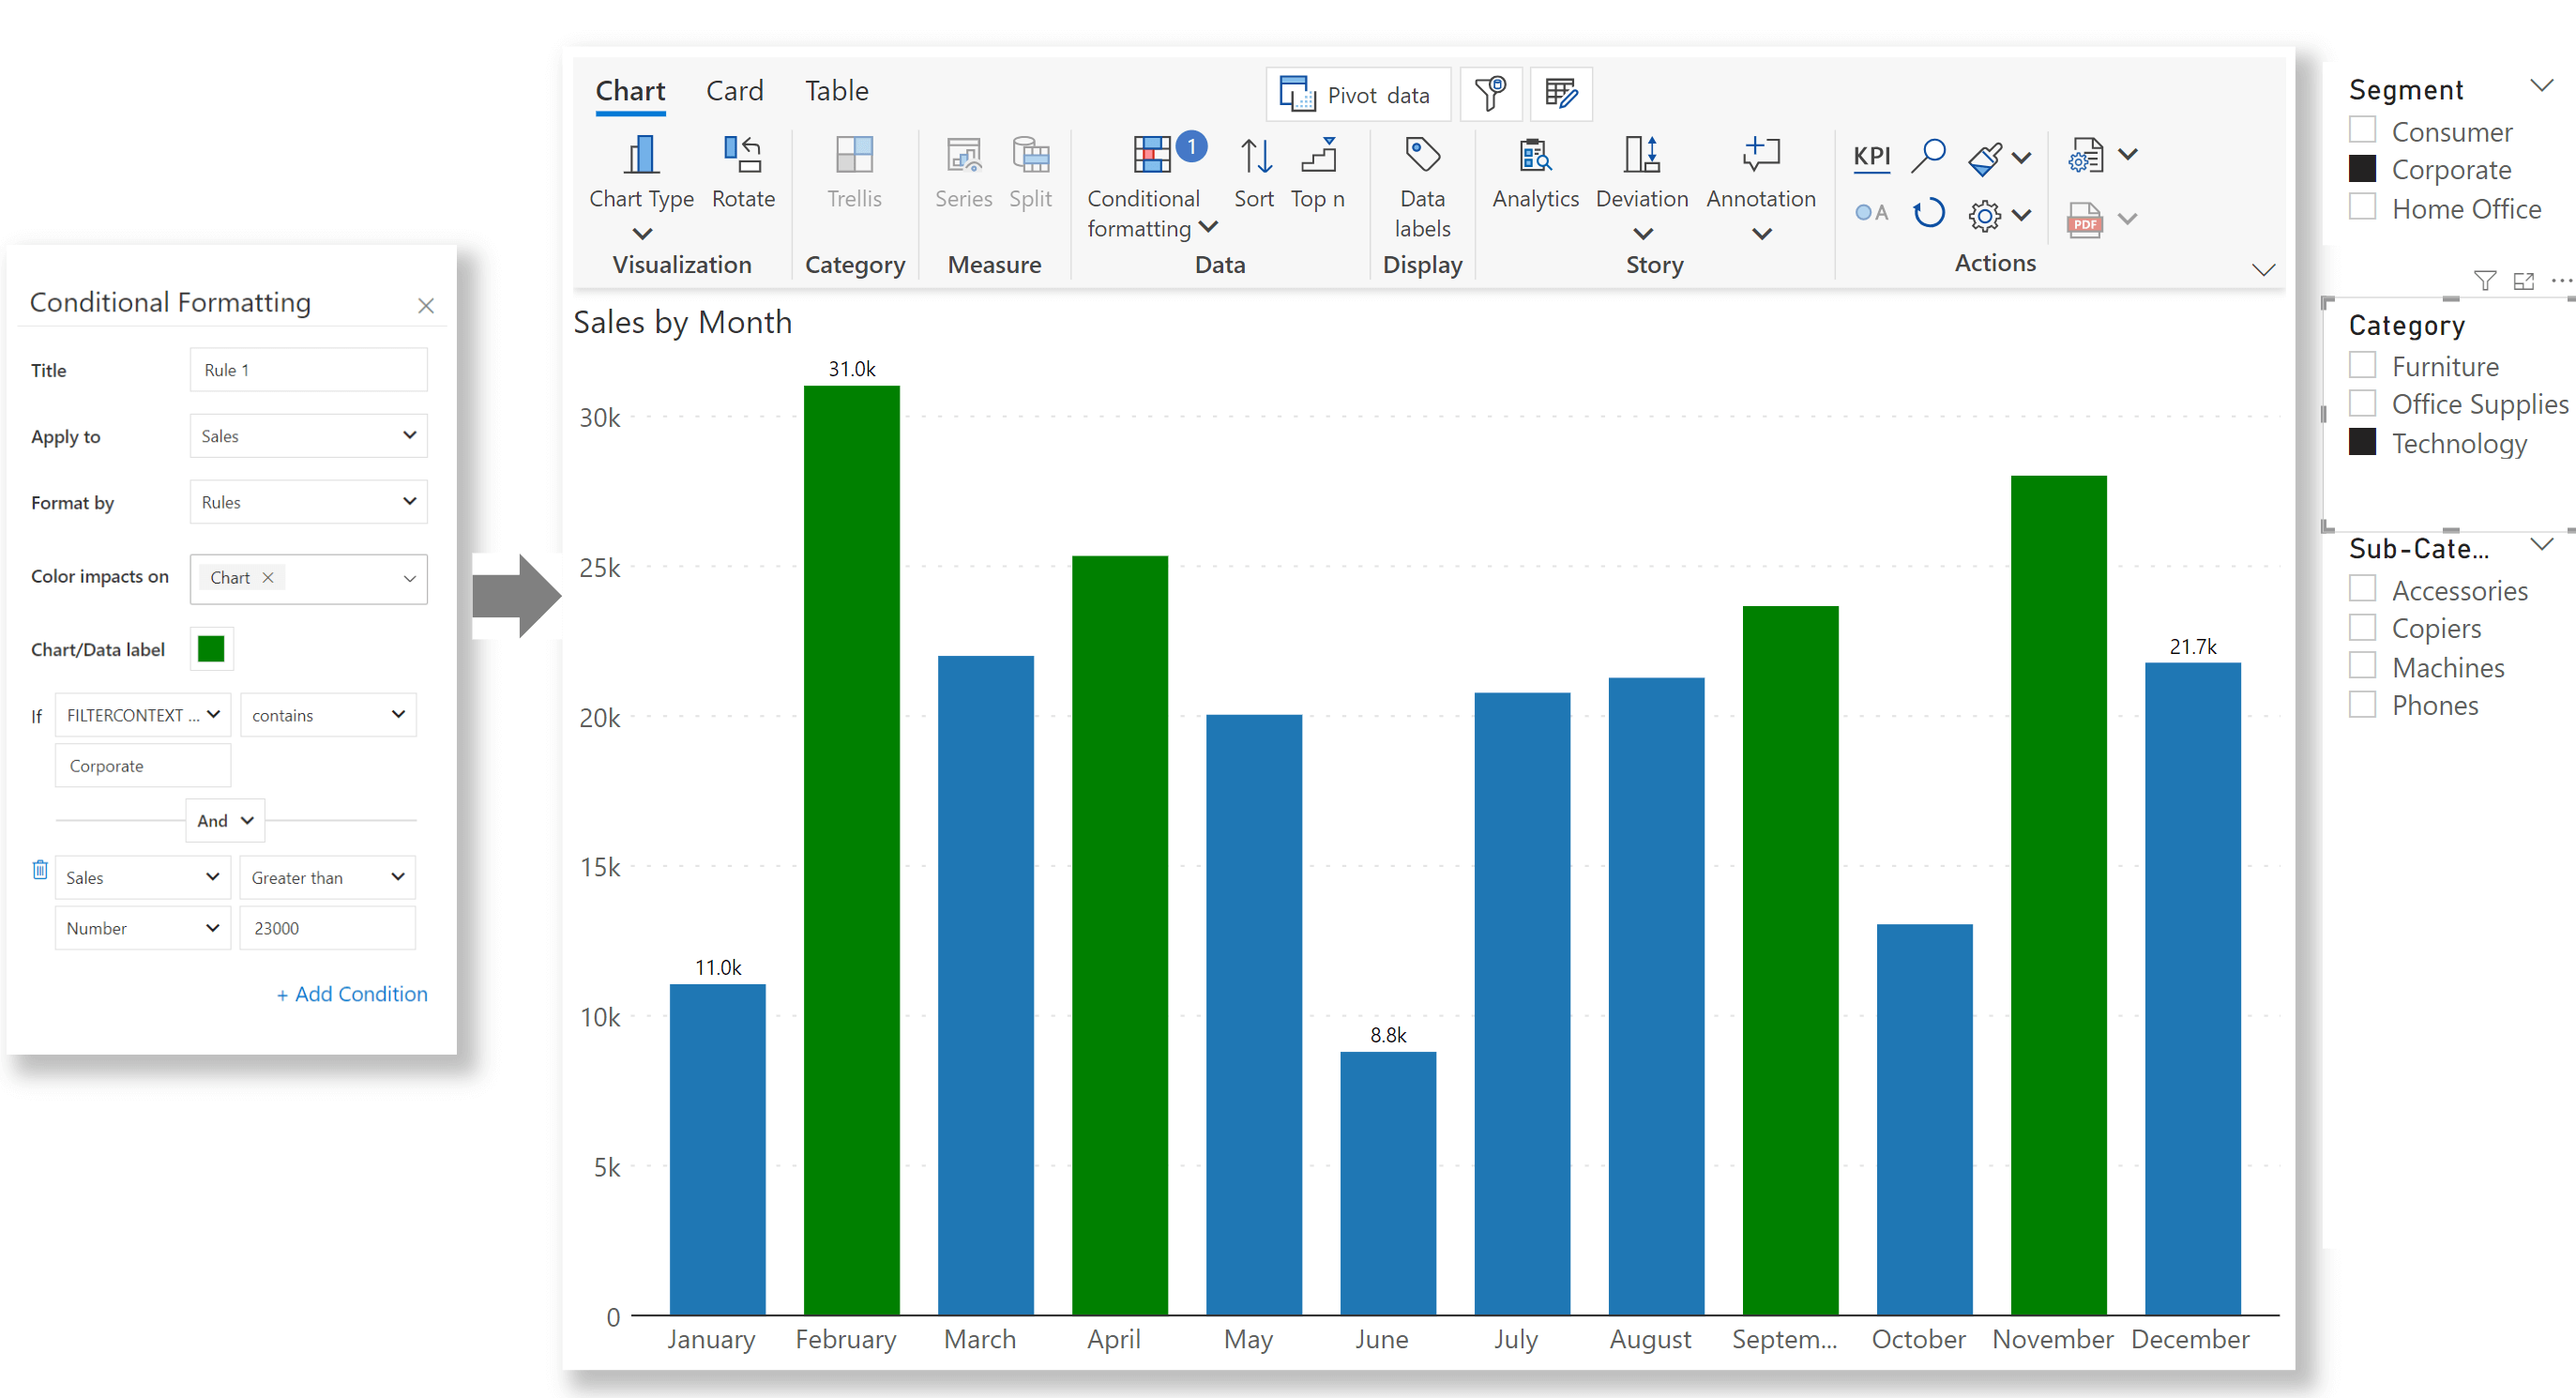
In our October release, we introduced context-aware commenting. This means that the Inforiver visual can recognize filter and slicer selections, and any annotations made will be responsive to them. In our latest release, we have added the ability to apply conditional formatting based on slicer selections, if the filter context has been configured.
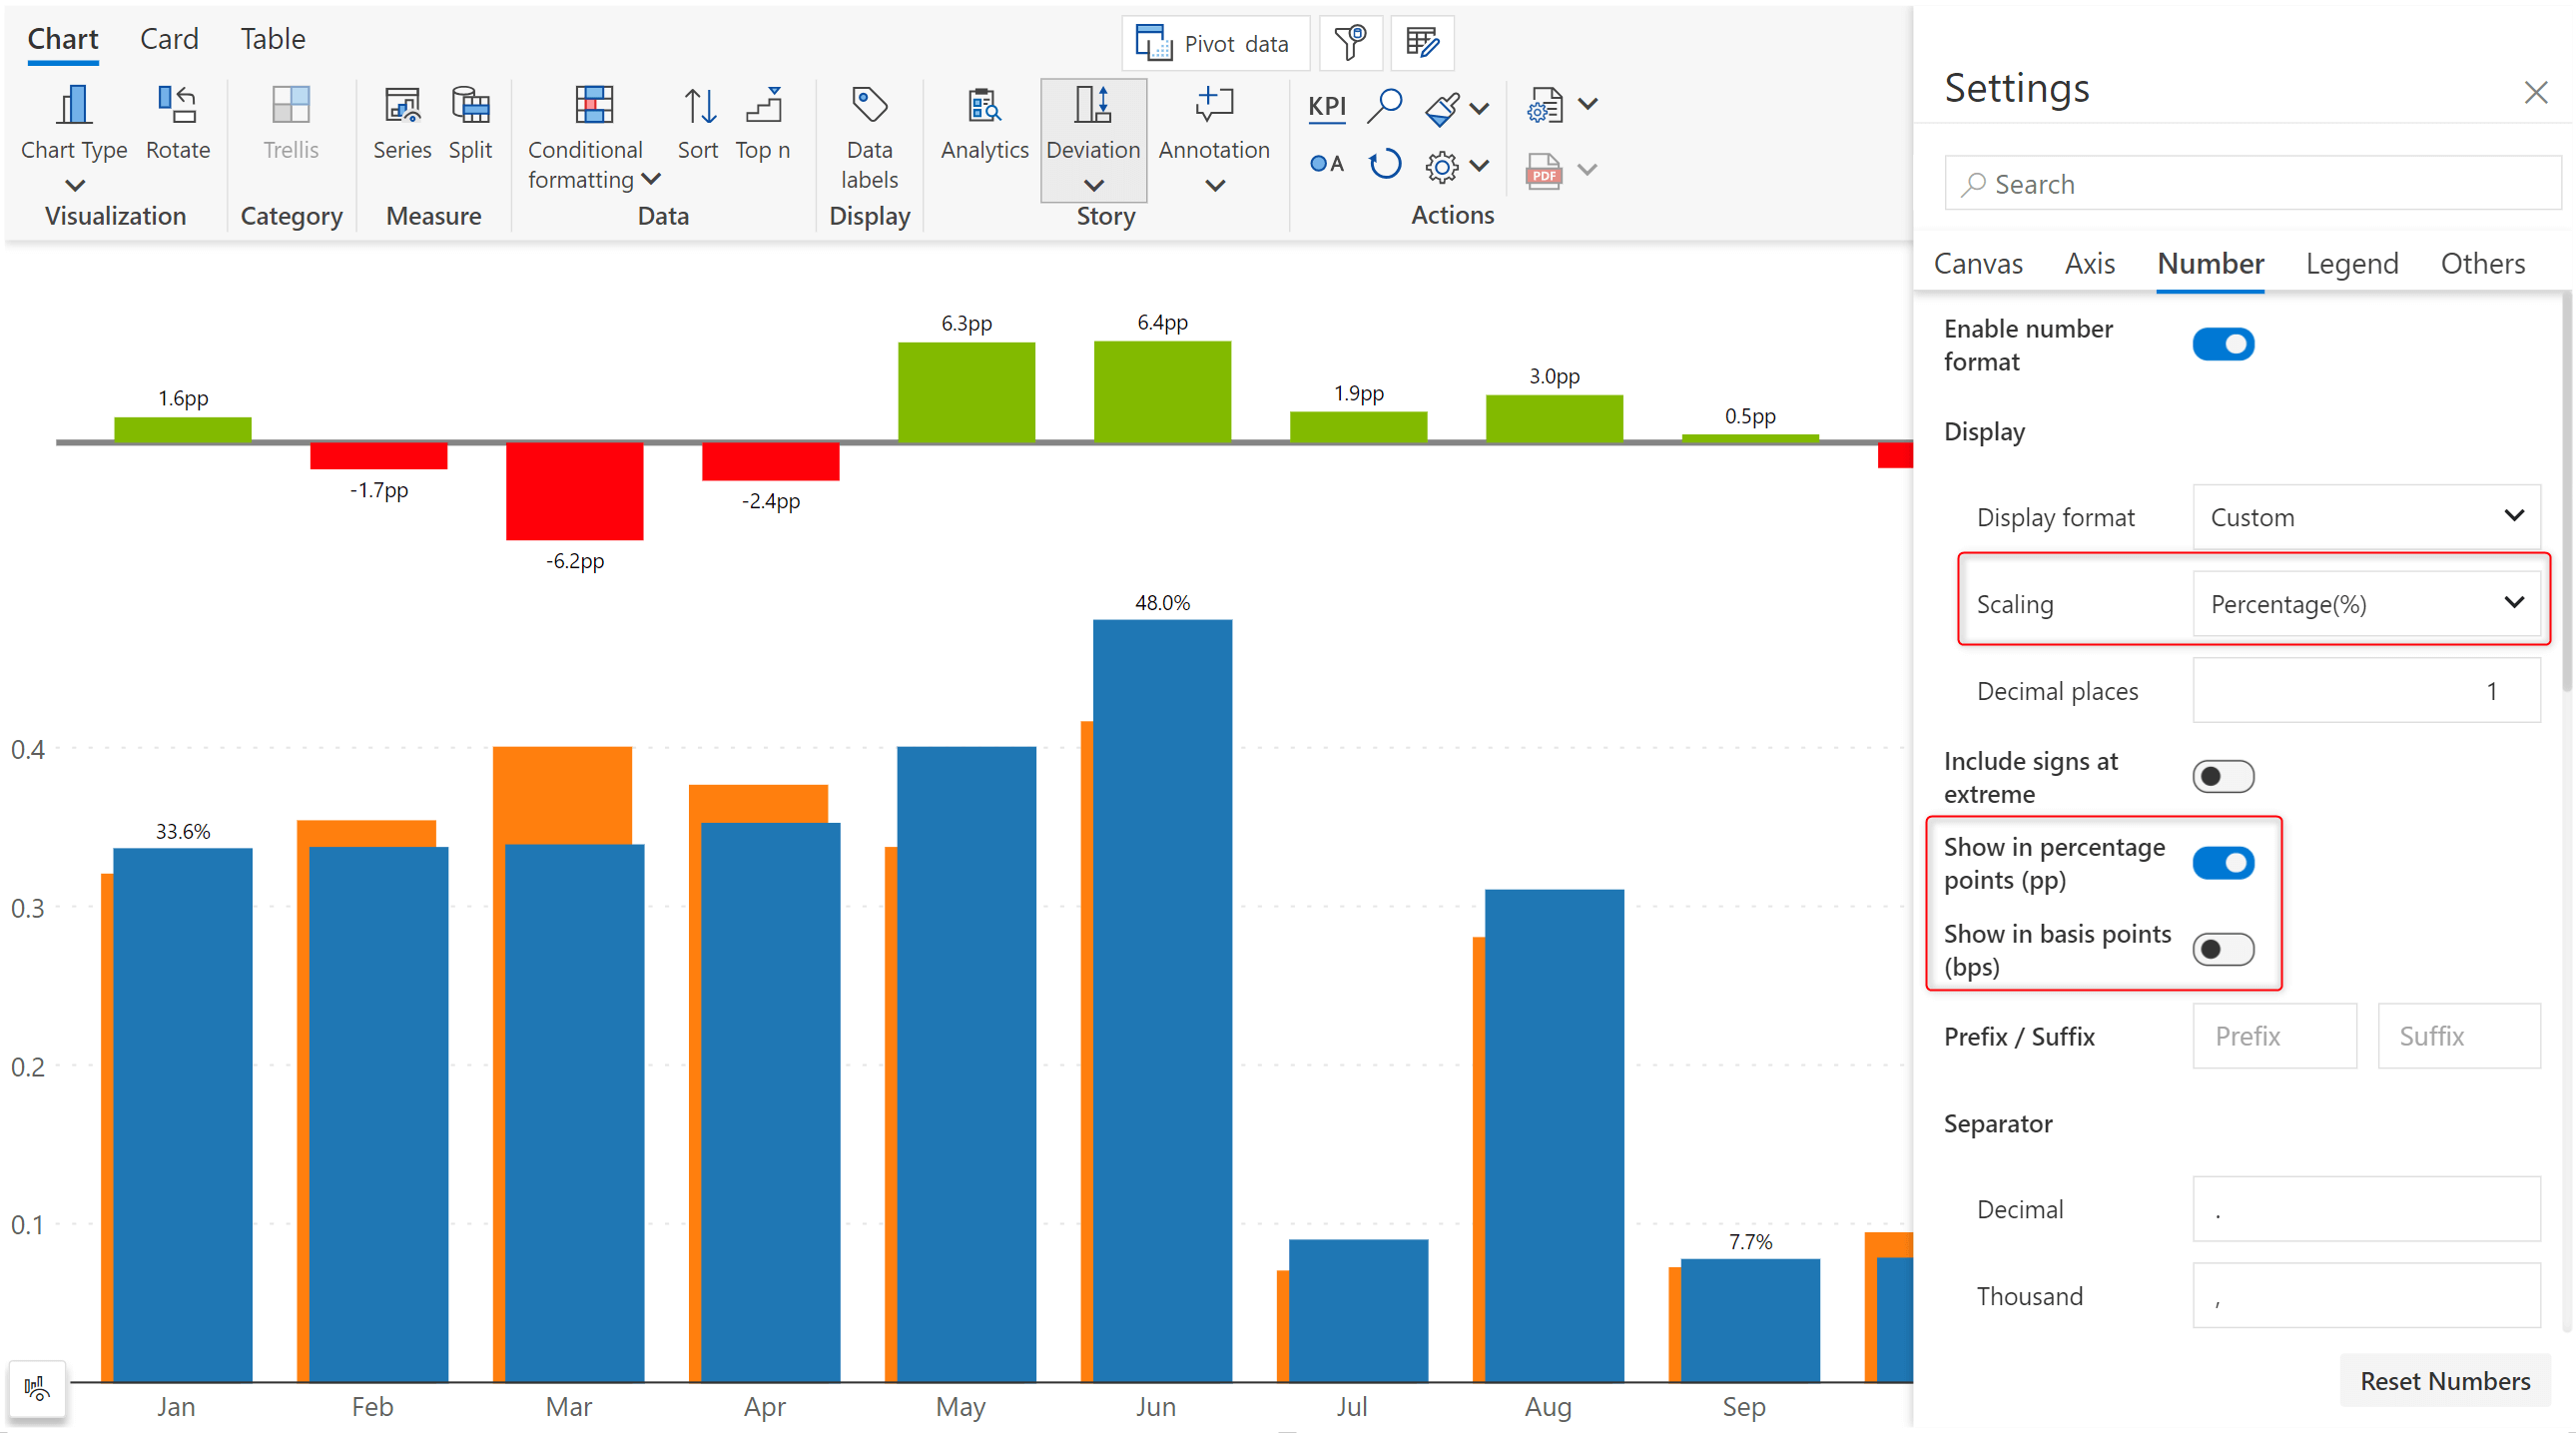
Analytics+ provides the option of using basis points or percentage points to display variances – enabling a straightforward comparison between different variables. This setting is automatically turned on when Inforiver detects percentage values in the data, like interest rate.
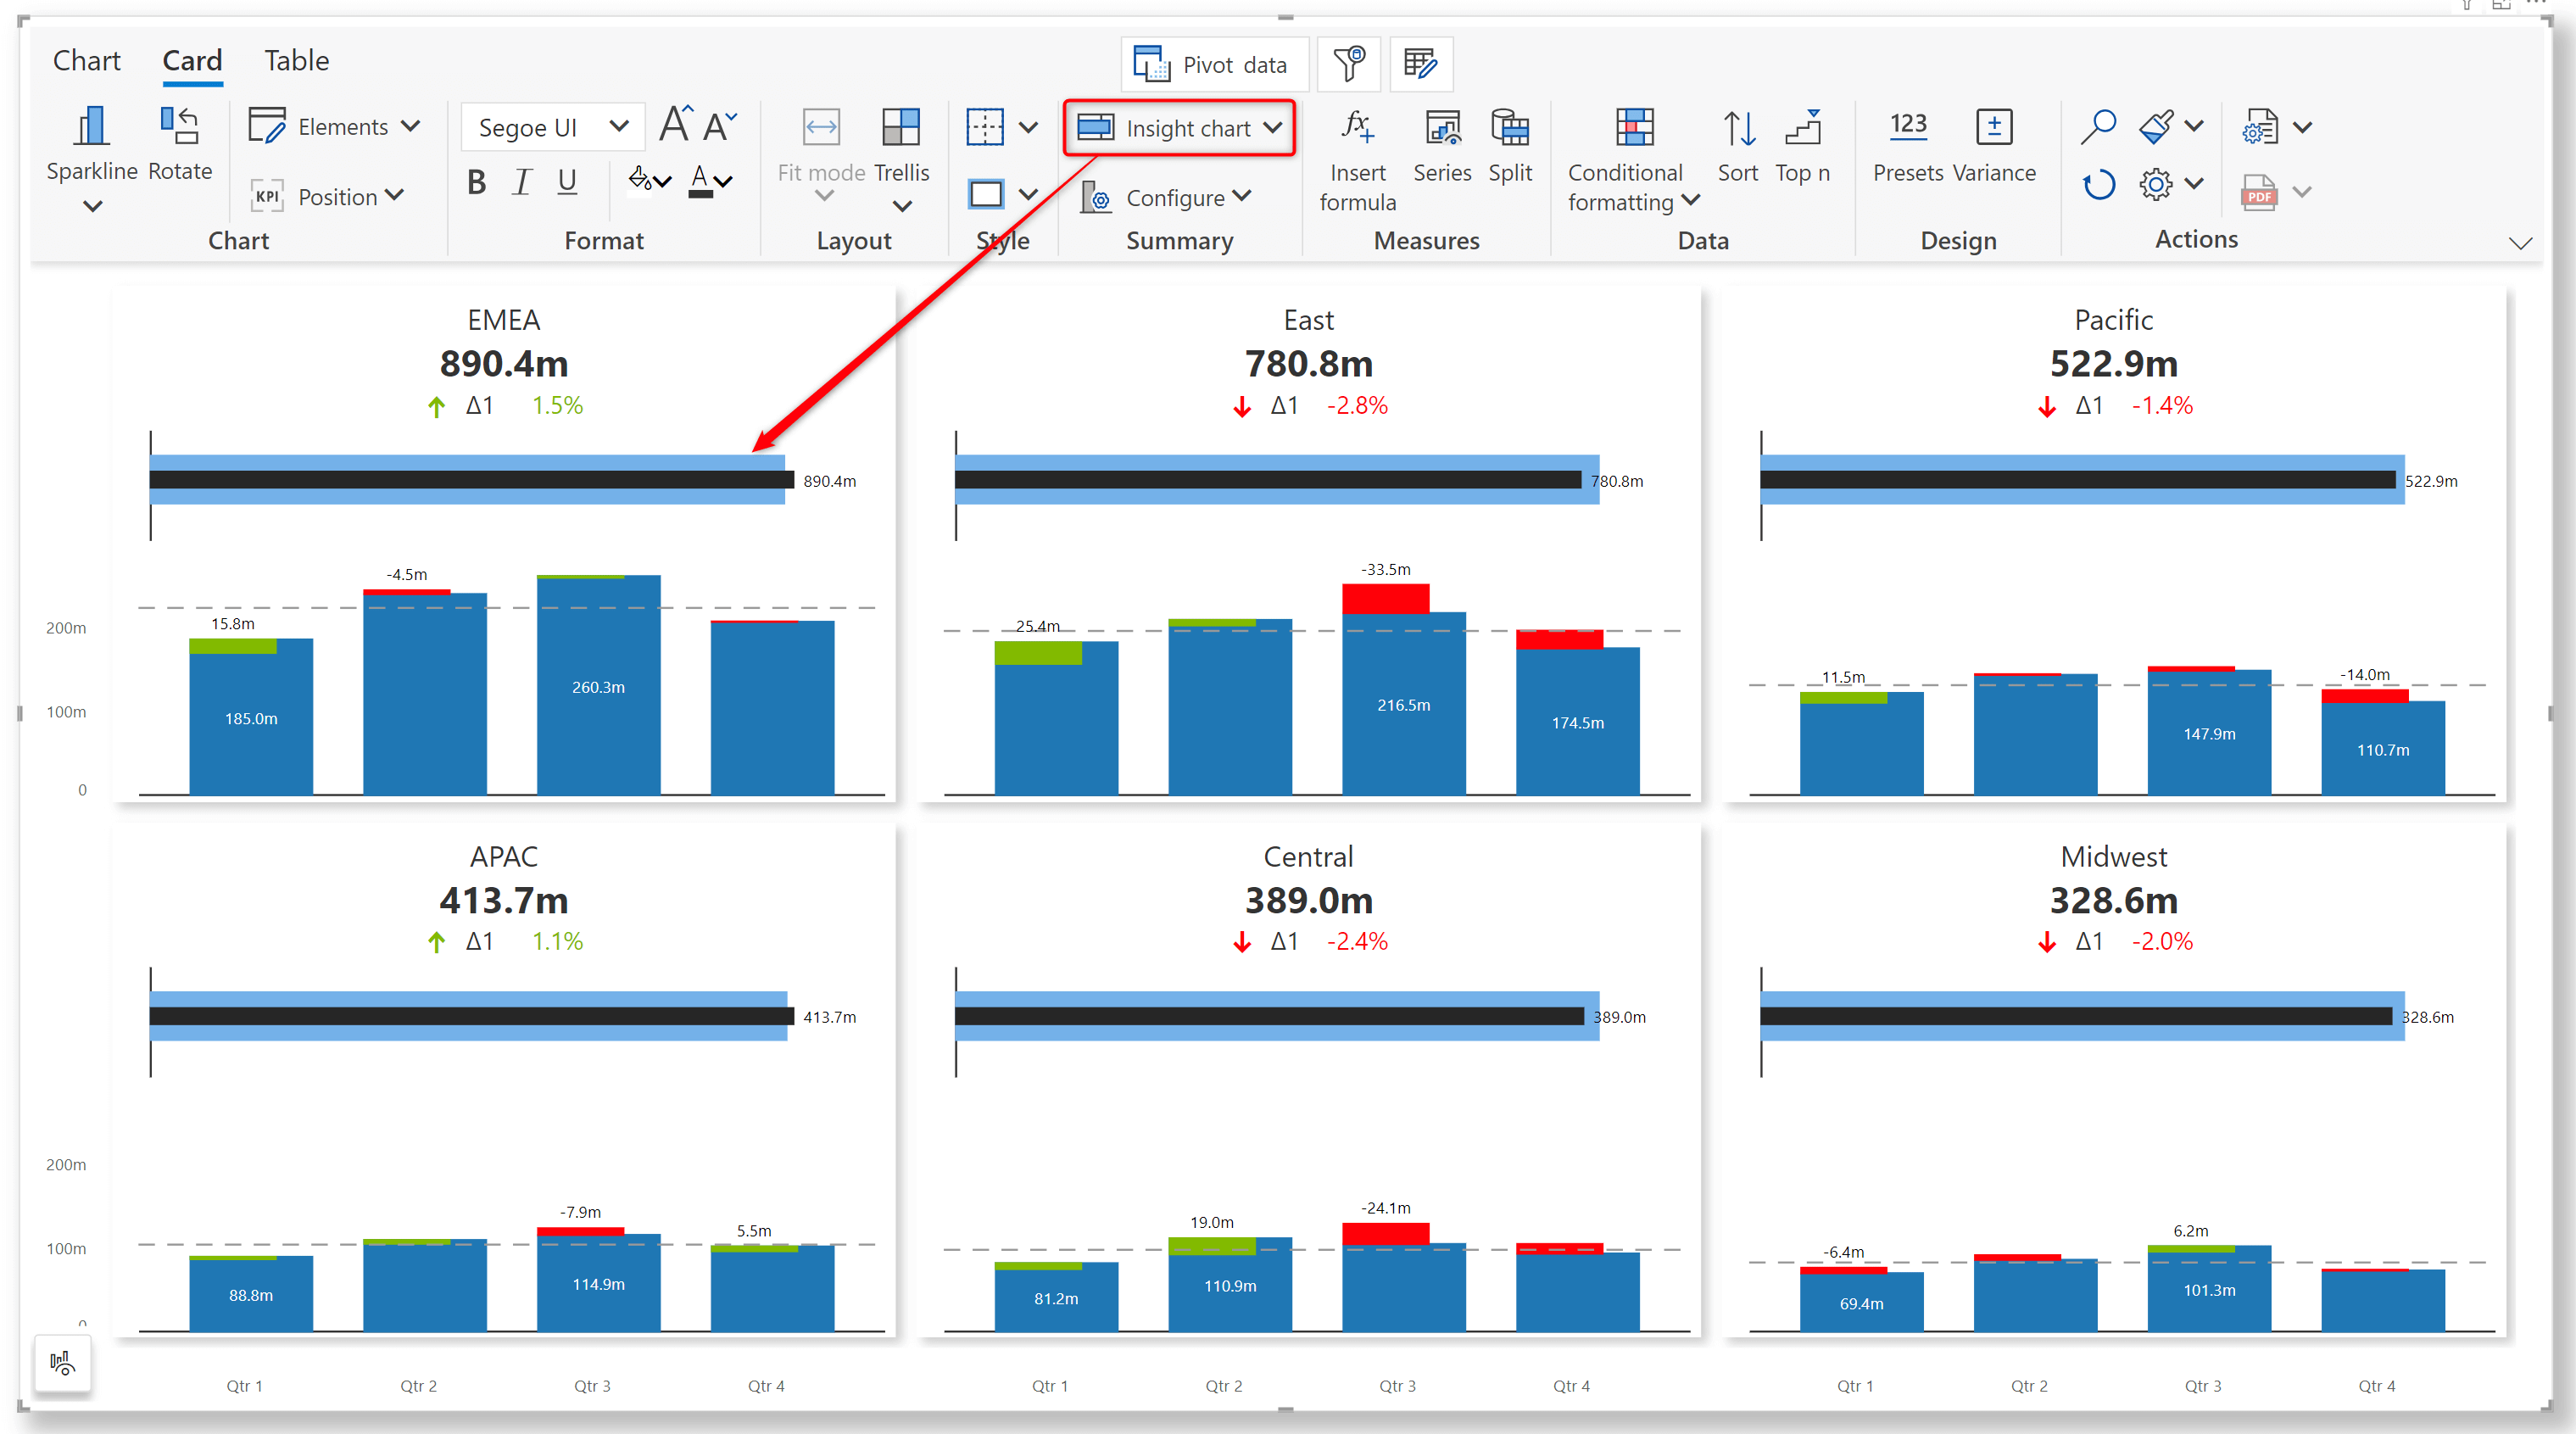
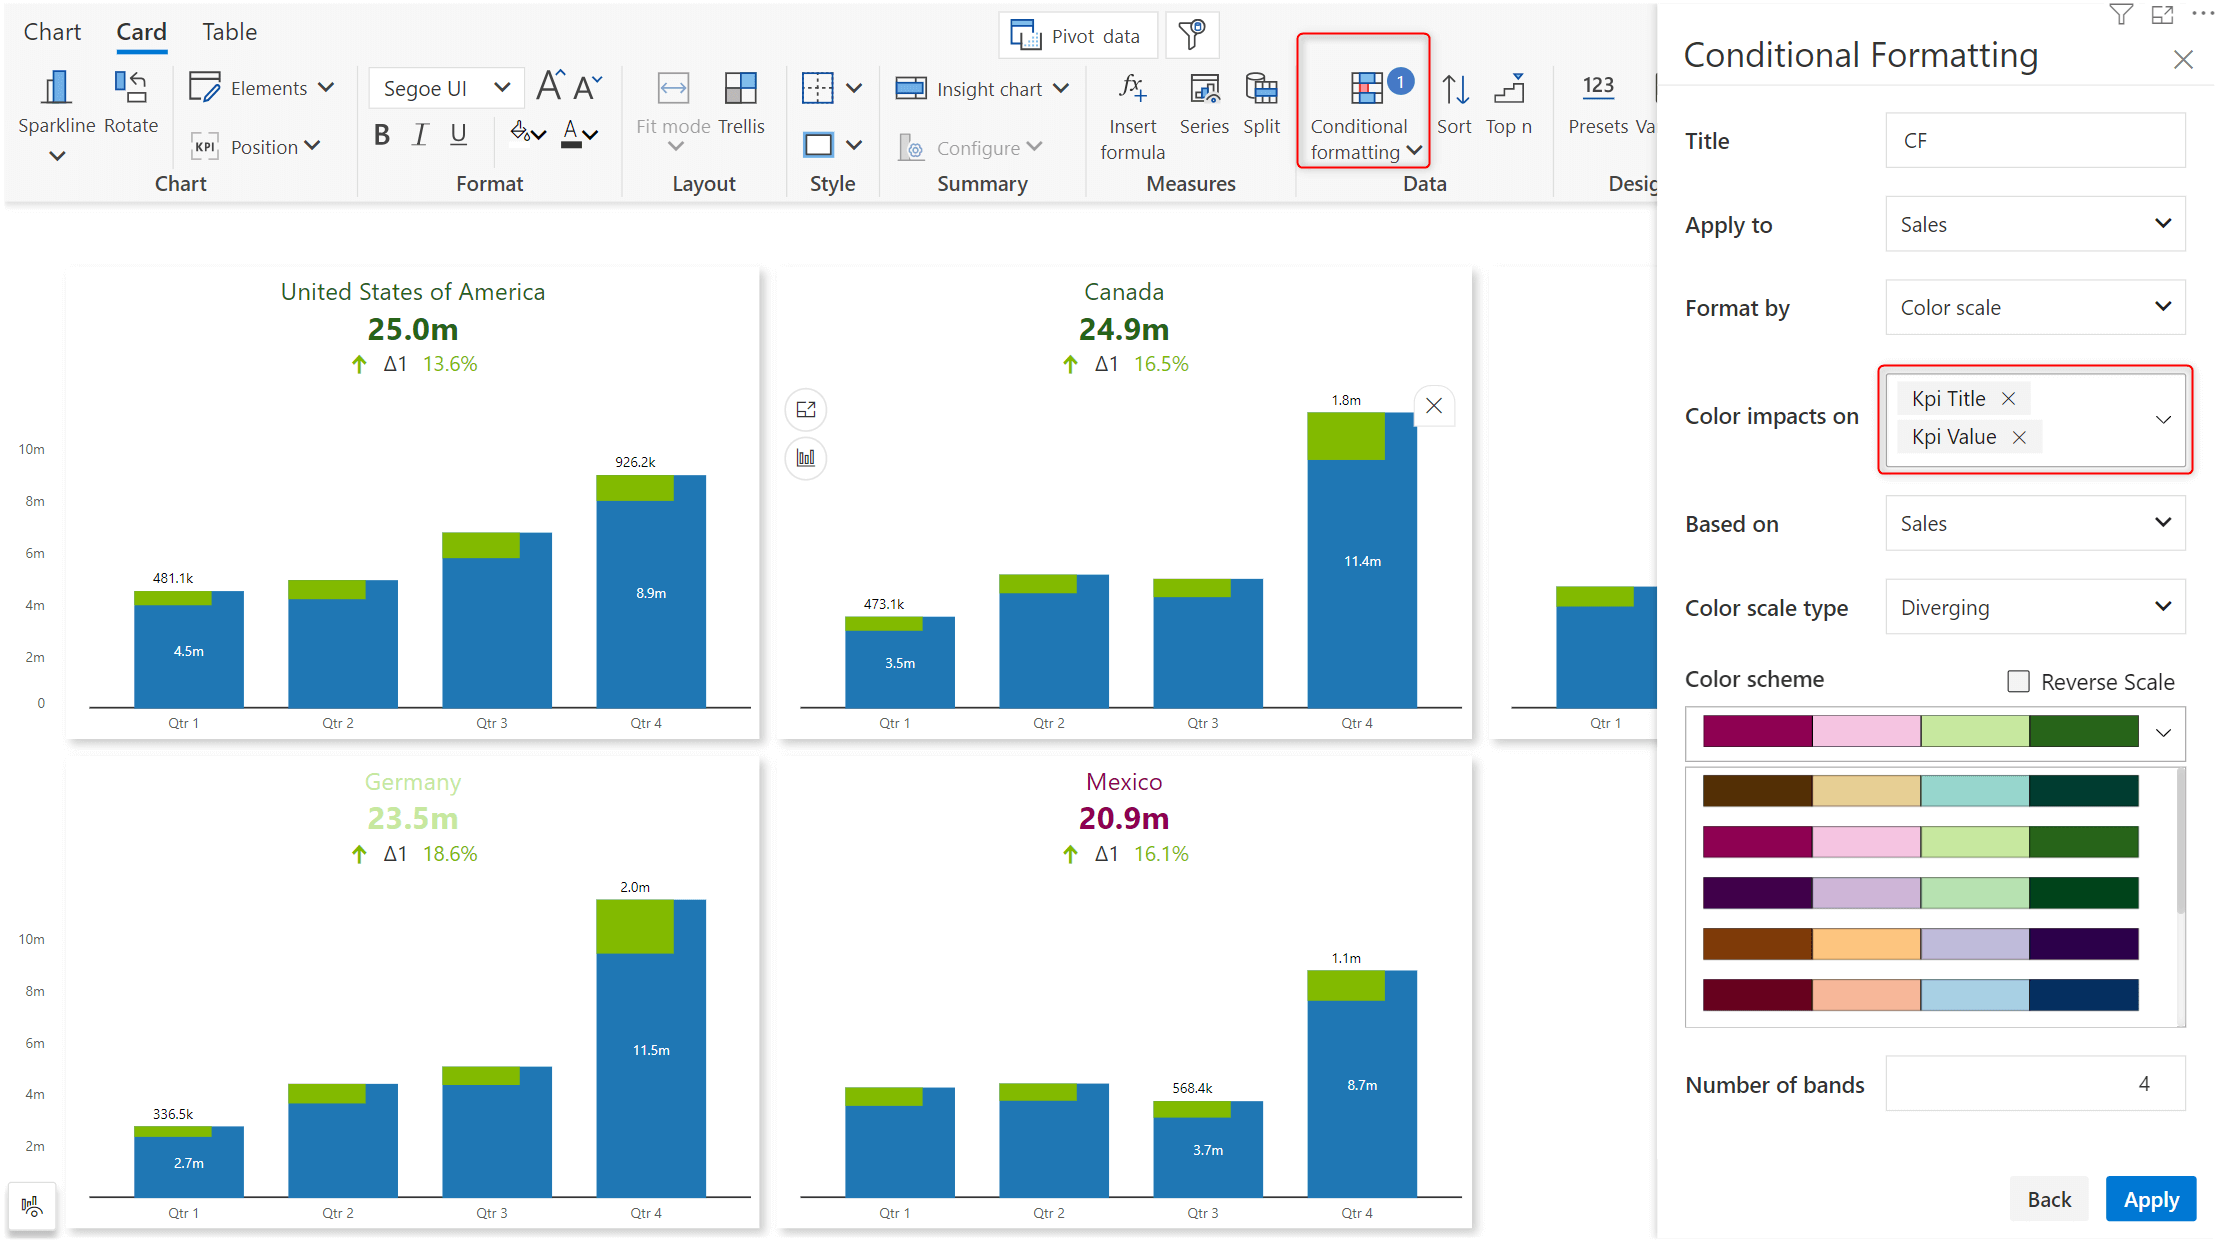
Insight charts can be used to create multi-row cards where a summary of the sparkline chart can be displayed as a bullet chart. For example, the sparkline depicts the sales for different quarters and the bullet chart depicts the YTD sales against the previous year’s sales. The position, number formatting, styling, and color scheme of the insight chart are customizable.
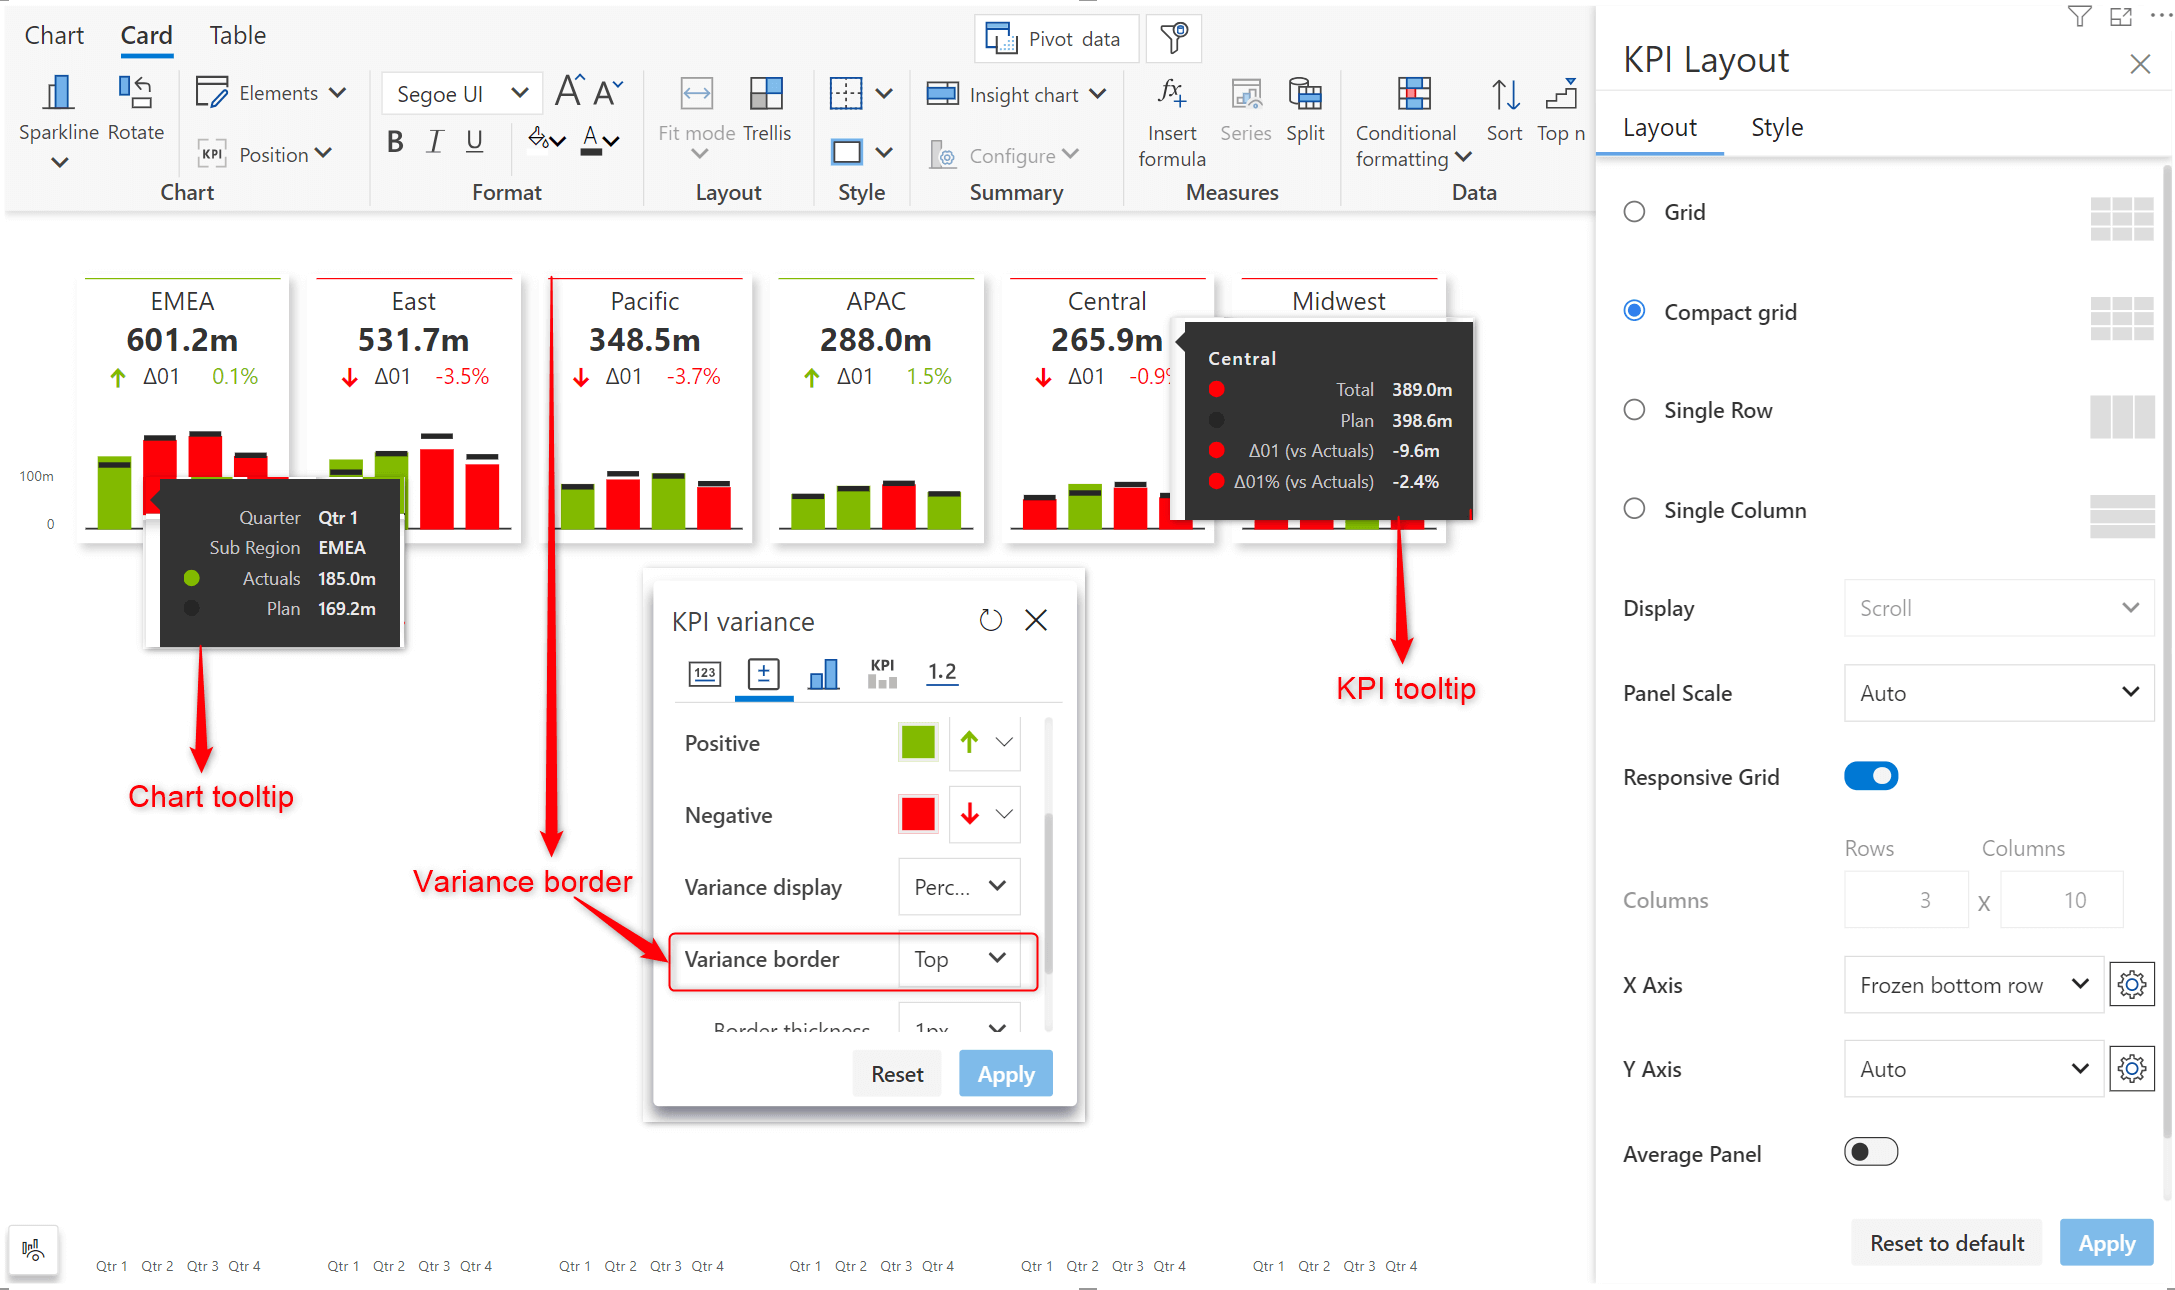
You can now apply conditional formatting for the KPI title and values. Both rules and color scales can be used. This feature is available in chart, card, and table modes.
We'd love to hear your ideas for Inforiver – whether they are a cool new feature or an improvement on existing features. Visit the Inforiver Community to share your ideas, vote on other submissions, and interact with other users.

Inforiver helps enterprises consolidate planning, reporting & analytics on a single platform (Power BI). The no-code, self-service award-winning platform has been recognized as the industry’s best and is adopted by many Fortune 100 firms.
Inforiver is a product of Lumel, the #1 Power BI AppSource Partner. The firm serves over 3,000 customers worldwide through its portfolio of products offered under the brands Inforiver, EDITable, ValQ, and xViz.
 Transform Power BI dashboards into decision-driving tools. Discover data visualization best practices tailored for Power BI users.