Upcoming webinar on 'Inforiver Charts : The fastest way to deliver stories in Power BI', Aug 29th , Monday, 10.30 AM CST. Register Now
Upcoming webinar on 'Inforiver Charts : The fastest way to deliver stories in Power BI', Aug 29th , Monday, 10.30 AM CST. Register Now
Welcome to the Inforiver Matrix October 2022 update. We are thrilled to announce several new features and key enhancements (for all the editions) most anticipated by our Inforiver community!
Key enhancements in this v1.7 release include:
One of the most widely requested features, Excel-like pivot mode is now available in Inforiver!
Inforiver supports expand/collapse hierarchies along both rows and columns like traditional pivot tables along with Stepped, Outline and classic pivot table layouts inside Power BI.
In the ‘Layout’ option, you can find the ‘Pivot Mode’ with options to show values on rows or columns as shown below.
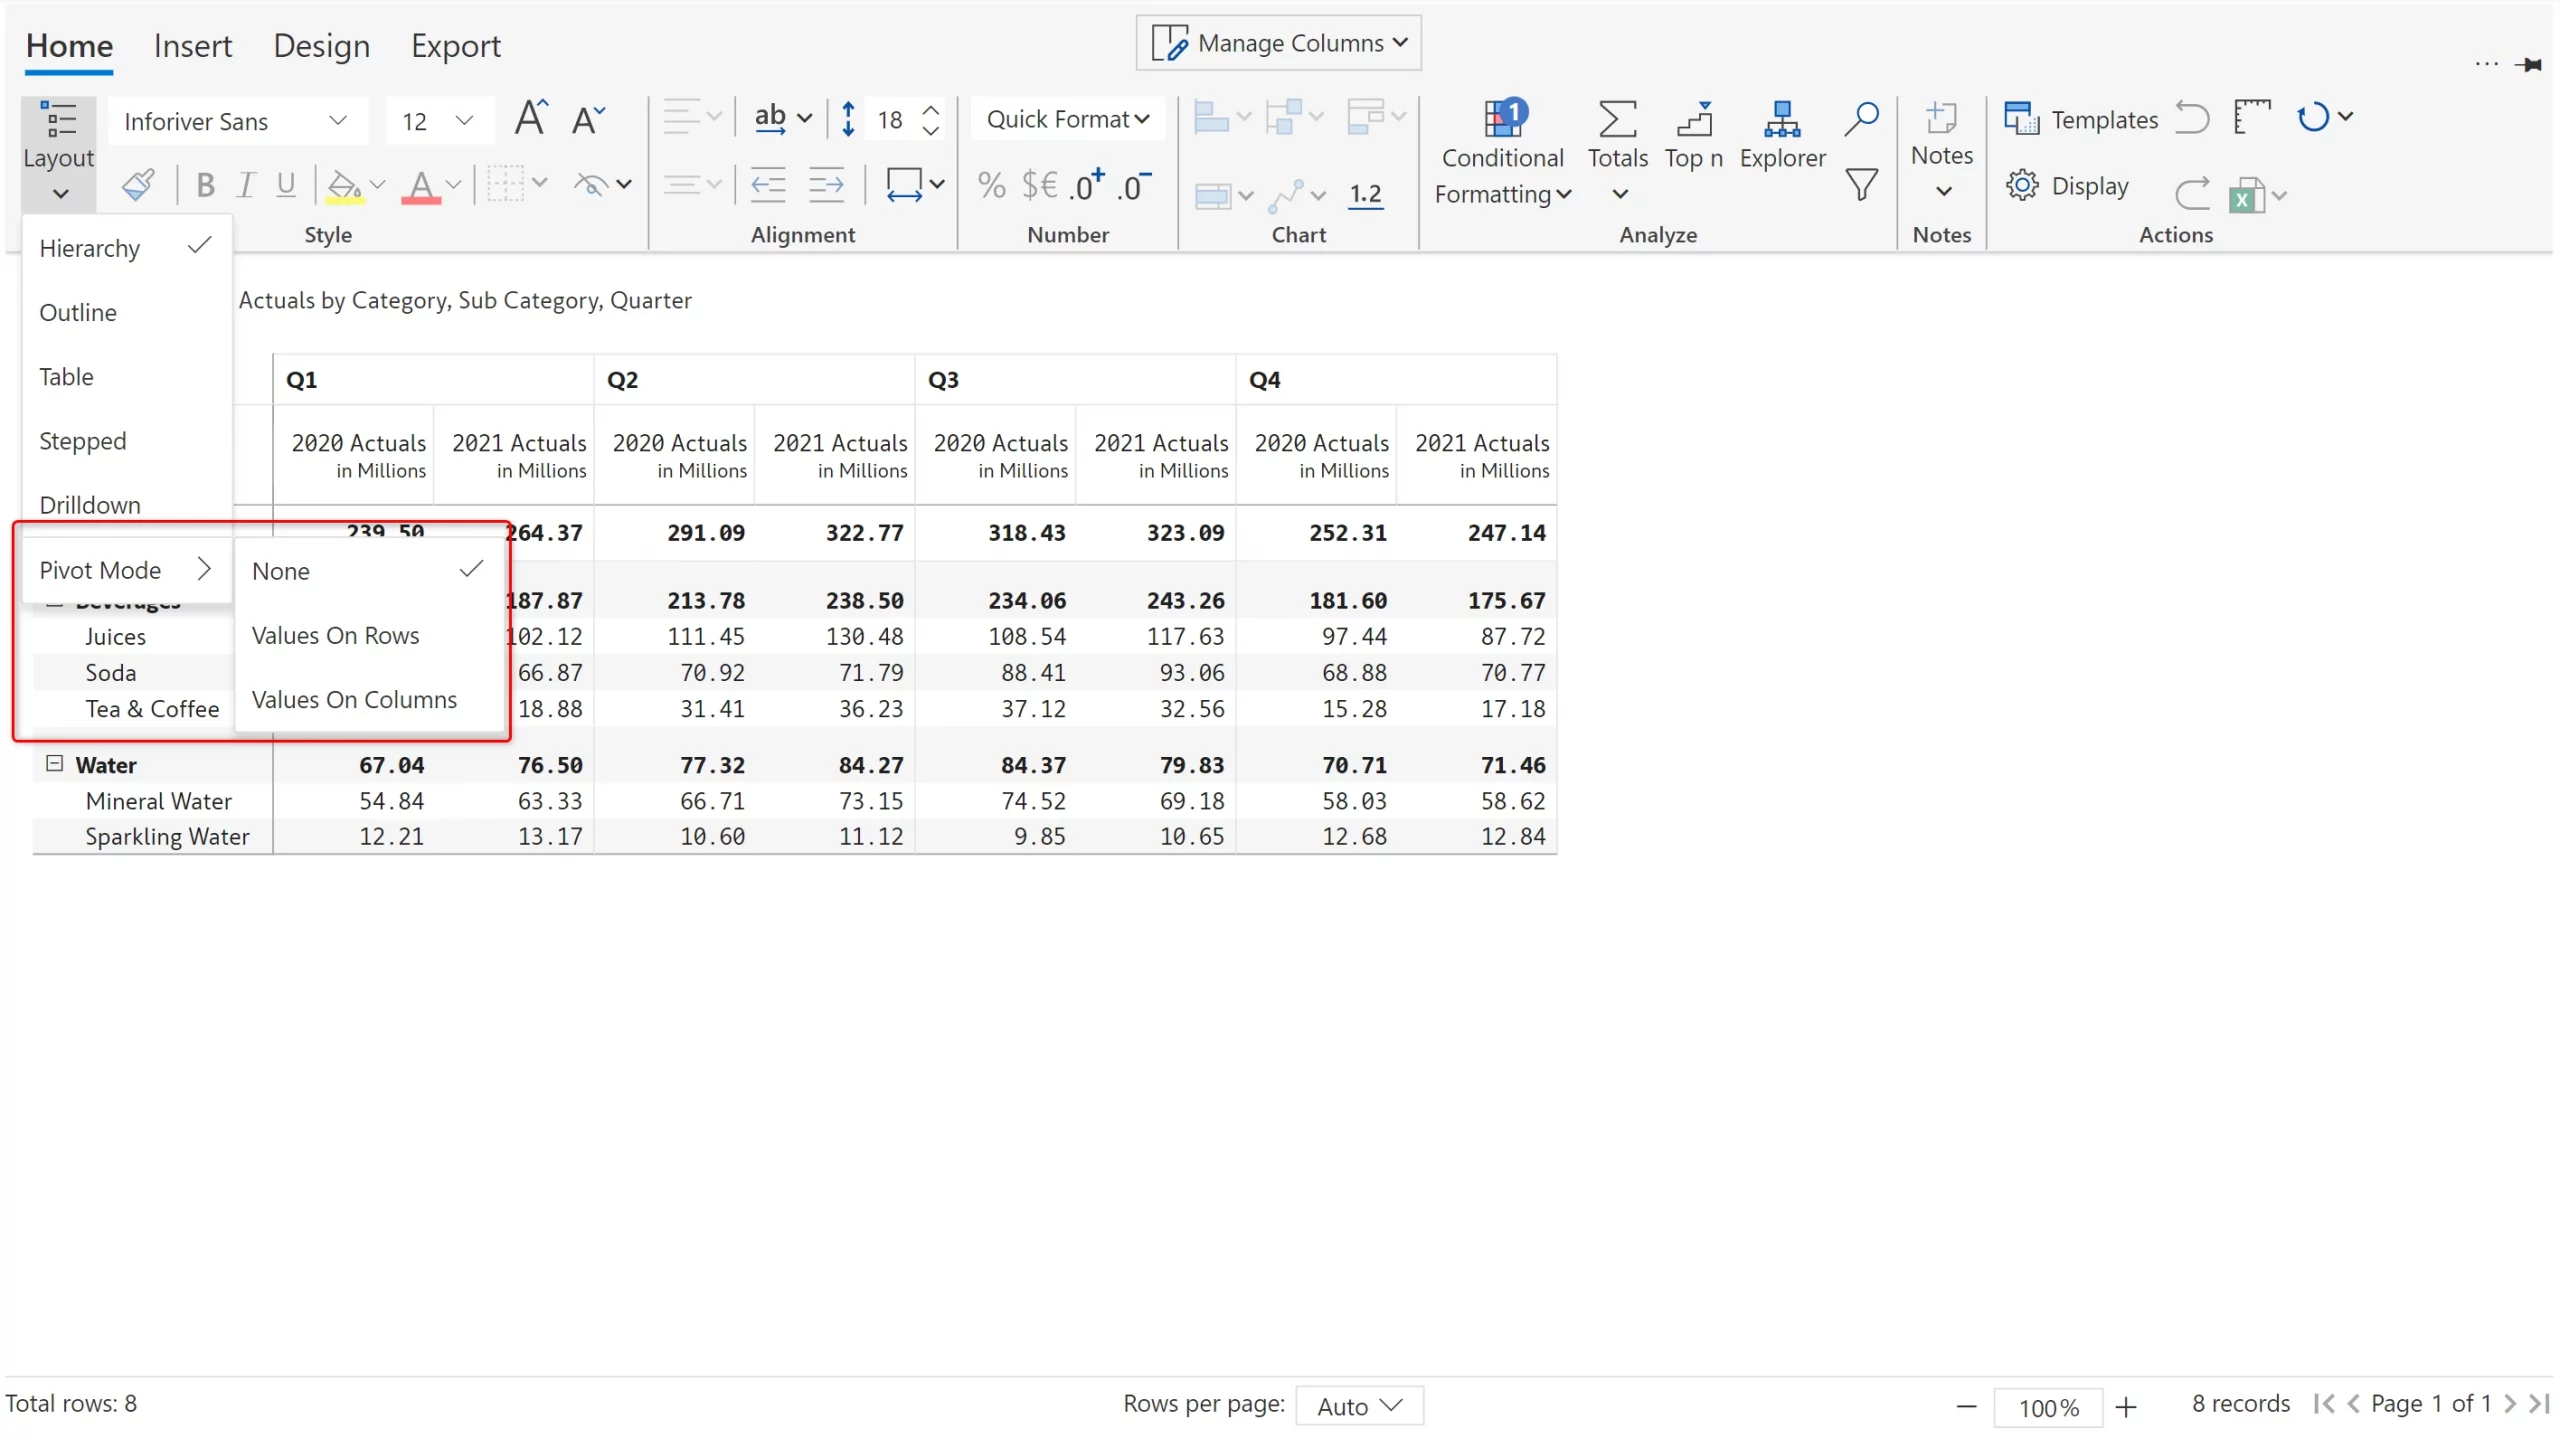
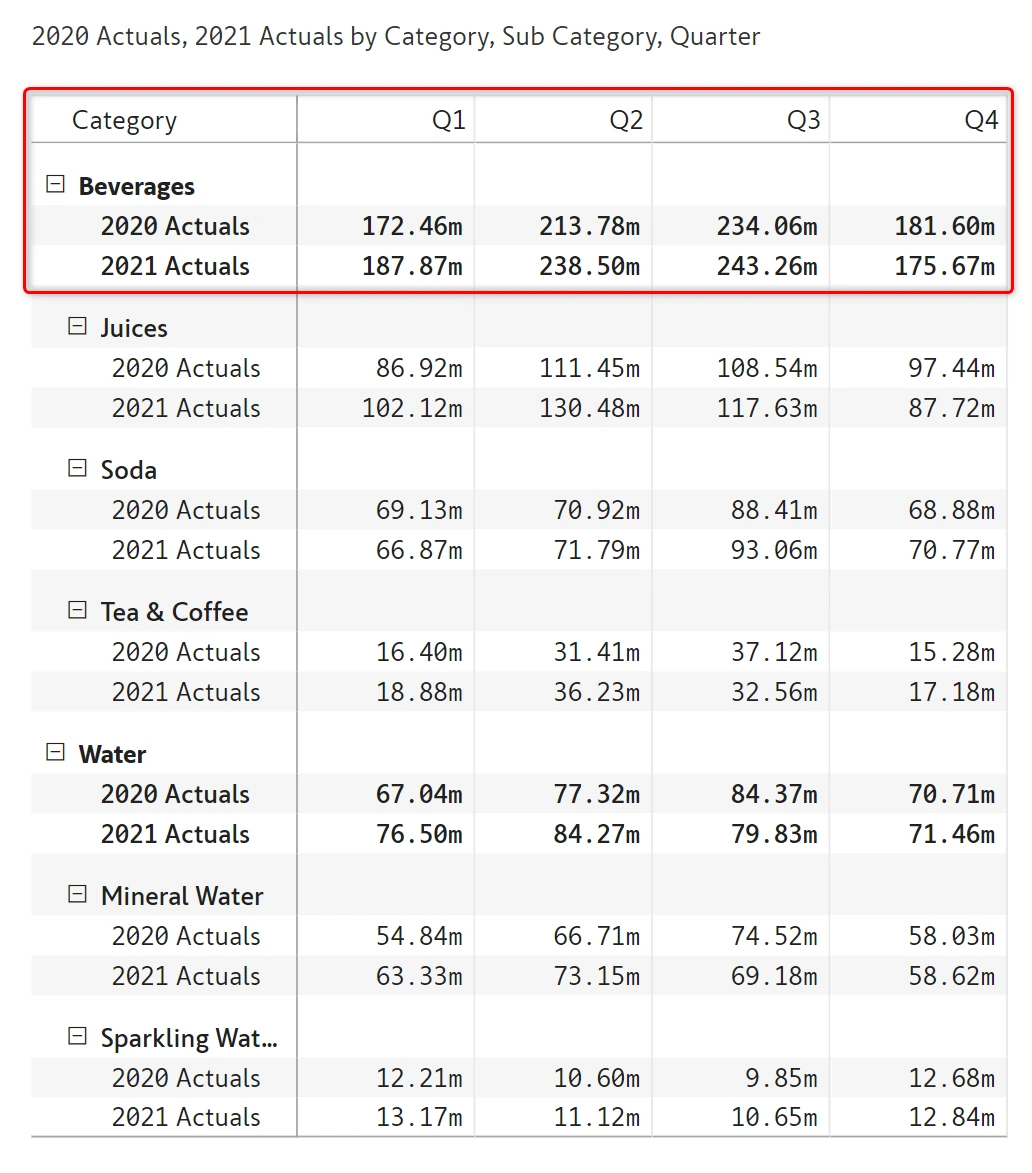
In this example, the matrix is configured with ‘Rows’ -> Category & Sub Category, ‘Columns’ -> Quarter and ‘Values’ -> 2021 Actuals and 2020 Actuals.
On selecting ‘Values on Rows’, the matrix gets transformed as shown below. The measures 2021 Actuals and 2020 Actuals are displayed under the Categories and Sub Categories as rows and the Quarters are displayed as columns.
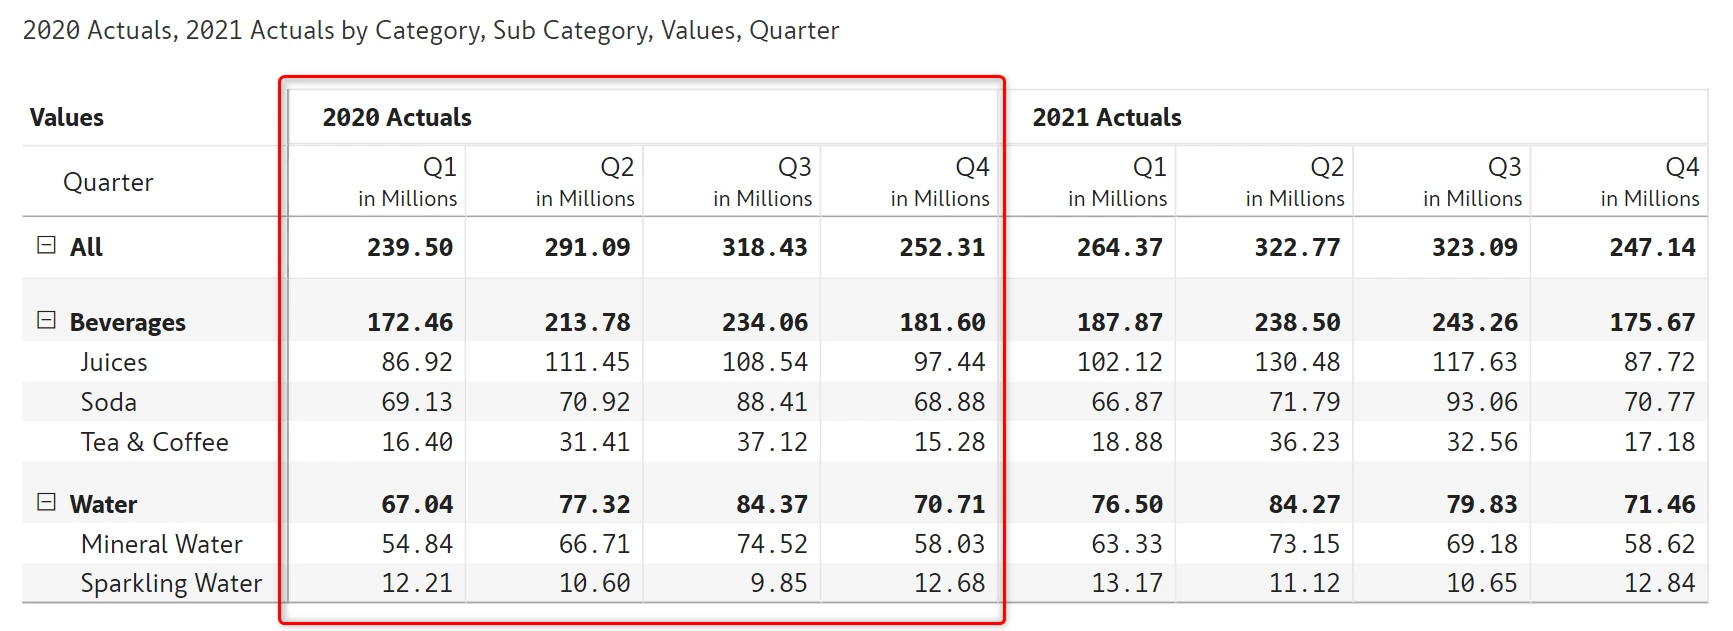
On selecting ‘Values on Columns’, the measures are grouped by quarters as shown below.
Note that you can apply Pivot Mode to any of the layout options – Hierarchy, Outline, Table and Stepped.
This is a very commonly requested feature for users looking to migrate their Excel Pivot tables to Power BI and this is not possible with calculation groups as well.
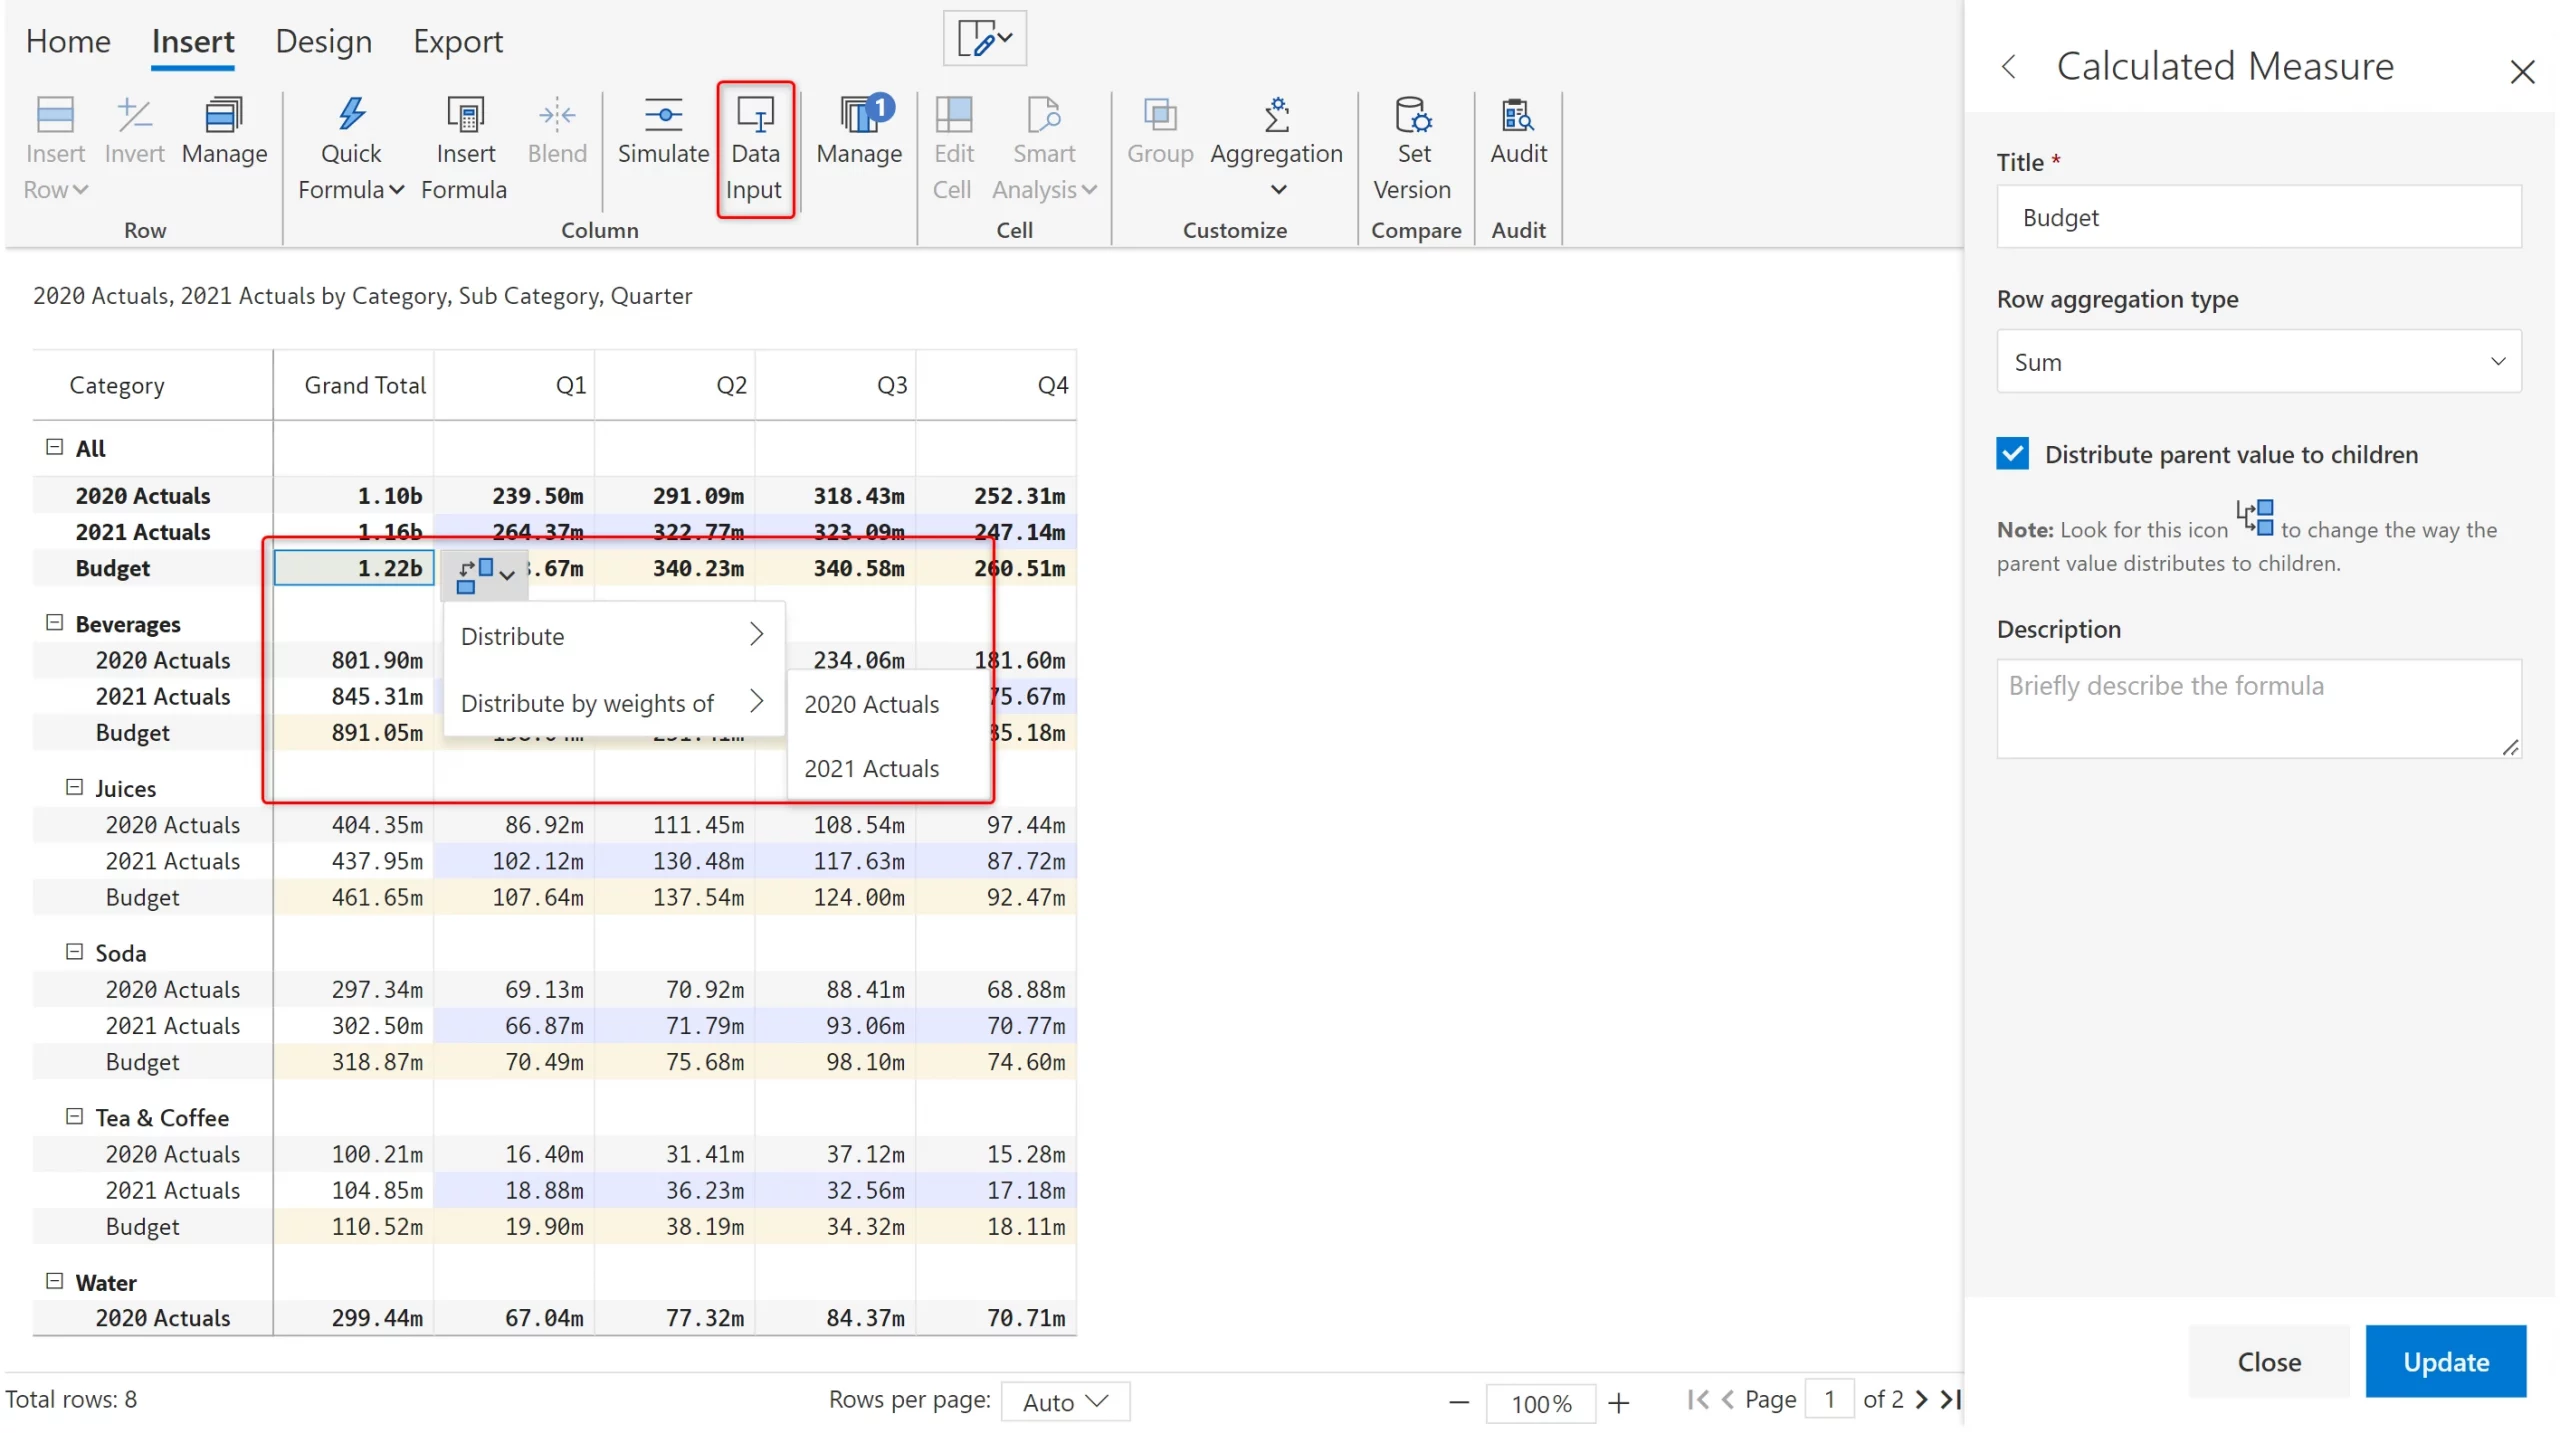
In ‘Pivot Mode’, when ‘Values on Rows’ is enabled – you can insert a measure using manual data input and perform allocations.
In the below example, a budget is created and the input 1.22 billion is allocated based on prior year actuals.
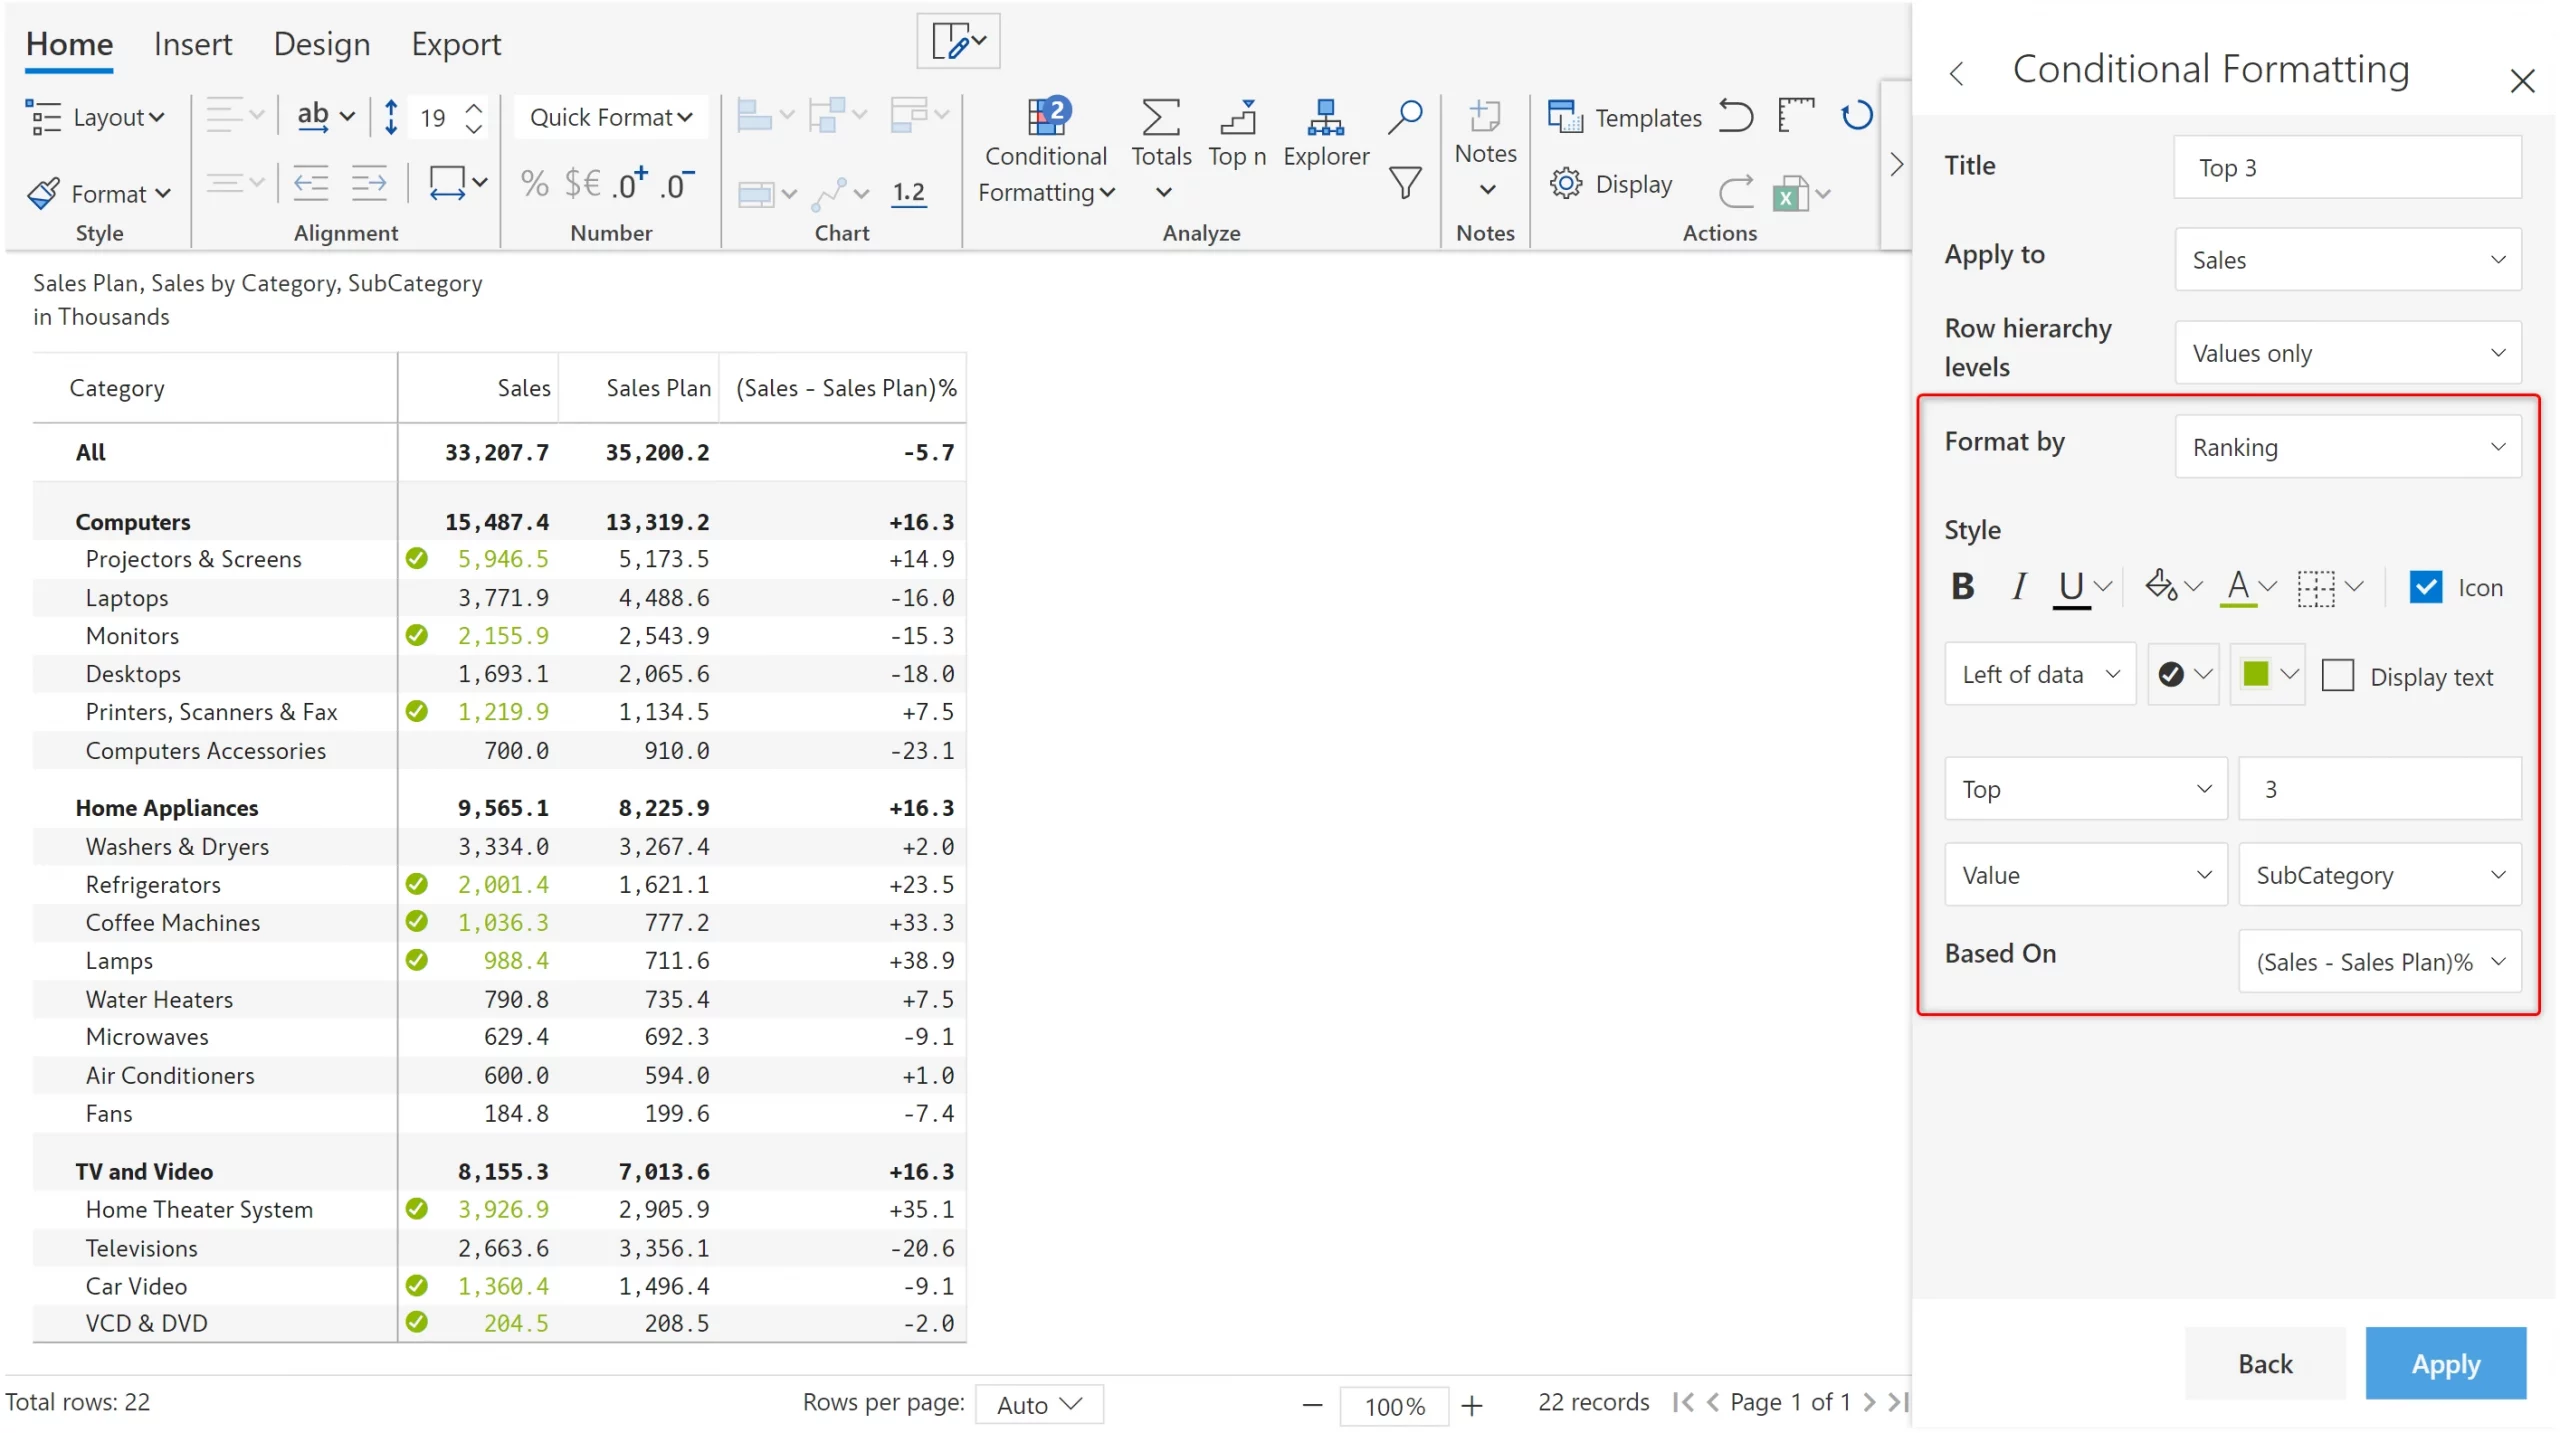
In addition to Rules, Color Scale and Classification, v1.7 introduces conditional formatting based on Ranking.
In this example, sales for the top 3 sub categories in each category are formatted using style and icons based on (Sales – Sales Plan) %.
The Mixed Layout offers the benefits of the Hierarchy and Stepped layouts. You can choose to visualize important fields as separate columns resulting in a compact but detailed matrix.
In the below example, Category, Sub Category and Region are represented as a hierarchy with the Sub Region as a separate column.
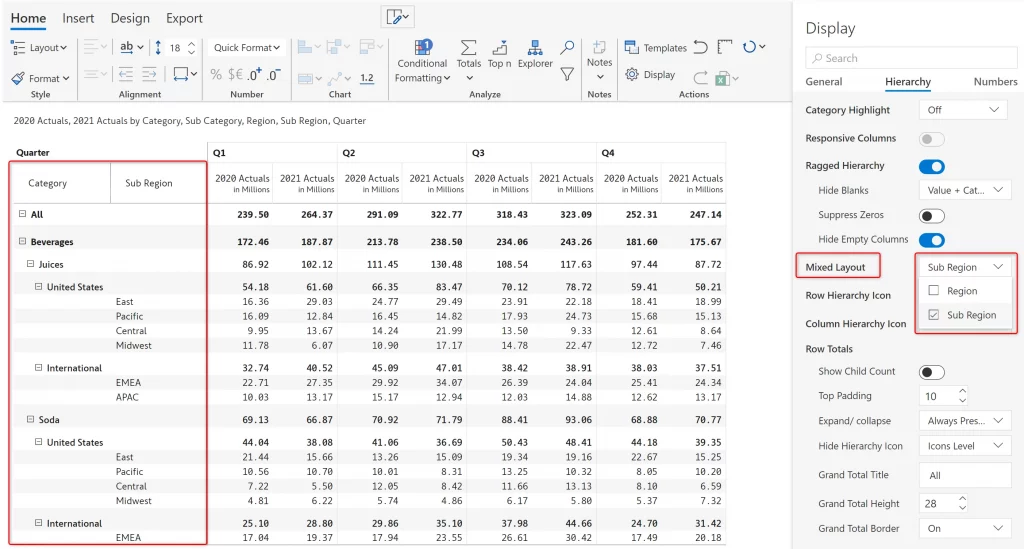
This mixed layout option is available when you have 3 or more hierarchy levels and can be enabled by going into Display –> Hierarchy.
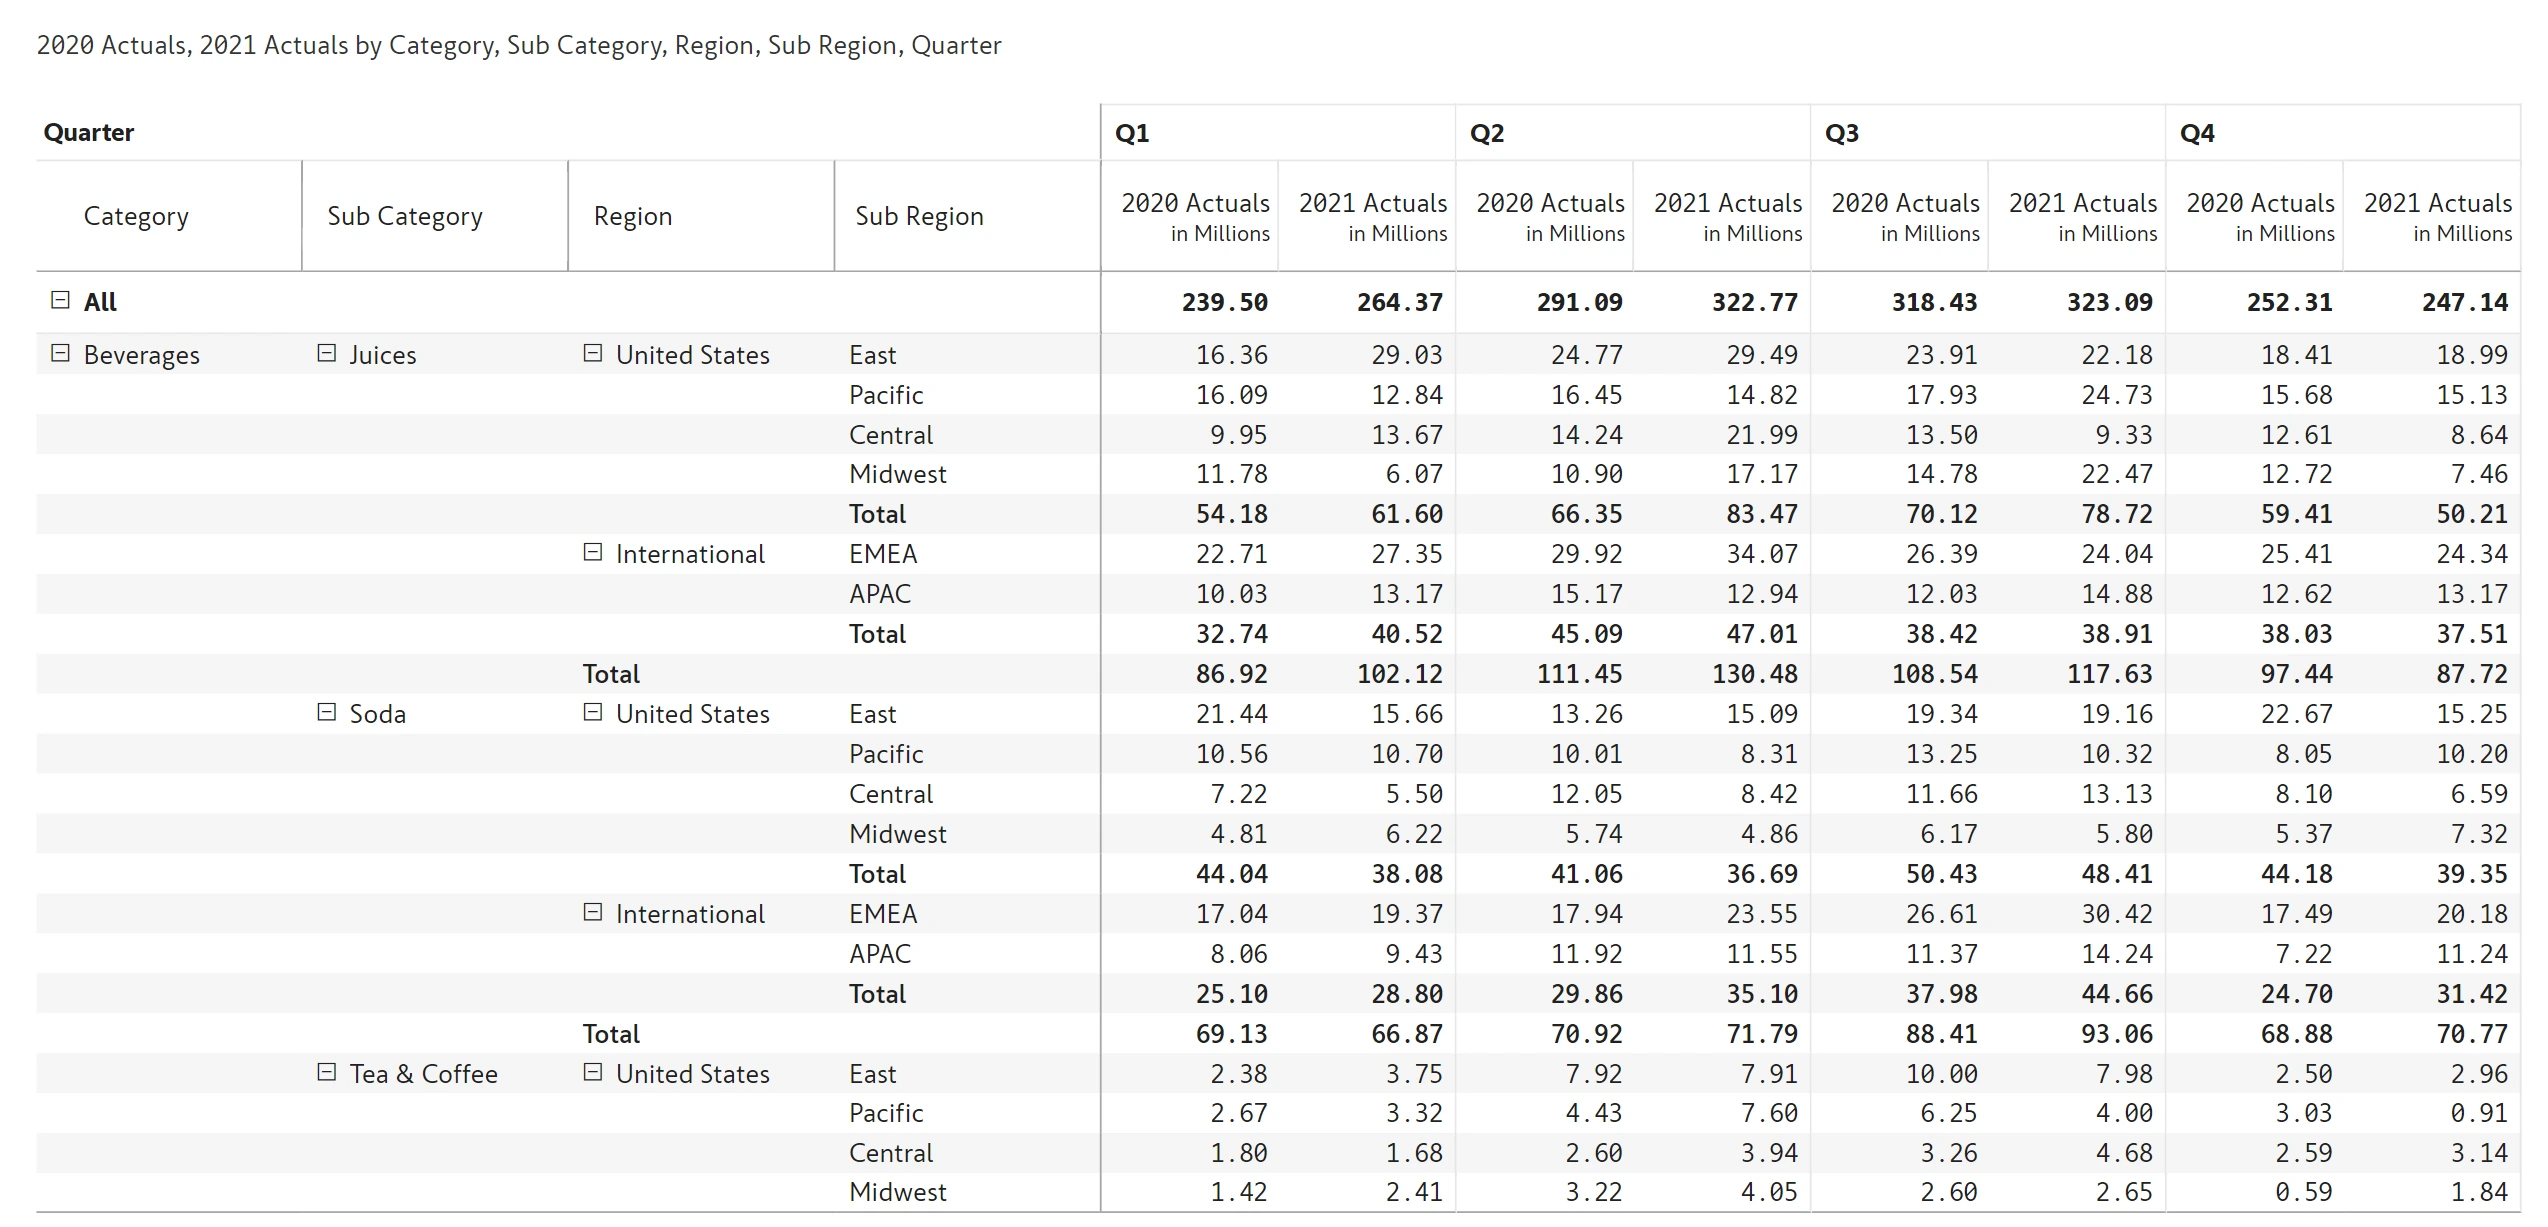
For reference, the same table using a Stepped layout is shown below which results in 4 columns.
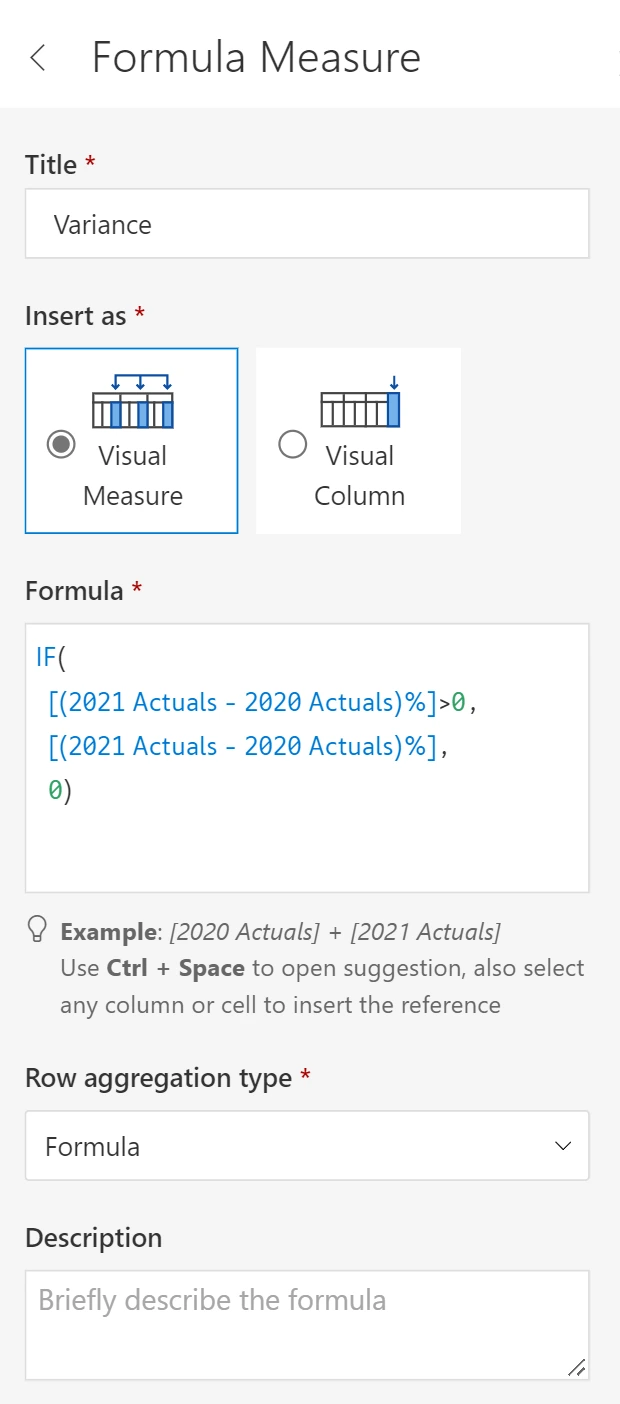
The formula editor provides multiline support to help users successfully read, create, and troubleshoot formulas, especially nested formulas.
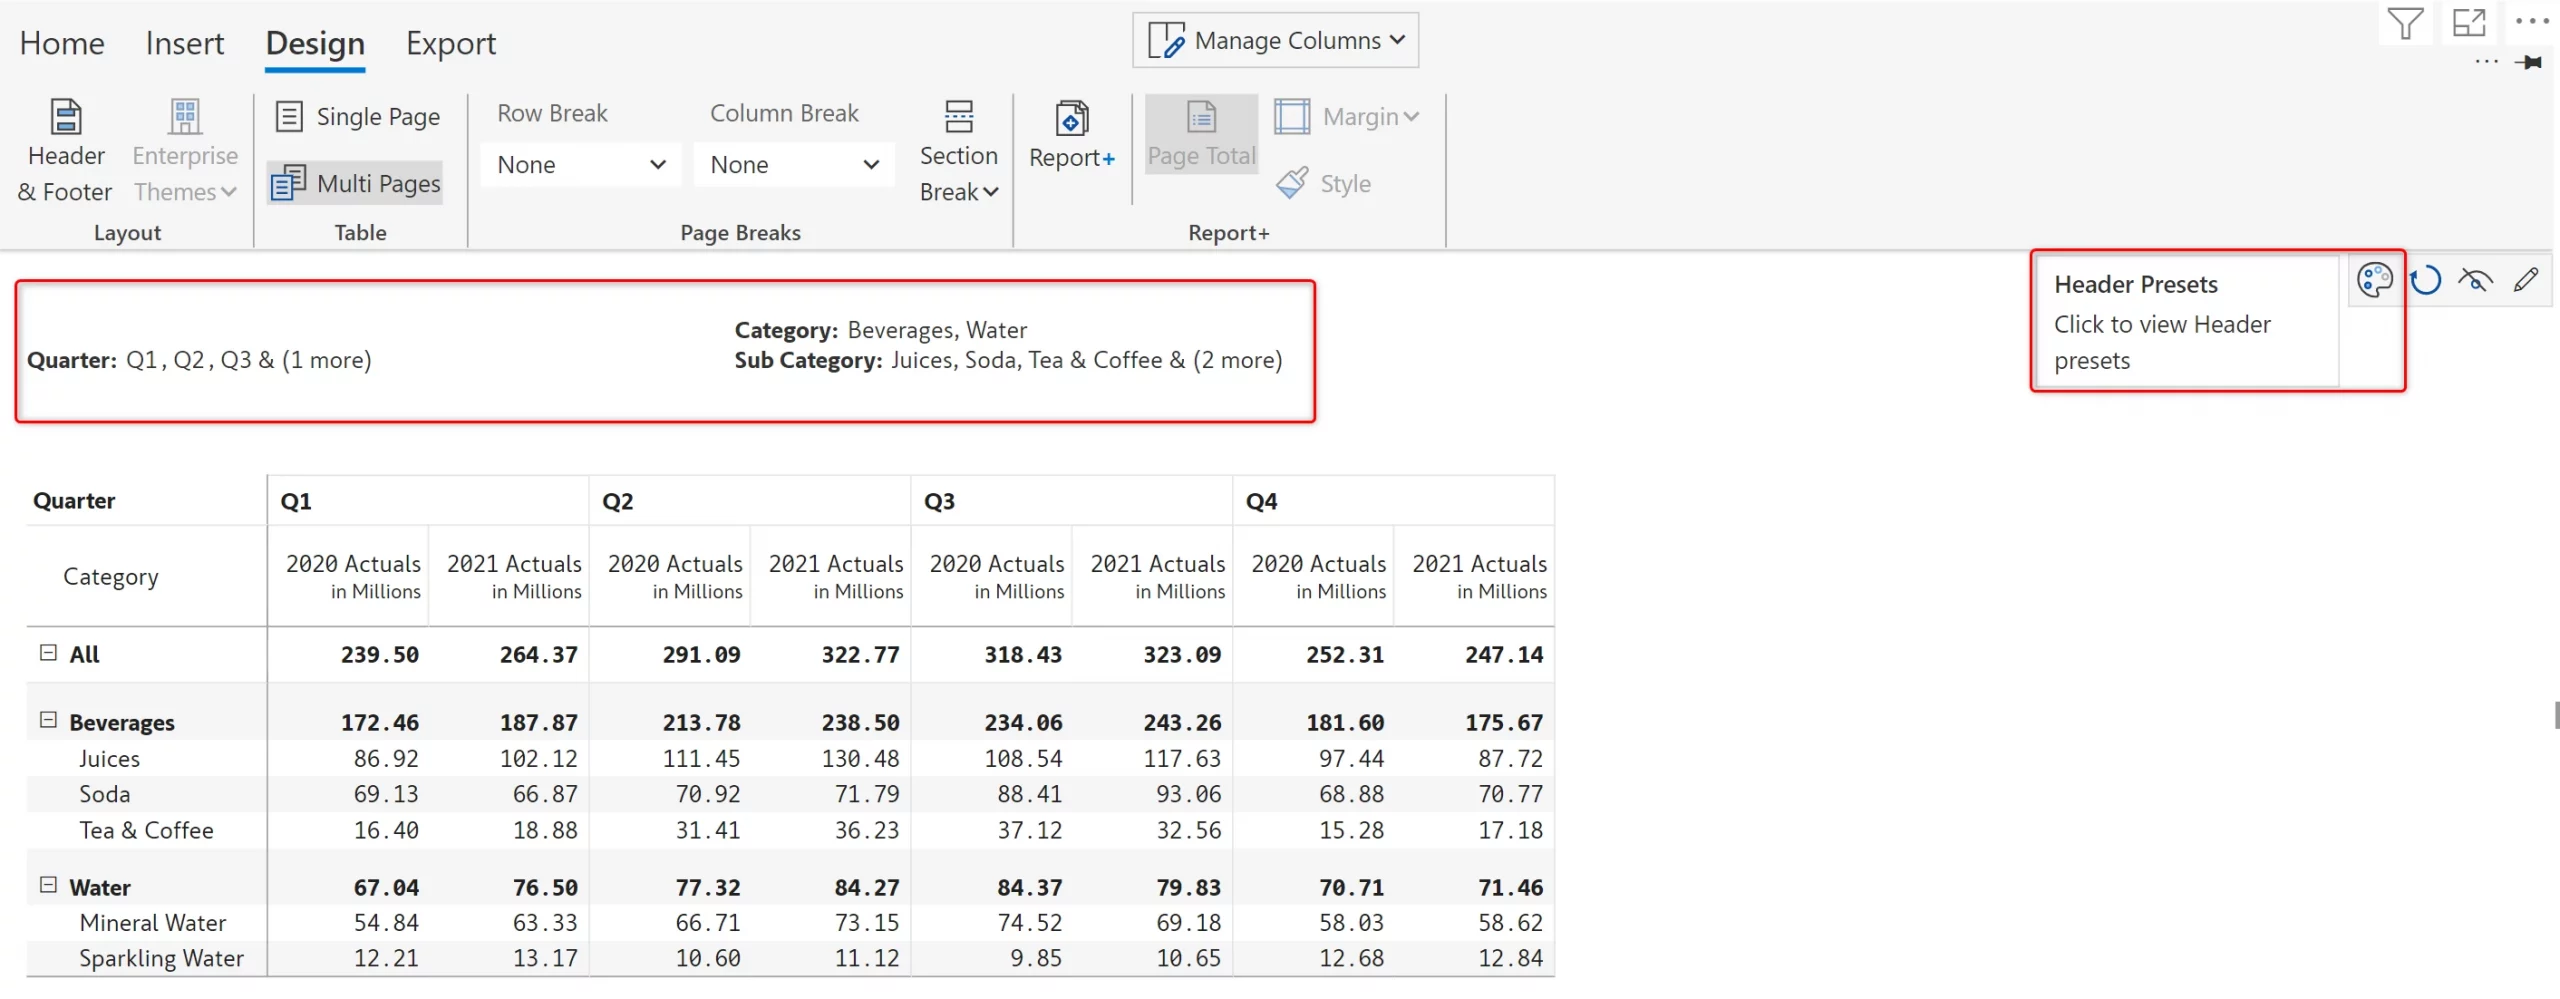
V1.7 introduces a header preset which displays the column and row dimensions. After selecting a preset, you can continue to edit the containers by including charts or KPI etc.

The below image shows the column and row fields. Header presets are also accessible using the icon as highlighted in the right.
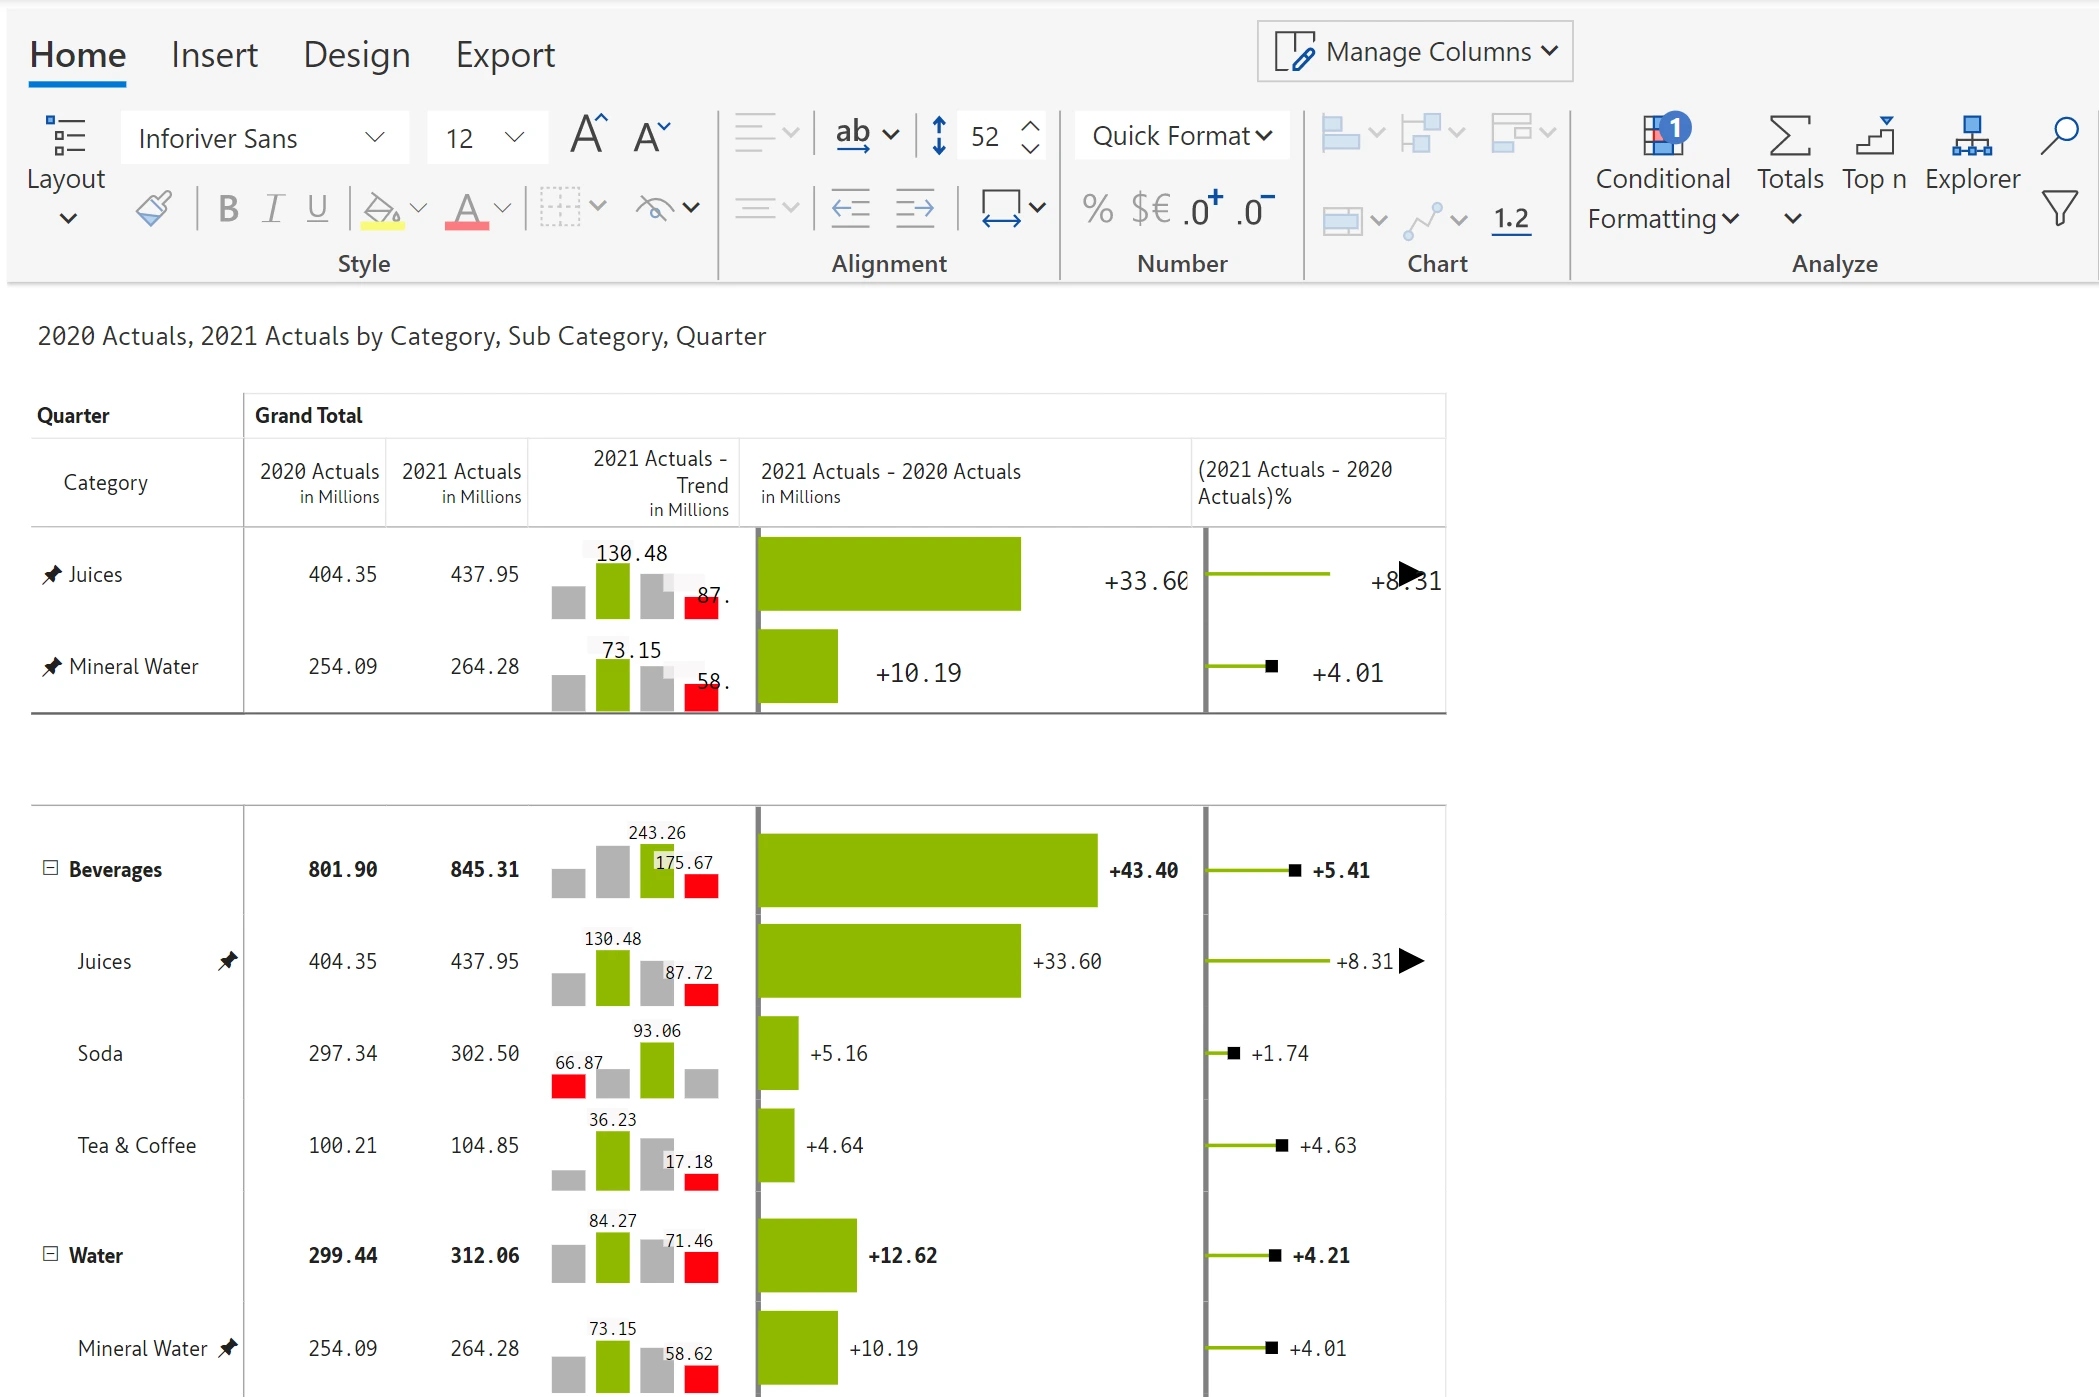
Based on popular demand, we have introduced row pinning even when charts are included in the visual as shown in the below image.
In addition to these features and enhancements, we also have several important bug fixes as part of this release.
Most importantly – Inforiver default font has been changed to Inforiver Sans Font and it is in the same font family as Power BI default font “Segoe” but is monospaced for better alignment and readability in financial reports.
Note: Version 1.7 is currently available only in our website and it would take about 2 weeks in the AppSource.
You can now purchase Inforiver Premium directly from Microsoft without having to onboard as a vendor with your credit card or invoice/PO method.
We'd love to hear your ideas for Inforiver – be it a cool new feature or an improvement on existing features. Visit the Inforiver Community to share your ideas, vote on other submissions, and interact with other users.

Inforiver helps enterprises consolidate planning, reporting & analytics on a single platform (Power BI). The no-code, self-service award-winning platform has been recognized as the industry’s best and is adopted by many Fortune 100 firms.
Inforiver is a product of Lumel, the #1 Power BI AppSource Partner. The firm serves over 3,000 customers worldwide through its portfolio of products offered under the brands Inforiver, EDITable, ValQ, and xViz.