Upcoming webinar on 'Inforiver Charts : The fastest way to deliver stories in Power BI', Aug 29th , Monday, 10.30 AM CST. Register Now
Upcoming webinar on 'Inforiver Charts : The fastest way to deliver stories in Power BI', Aug 29th , Monday, 10.30 AM CST. Register Now
Welcome to the Inforiver Matrix July 2022 update. We are thrilled to announce several new features and key enhancements (for all the editions) most anticipated by our Inforiver community!
Note: Version 1.6 will be released on the website this Sunday, 24th July so as to minimize the impact of downtime.
Key enhancements in this 1.6 release include:
Let us look at these updates in detail.
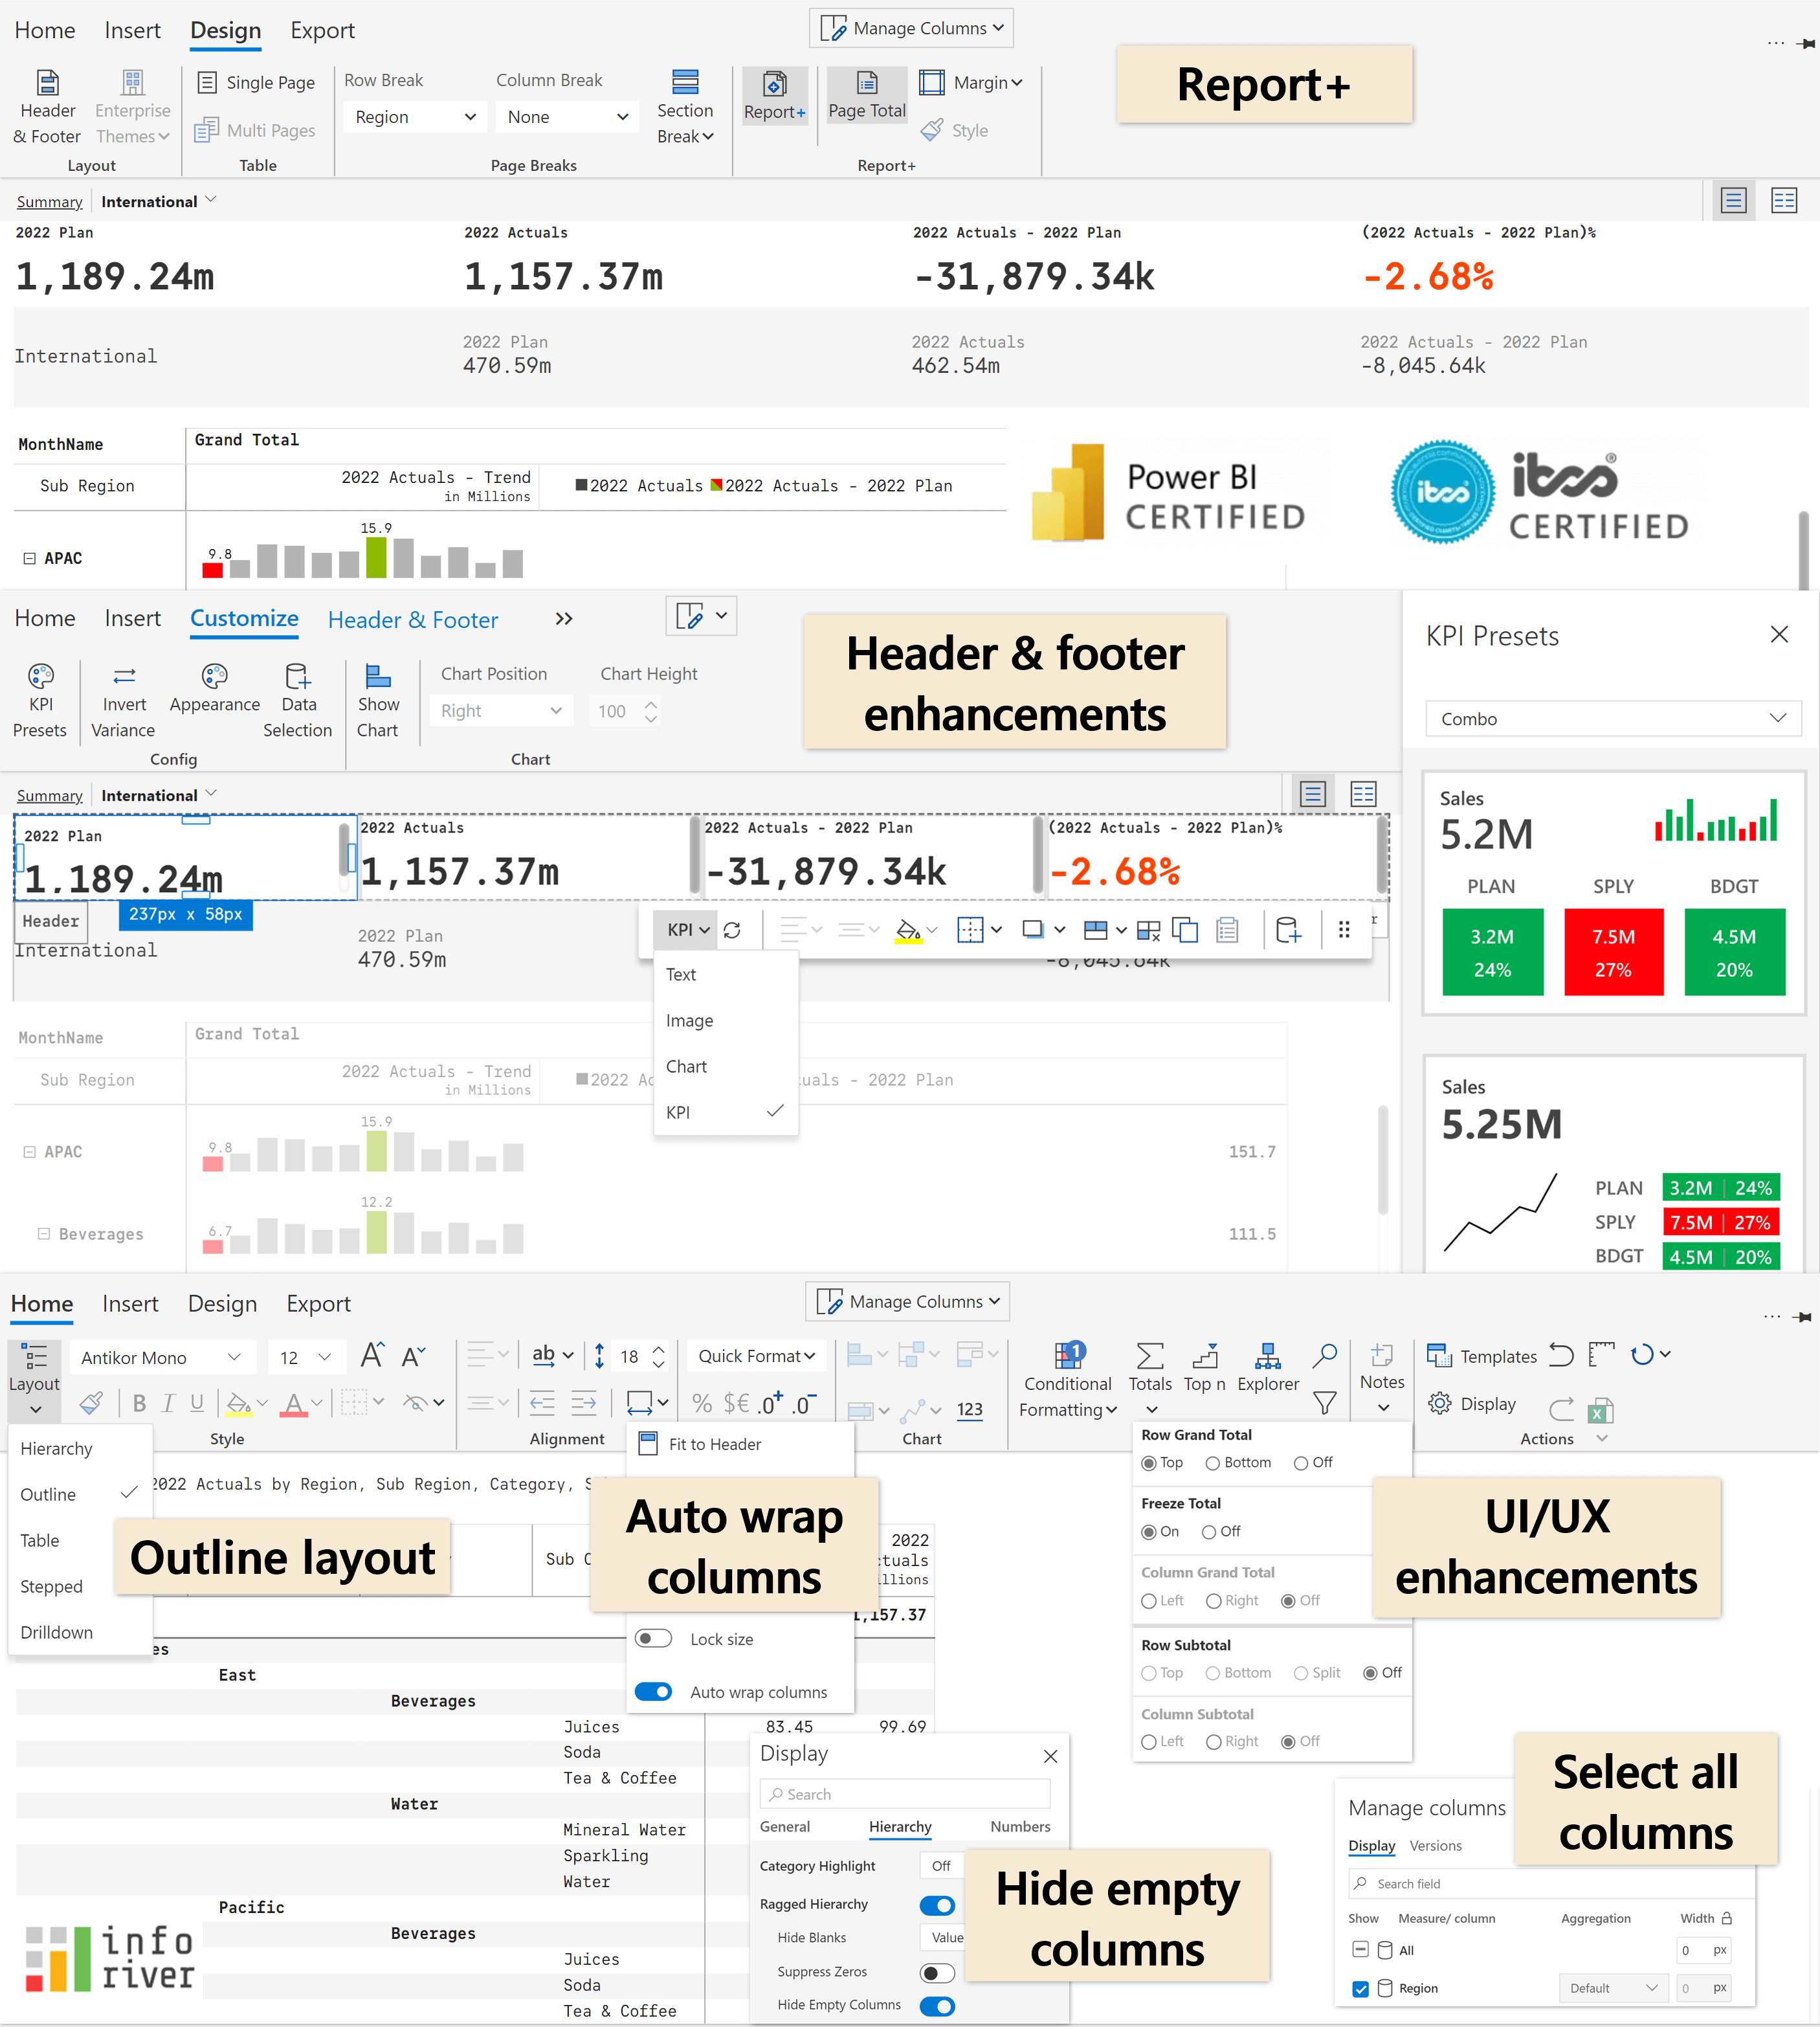
With Report+, you can build no-code paginated reports using preset designs, header/footer formatting capabilities, row/column/section breaks, summary/list/comparison views and more in a matter of minutes. These reports can be exported as PDF or broadcasted at desired frequencies using the Scheduler (available in Inforiver Enterprise).

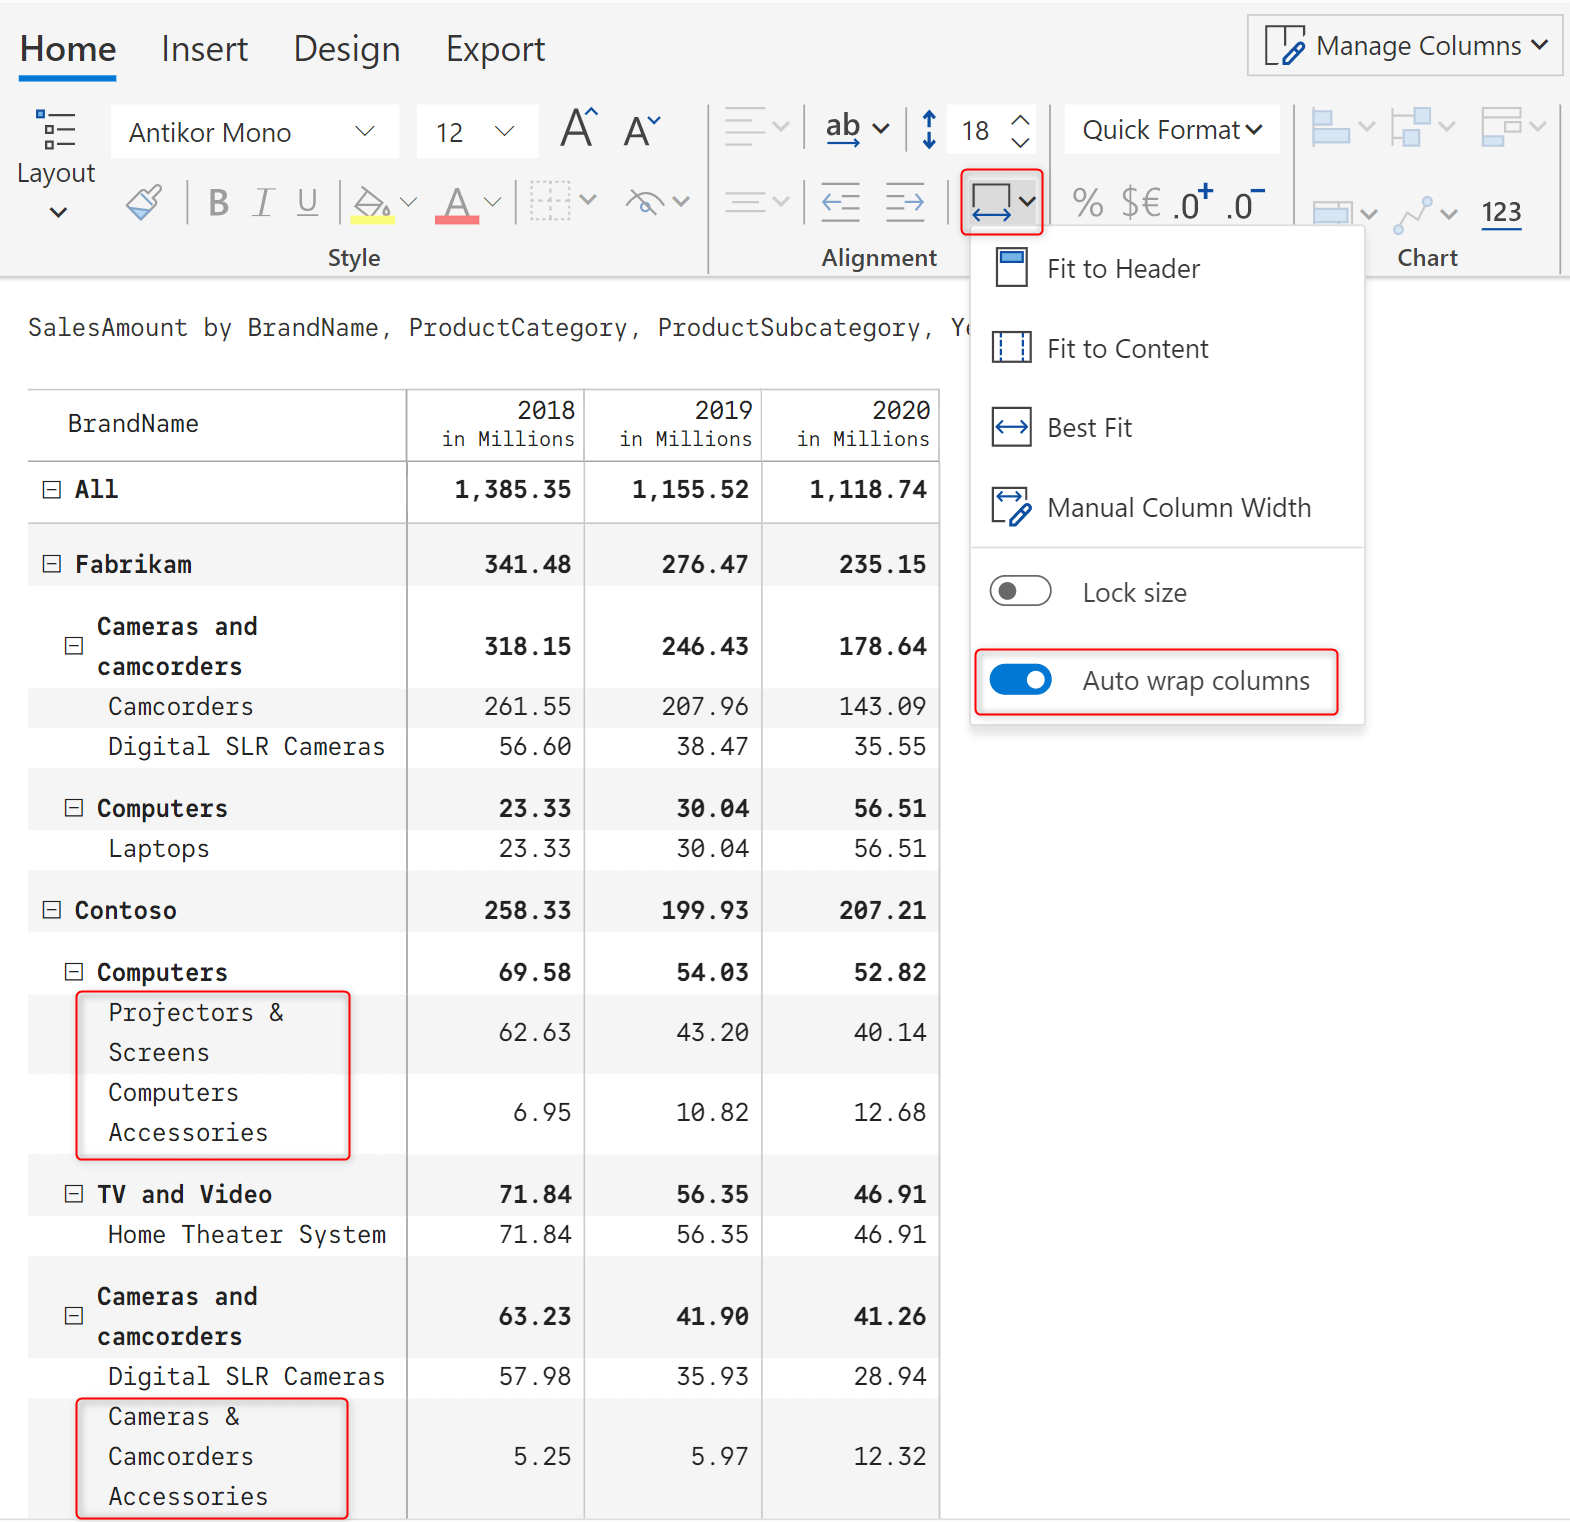
One of the most widely requested features, auto wrap of columns is now available in version 1.6. Under Alignment, Auto Fit – we now have an option ‘Auto wrap columns’ which automatically adjusts the row height based on the content. This is especially useful when using Inforiver in a smaller form factor, when there are too many columns in your table or when there are fields with long textual content.
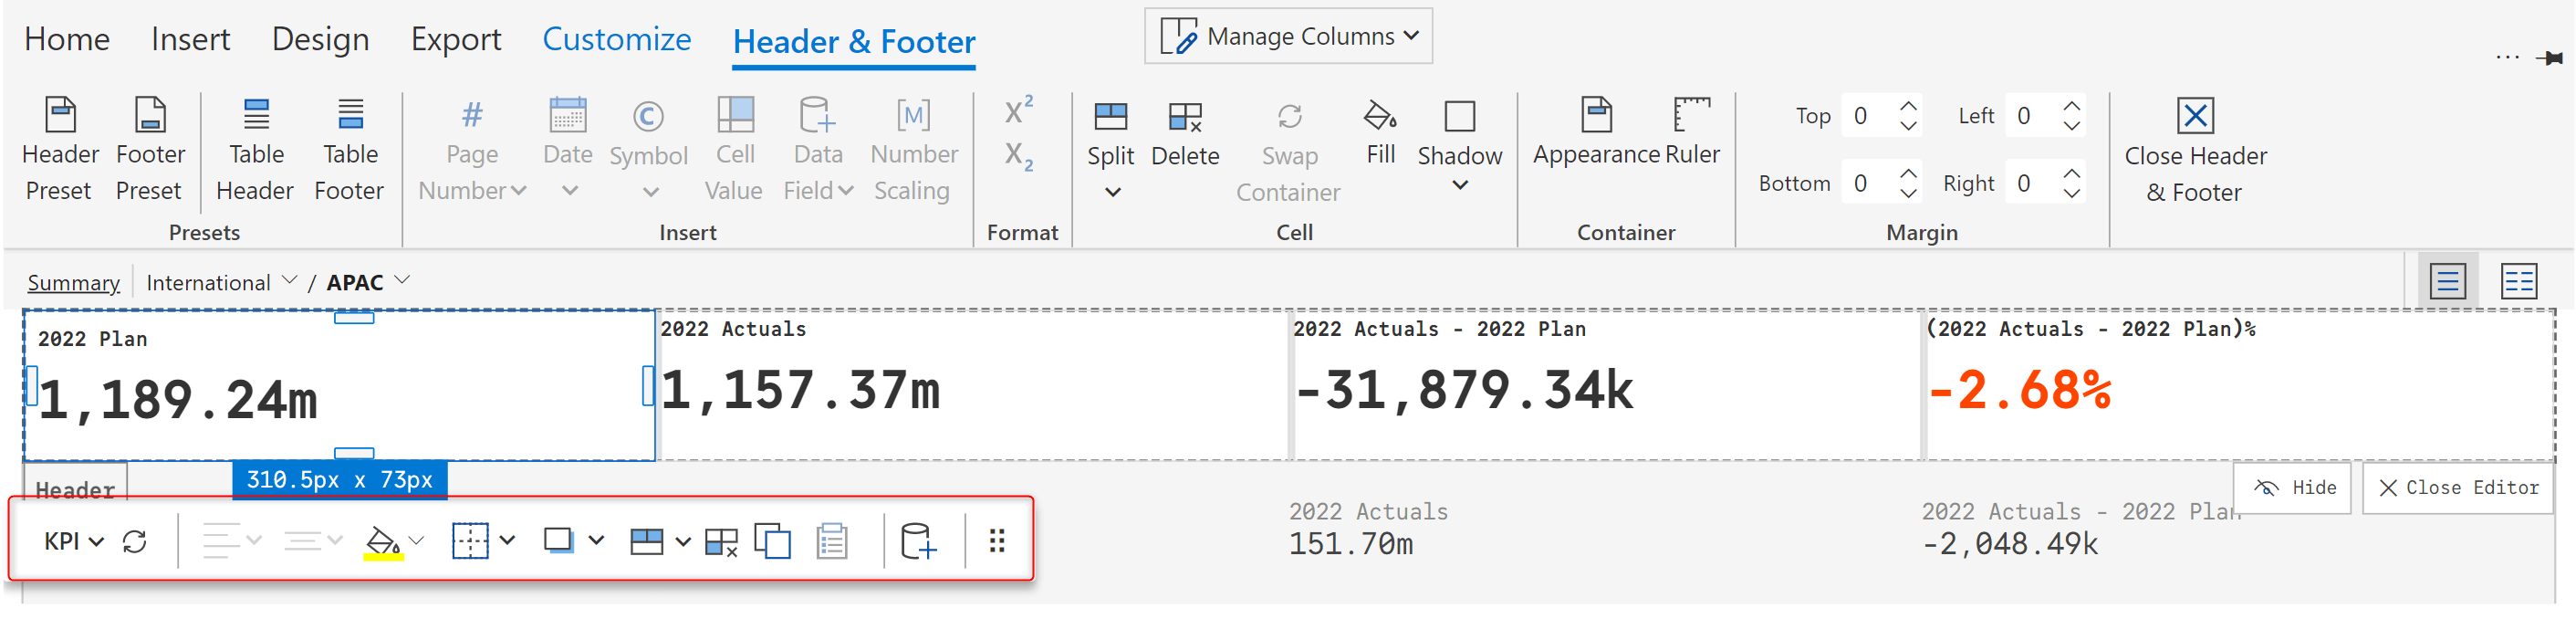
There are several key enhancements to the headers and footers.
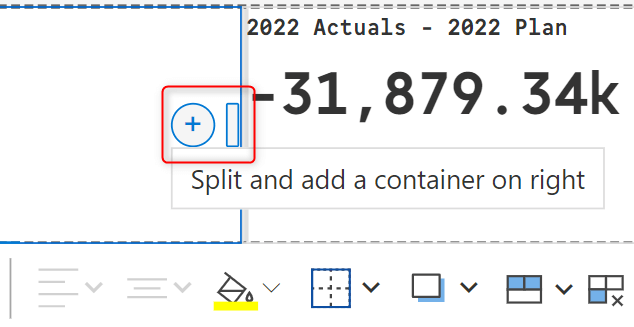
In addition to text and images, we have an option to insert KPI cards as part of the header. Several customizations are also possible – fill color, border, shadow, container options such as split, delete and copy. Using the data selection option, you can select the data to be displayed.
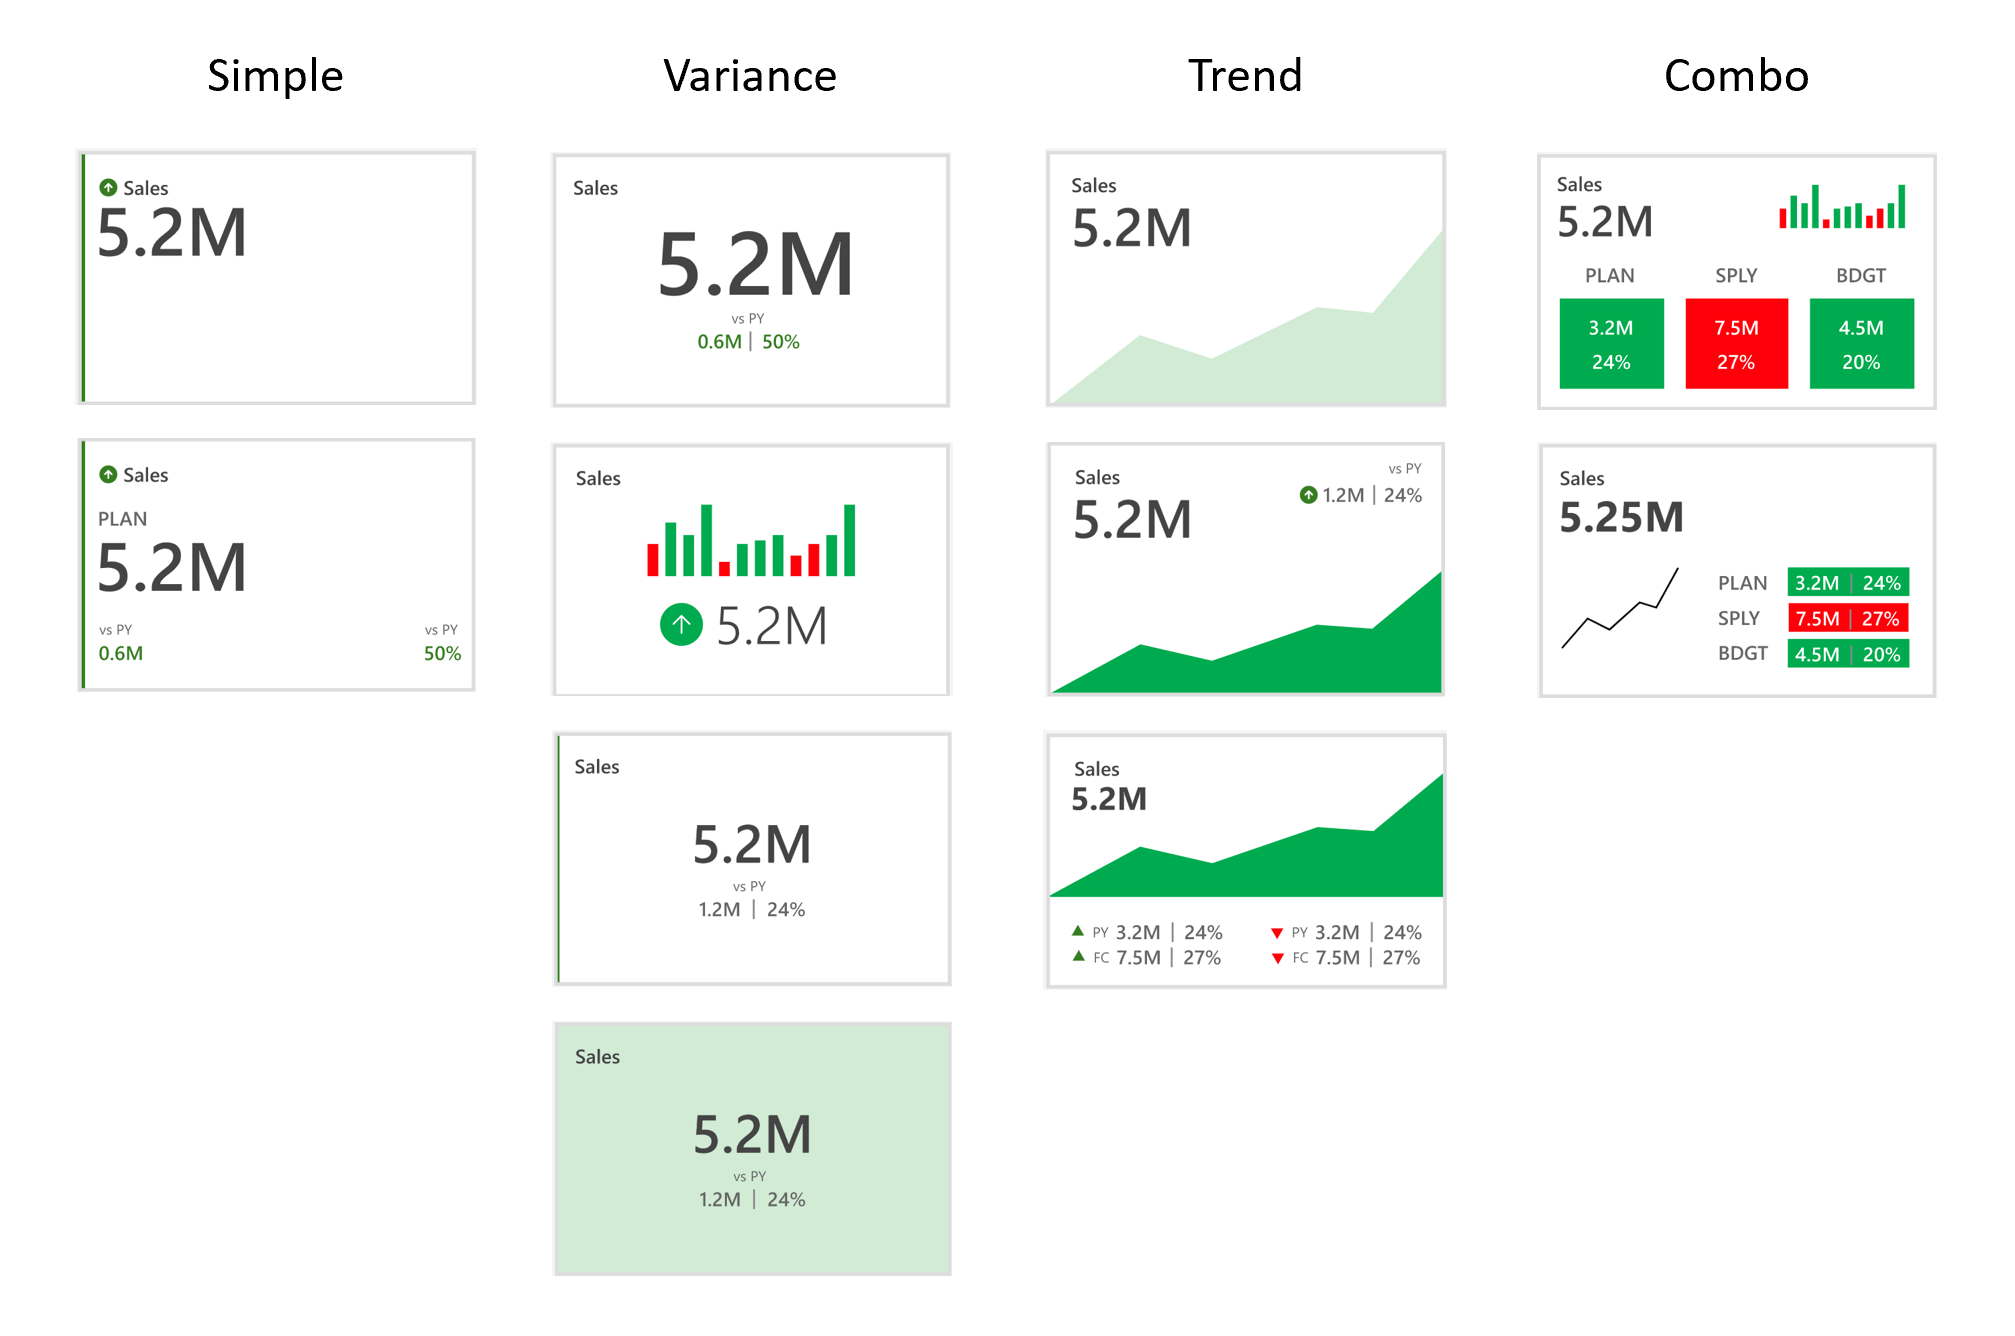
KPI Presets are available under the categories – Simple, Variance, Trend and Combo and they are shown below.
In addition to KPI cards, you can also enrich your headers by using charts. Select the data using ‘Data Selection’ and choose a chart type from the options. Several customization options are available as shown below.

There are few other enhancements
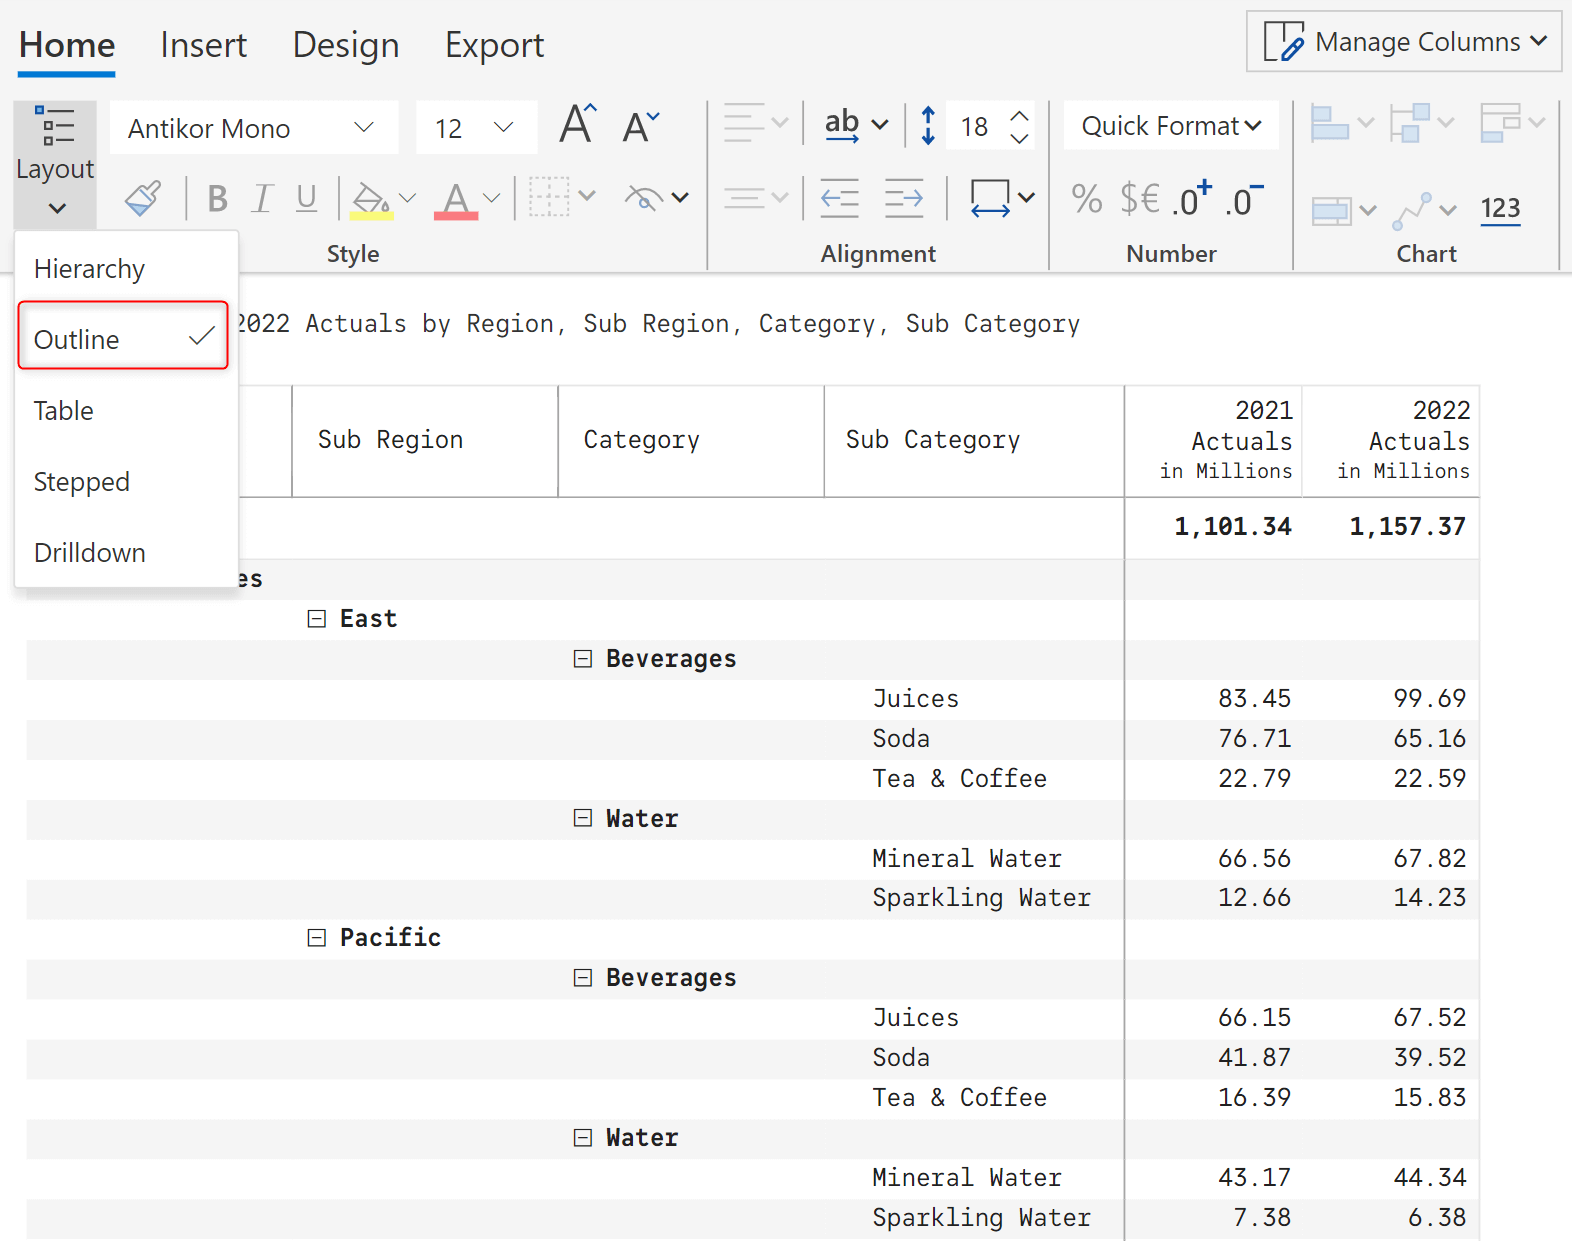
In addition to the four layouts available earlier, there is a newly introduced ‘Outline Layout’.
This is very similar to the Stepped Layout in Excel but without the subtotals. With this new layout option – we are able to support all the pivot table layouts that are possible with Microsoft Excel and in a single click.
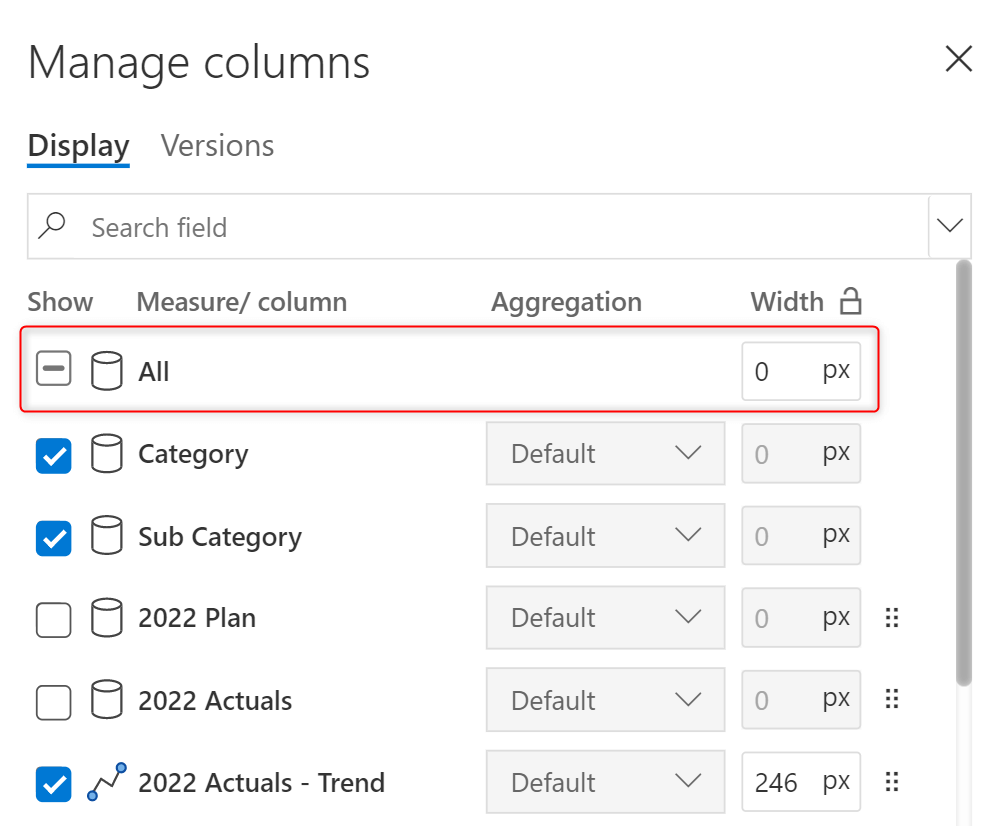
Yet another widely requested feature that is part of the 1.6 release is the ability to quickly select/unselect all the columns using ‘Manage Columns’. This feature will allow users to quickly set uniform column widths for all columns in one go.
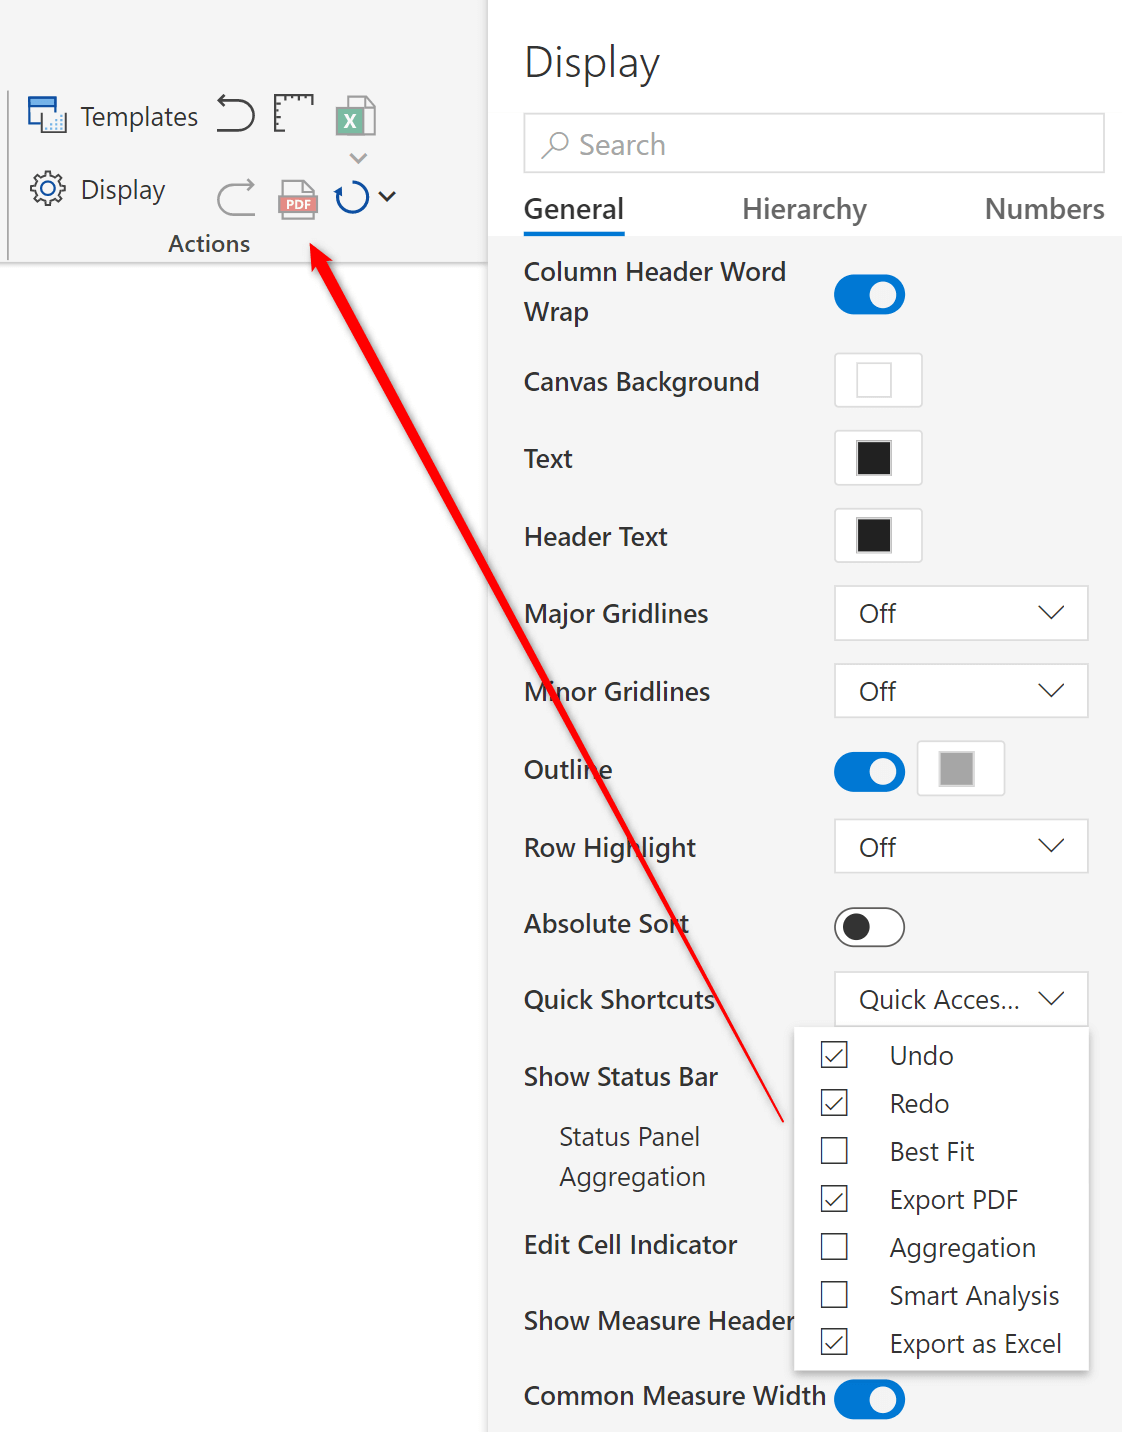
Quick access section can be customized in the Display settings. You can choose a maximum of 6 options from the listed options.
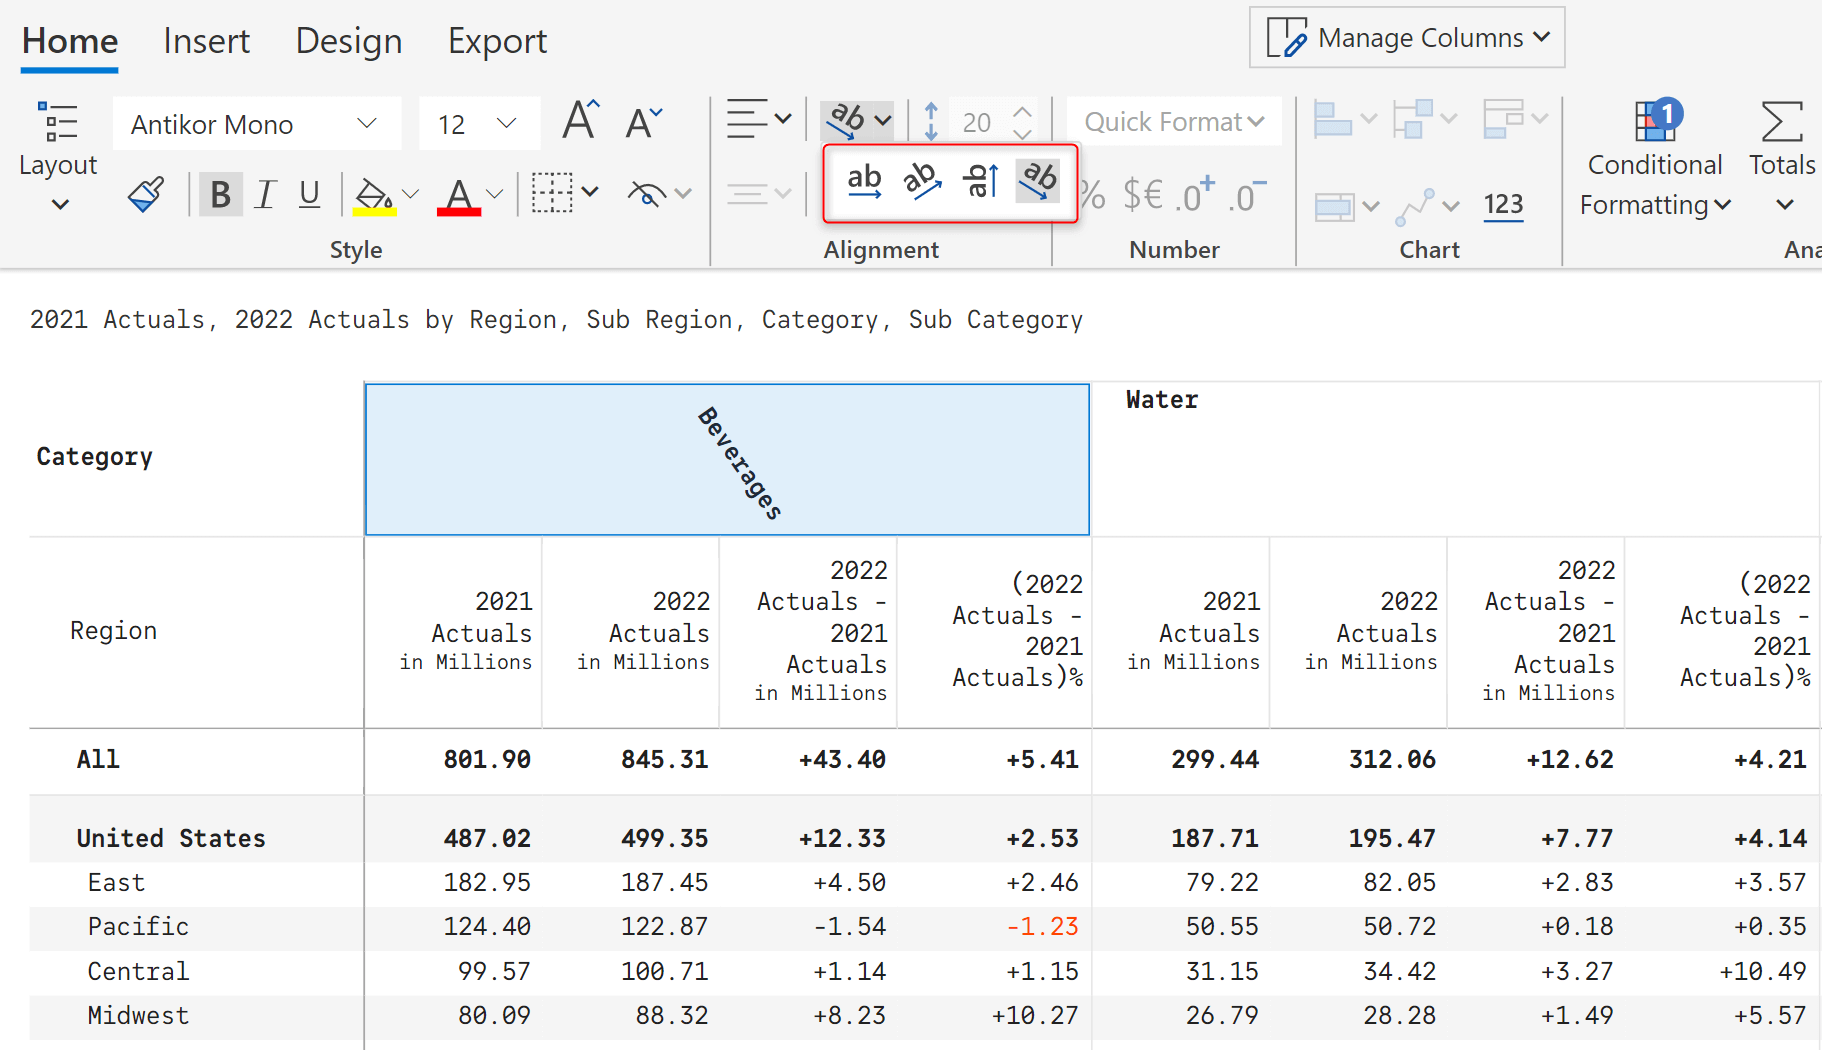
Earlier, column header rotation was not applicable to the category fields in columns. In version 1.6, support for column header label rotation for hierarchy/column fields is introduced.
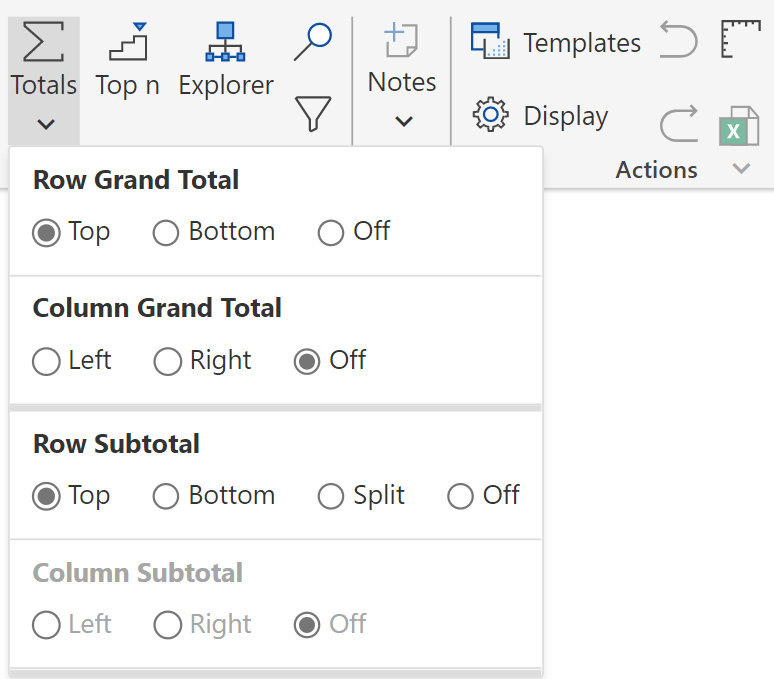
Total/Subtotals customization options have been enhanced to accommodate in a single dialog box. You can turn on/off and change positions as shown below.
Best fit automatically adjusts the row height depending on the content for e.g., to 14 in case of numeric values and 55 in case of bullets & sparklines.

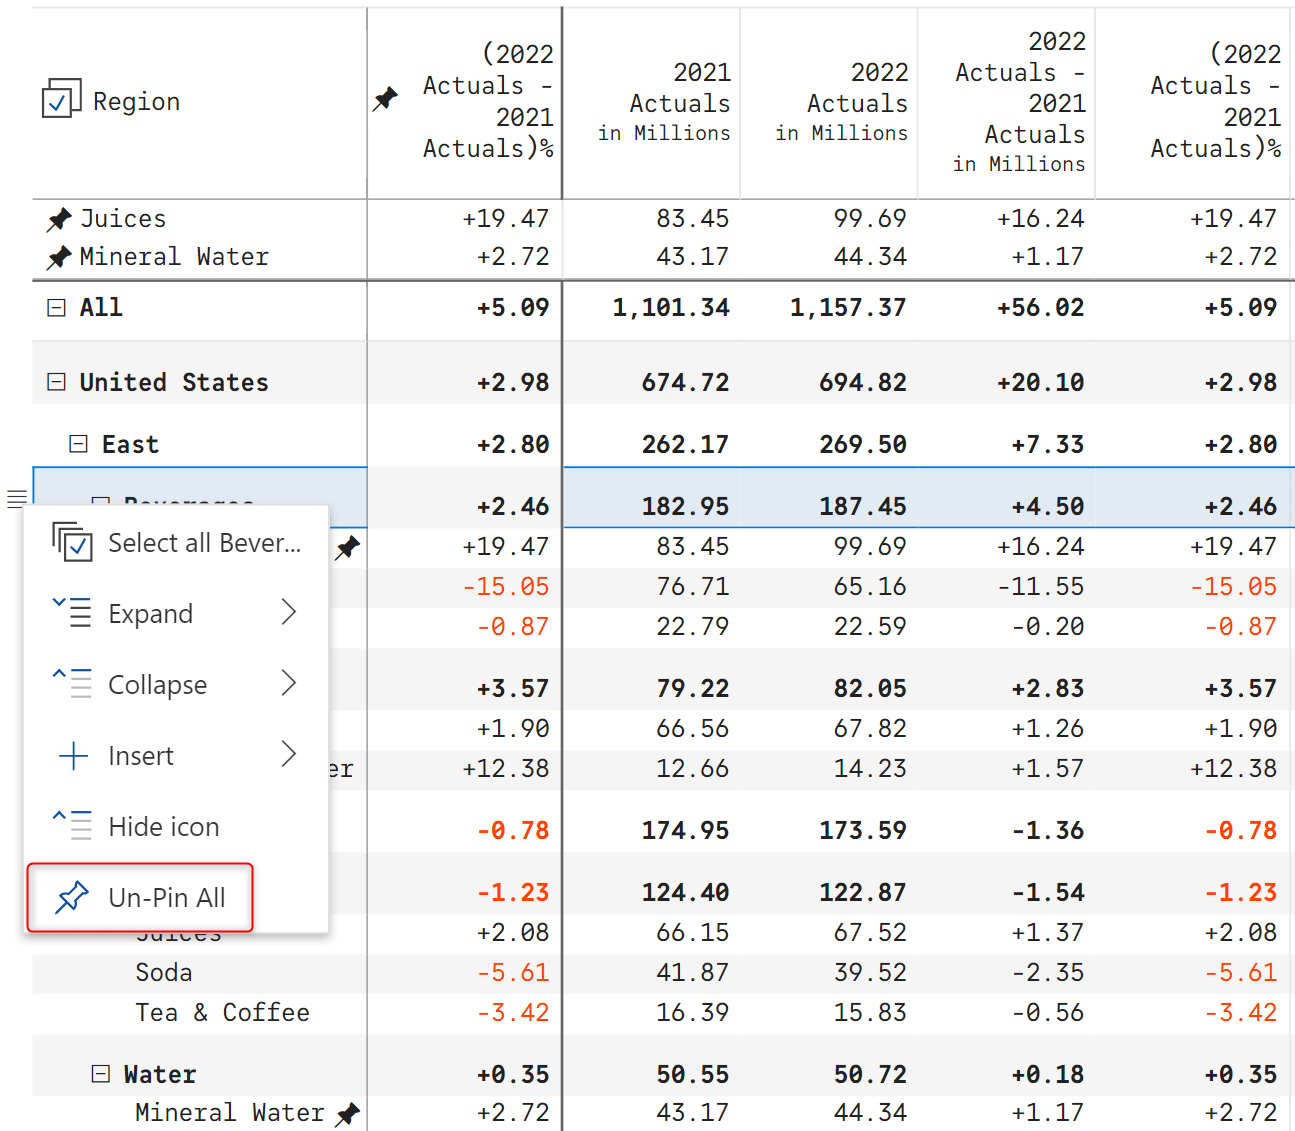
When there are multiple pinned rows and columns, you can quickly un-pin the rows and columns by using the corresponding ‘un-pin all’ option.
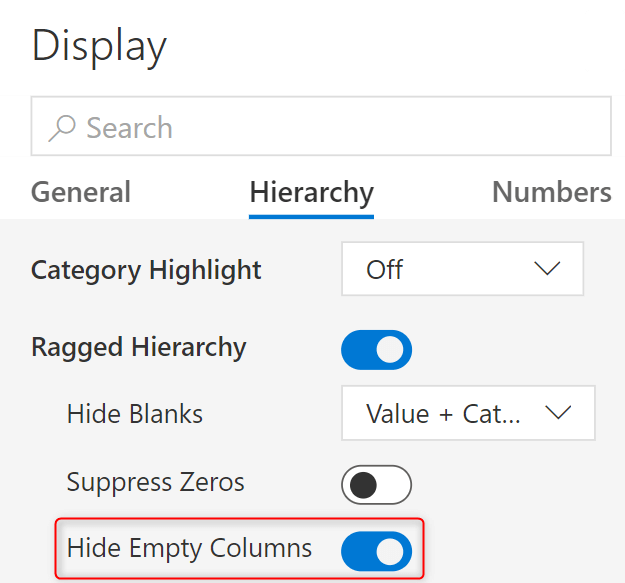
Empty columns in case of a hierarchy can be hidden dynamically using the option highlighted below.
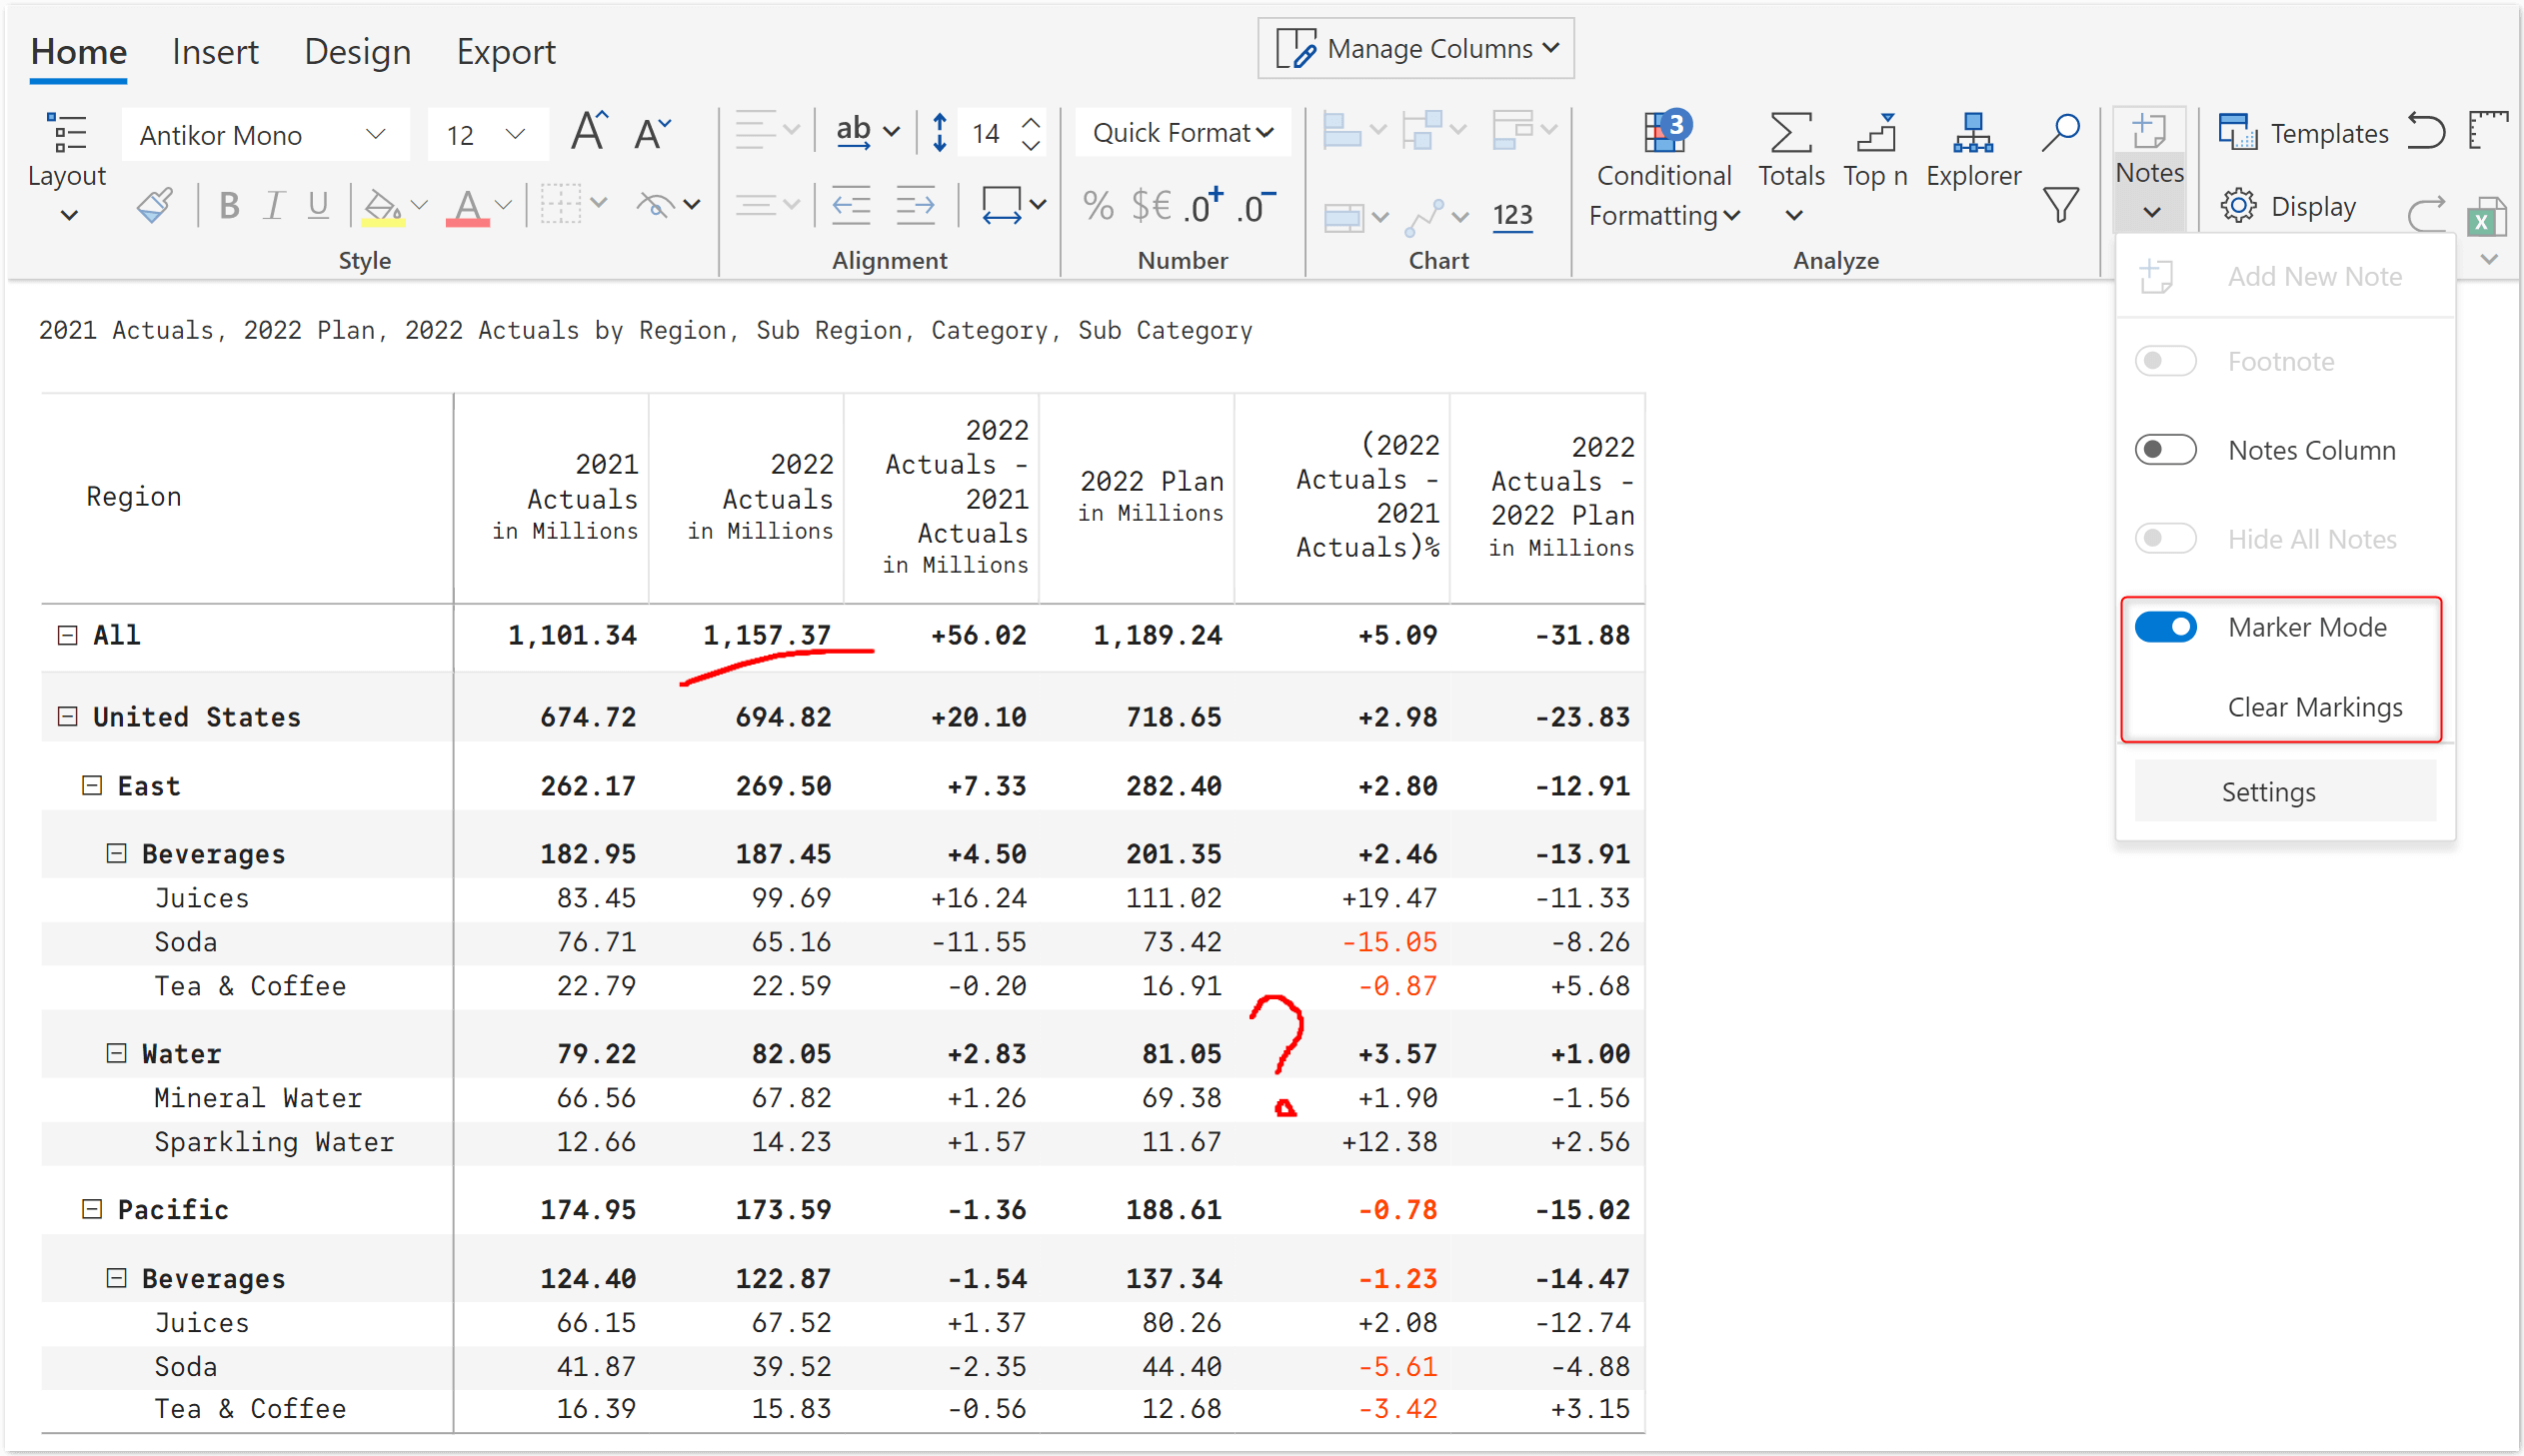
‘Marker Mode’ can be used to highlight important observations during presentations. Markings are temporary and can be cleared using the ‘Clear Markings’ option. Switching to another tab also results in the markings getting erased.
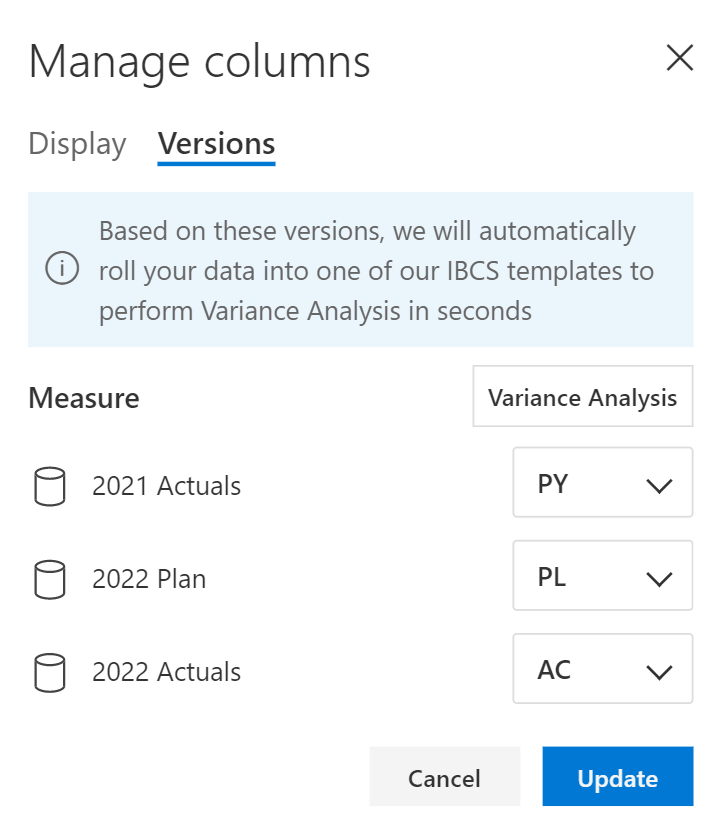
‘Set Version’ earlier available as part of the Insert tab has been moved to ‘Manage Columns’ for better usability.
As part of KPI Explorer, a date filter slider has been introduced as shown in the below image.

Version 1.6 provides support for additional formulas such as HAS, HAS_SOME, HAS_ALL, VALUE, RELATIVE_COLUMN, LEFT, RIGHT and MID.
In addition to these features and enhancements, we also have several important bug fixes as part of this release.
You can now purchase Inforiver Premium directly from Microsoft without having to onboard as a vendor with your credit card or invoice/PO method. It is to be noted that version 1.6 is currently available only in our website and it would take about 2 weeks in the AppSource. We intend to migrate all our existing Inforiver customers to Microsoft AppSource certified version by end of October 15th. All new Inforiver purchases (Standard, Professional, Premium Editions) will be directed from our website to be made only from Microsoft AppSource.
We'd love to hear your ideas for Inforiver – be it a cool new feature or an improvement on existing features. Visit the Inforiver Community to share your ideas, vote on other submissions, and interact with other users.

Inforiver helps enterprises consolidate planning, reporting & analytics on a single platform (Power BI). The no-code, self-service award-winning platform has been recognized as the industry’s best and is adopted by many Fortune 100 firms.
Inforiver is a product of Lumel, the #1 Power BI AppSource Partner. The firm serves over 3,000 customers worldwide through its portfolio of products offered under the brands Inforiver, EDITable, ValQ, and xViz.