Upcoming webinar on 'Inforiver Charts : The fastest way to deliver stories in Power BI', Aug 29th , Monday, 10.30 AM CST. Register Now
Upcoming webinar on 'Inforiver Charts : The fastest way to deliver stories in Power BI', Aug 29th , Monday, 10.30 AM CST. Register Now
Organizations employ a diverse array of forecasting techniques catering to the unique needs and priorities of different departments and business functions. The sophistication and maturity of these forecasting methods vary across areas such as sales forecasting, financial forecasting (encompassing revenue, expense, and cash flow projections), headcount planning, inventory planning, demand forecasting, and sales and operations planning (S&OP).
A frequently utilized approach to forecasting involves distributing a forecast template, allowing individual line managers to submit their projections. The firm then consolidates these projections to arrive at the forecast for the entire organization. This method is known as the Sales Force Composite method in the context of sales forecasting. Such participative or collaborative forecasting methods are also standard in Finance, where users enter financial projections in templates.
The baseline data for forecasting usually originates from the latest performance data extracted from analytics tools like Power BI, Tableau, Qlik, Spotfire, and Cognos. As these tools offer limited built-in forecasting capabilities, analysts often export data from these tools to Microsoft Excel or enterprise planning software to create forecast templates.
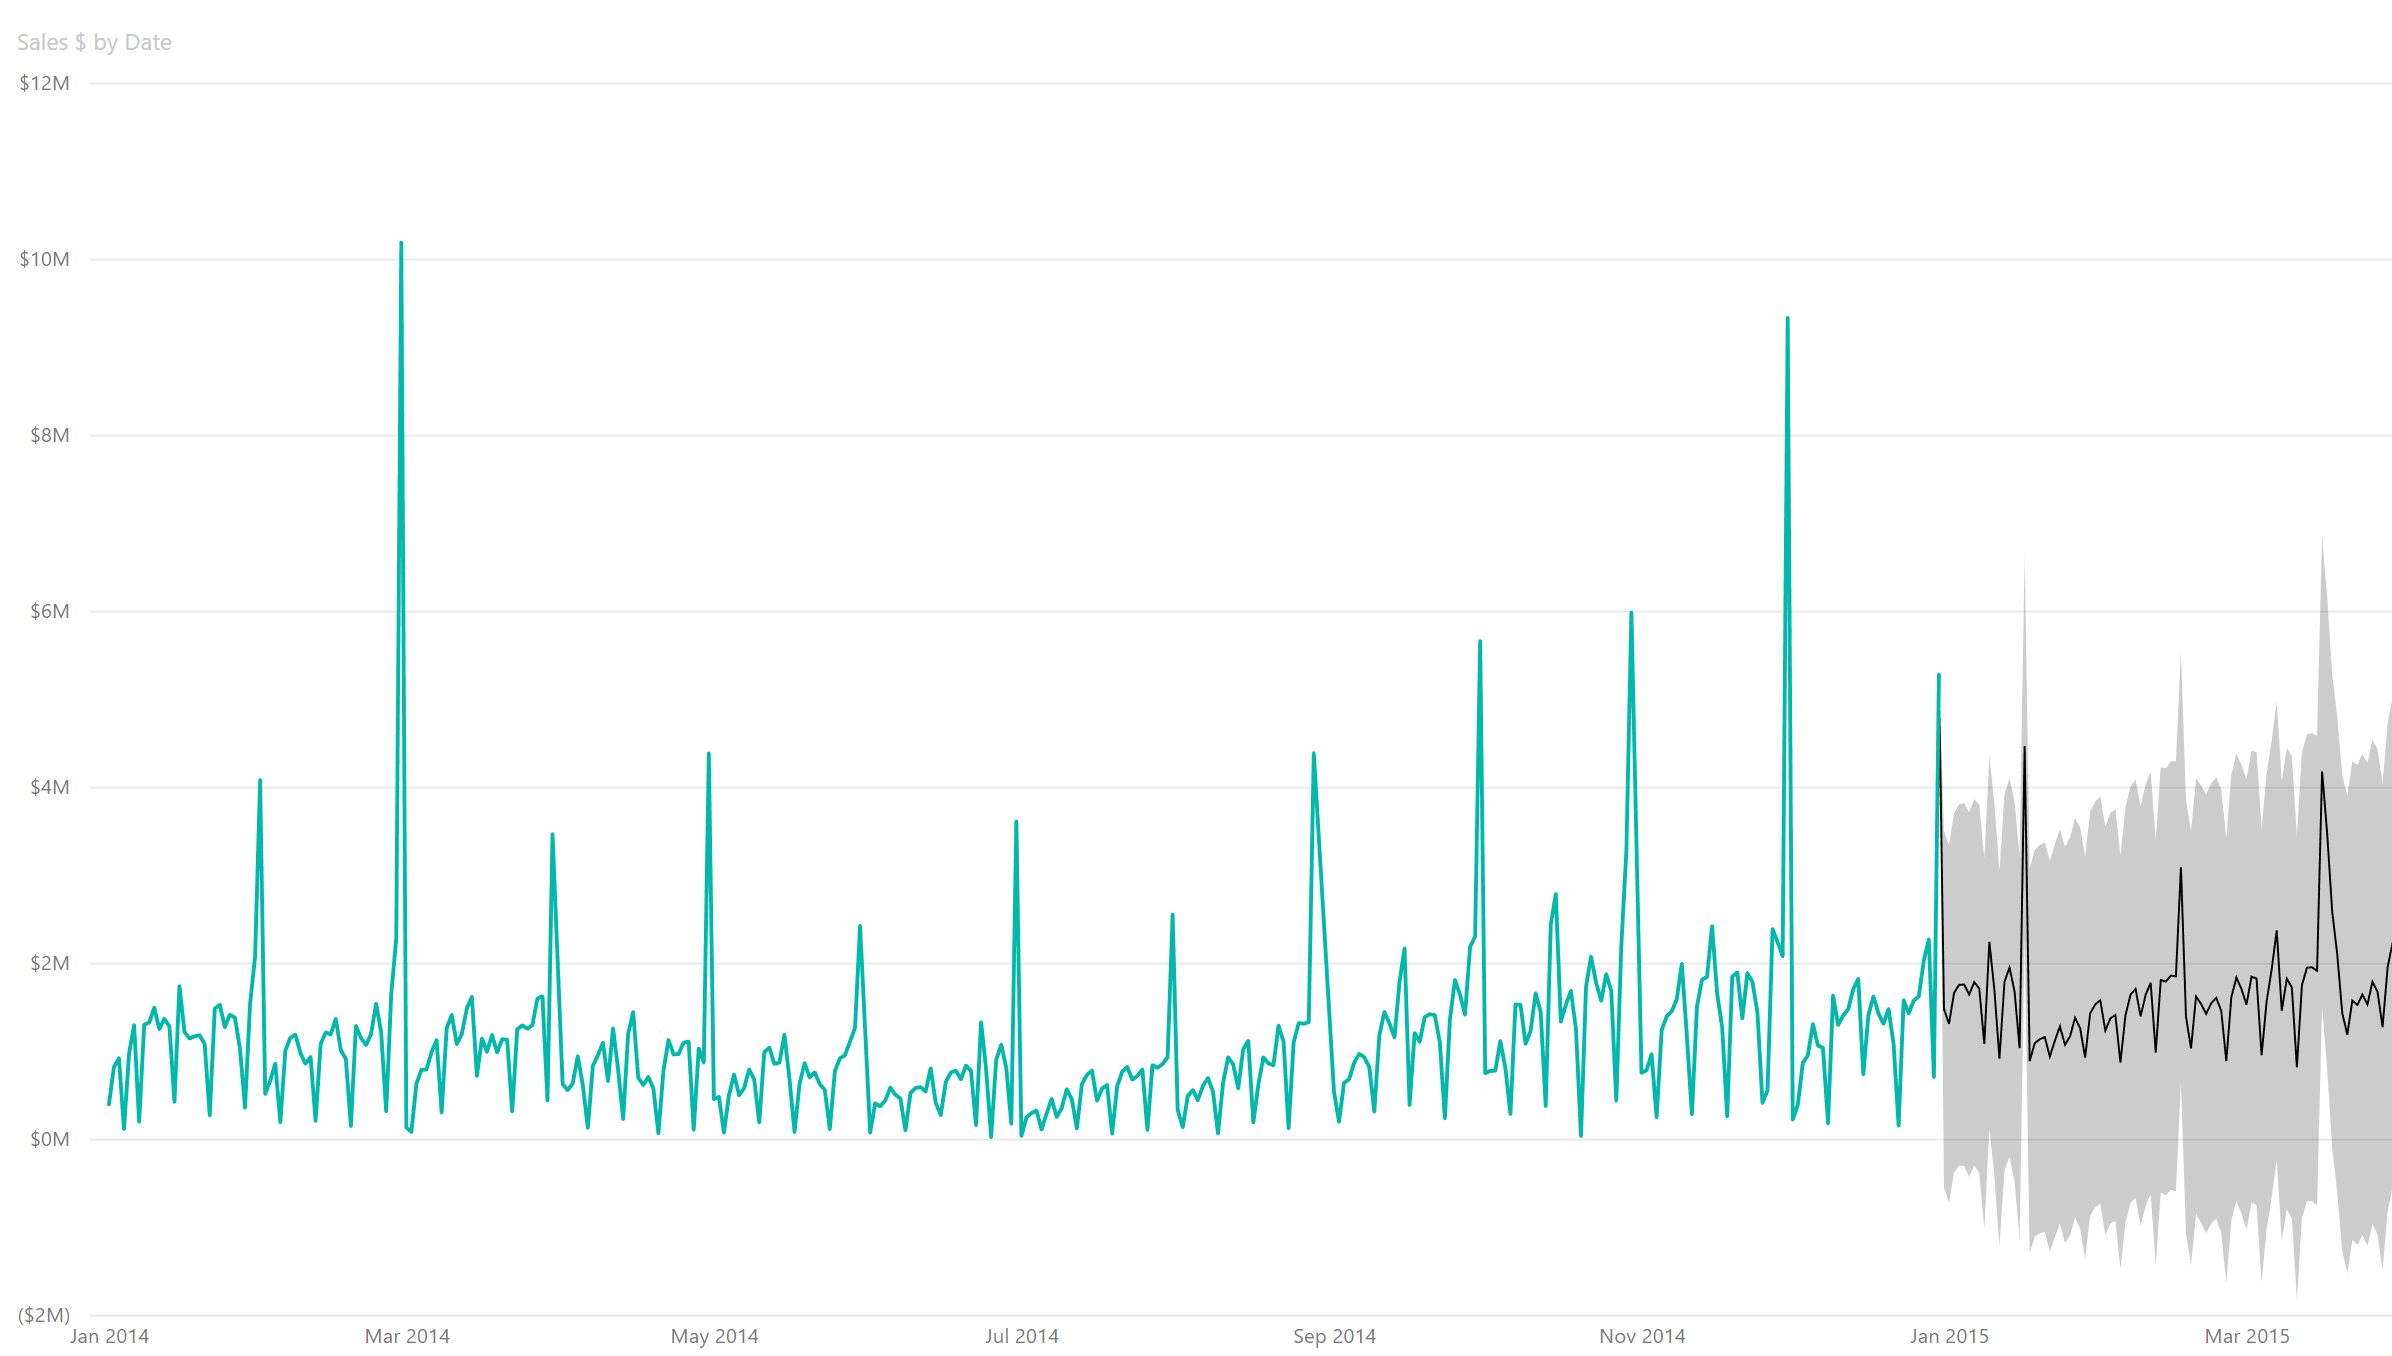
Power BI’s built-in forecasting capability is restricted to creating time series forecasts using its line charts. However, you can forecast only one series at a time, and the chart will need a date field on the x-axis. Power BI’s table and matrix visuals do not support collaborative forecasting using templates where users can enter data.
Consequently, there are two ways to enable forecasting right inside Power BI (and avoid replicating the data elsewhere):
You can build forecast templates in PowerApps and integrate them with Power BI using the PowerApps visual. However, this approach is limited in terms of what it can do. Note that PowerApps is an entirely different skillset from Power BI, with minimal overlap between the two. In fact, most Power BI developers are NOT PowerApps developers.
In an earlier analysis, we concluded that the combination of Power BI + PowerApps is not for everyone, as it is relatively harder than it should be for casual business users and yet too restrictive for very advanced scenarios.
2. Forecasting using a third-party visual:
Another option is to use a third-party editable table or matrix visual for forecasting. However, almost all solutions in the market today (except Inforiver) are IT-centric, with the following issues:
With Inforiver, you can deploy a business-friendly, robust, and flexible writeback solution in Power BI with minimal dependency on IT. You can:
Inforiver allows your line managers to create forecasts whenever they want, with minimal involvement from IT. The business productivity and cost savings can be huge, considering that many line managers create and submit forecasts across the organization.
Let us take a quick look at crucial forecasting capabilities delivered by Inforiver.

Learn how to save forecasts from Power BI to Microsoft Fabric and other destinations.
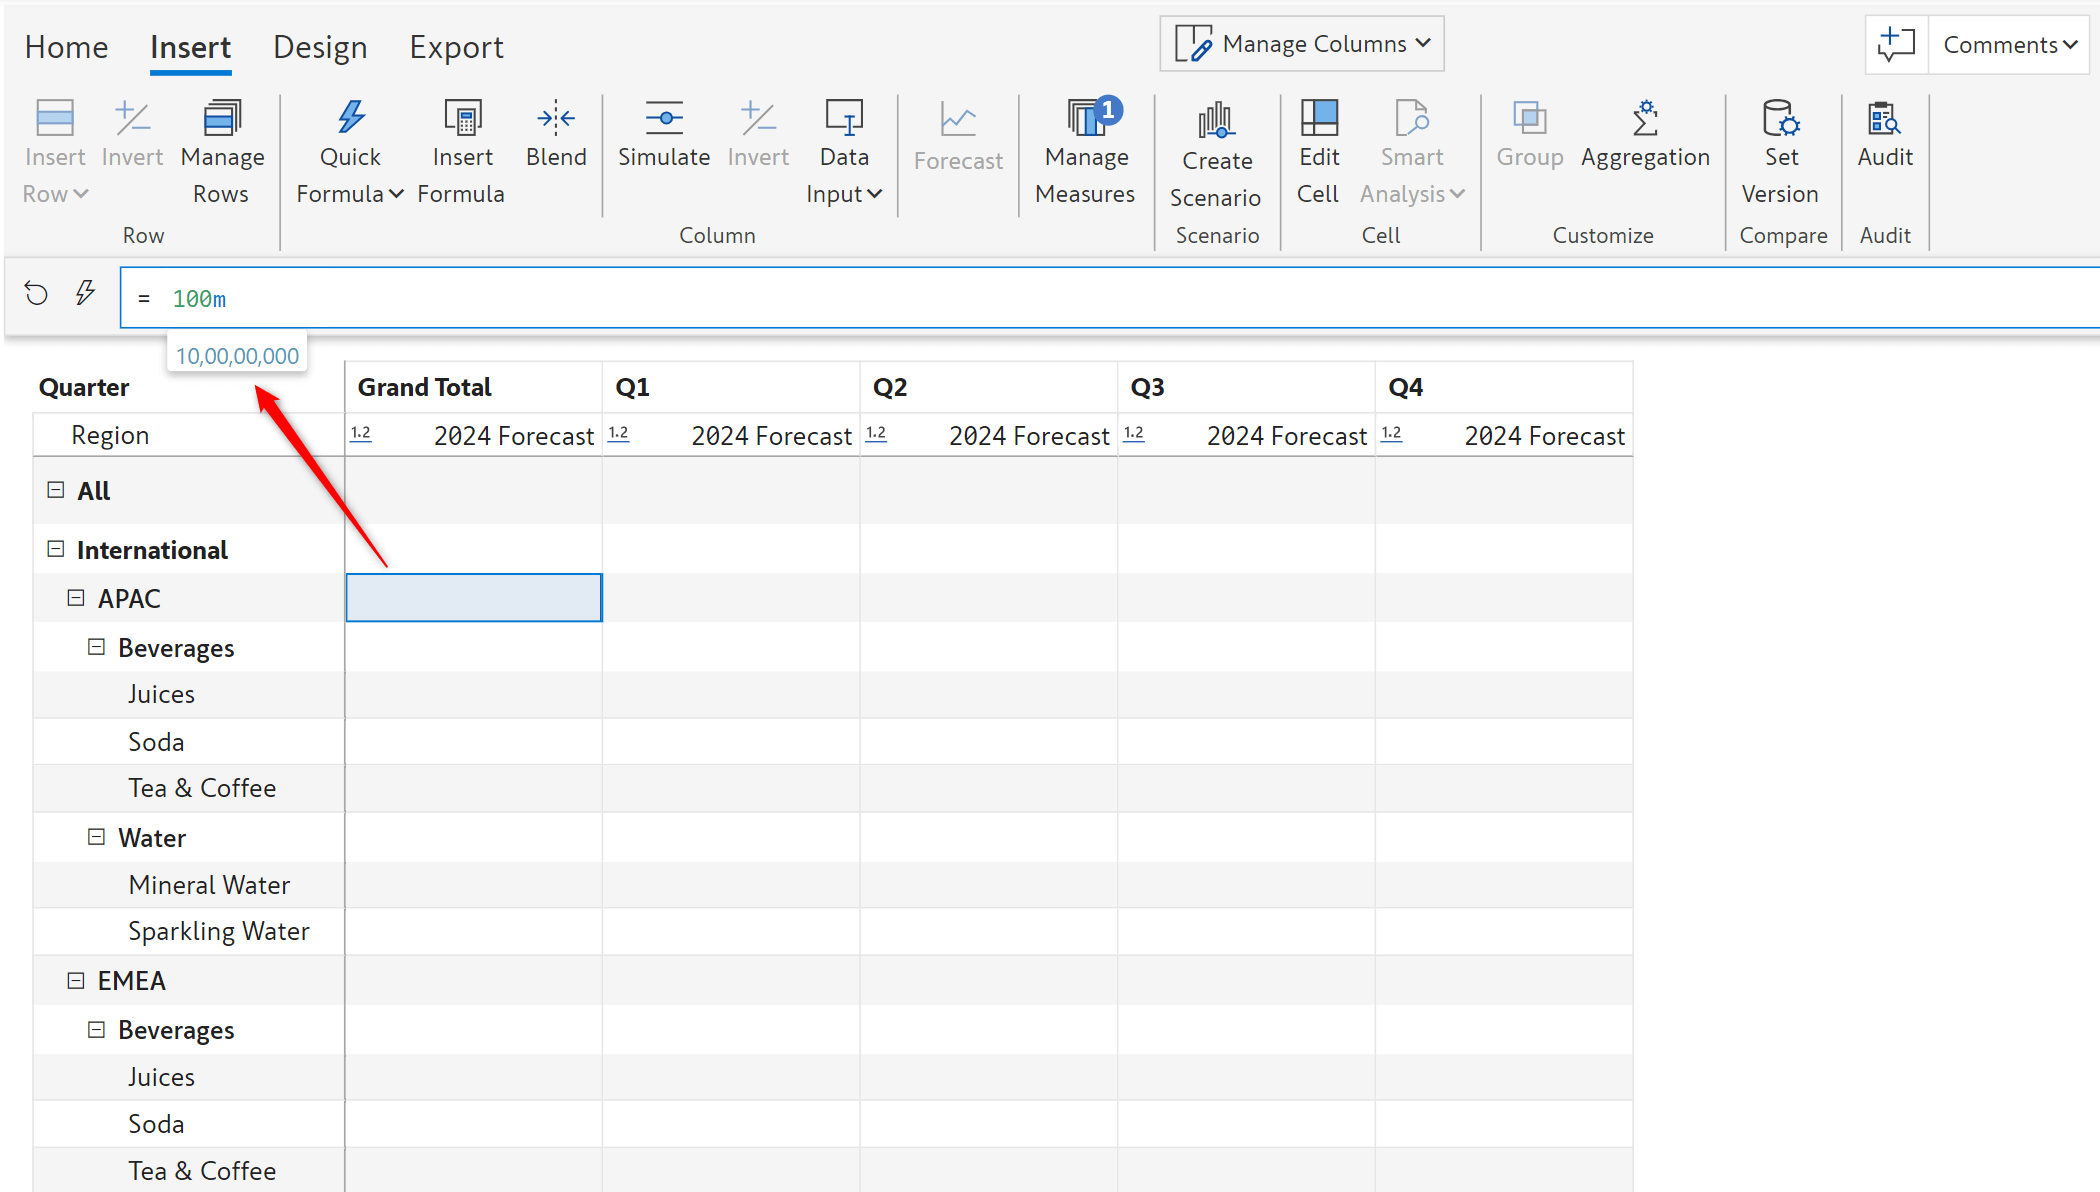
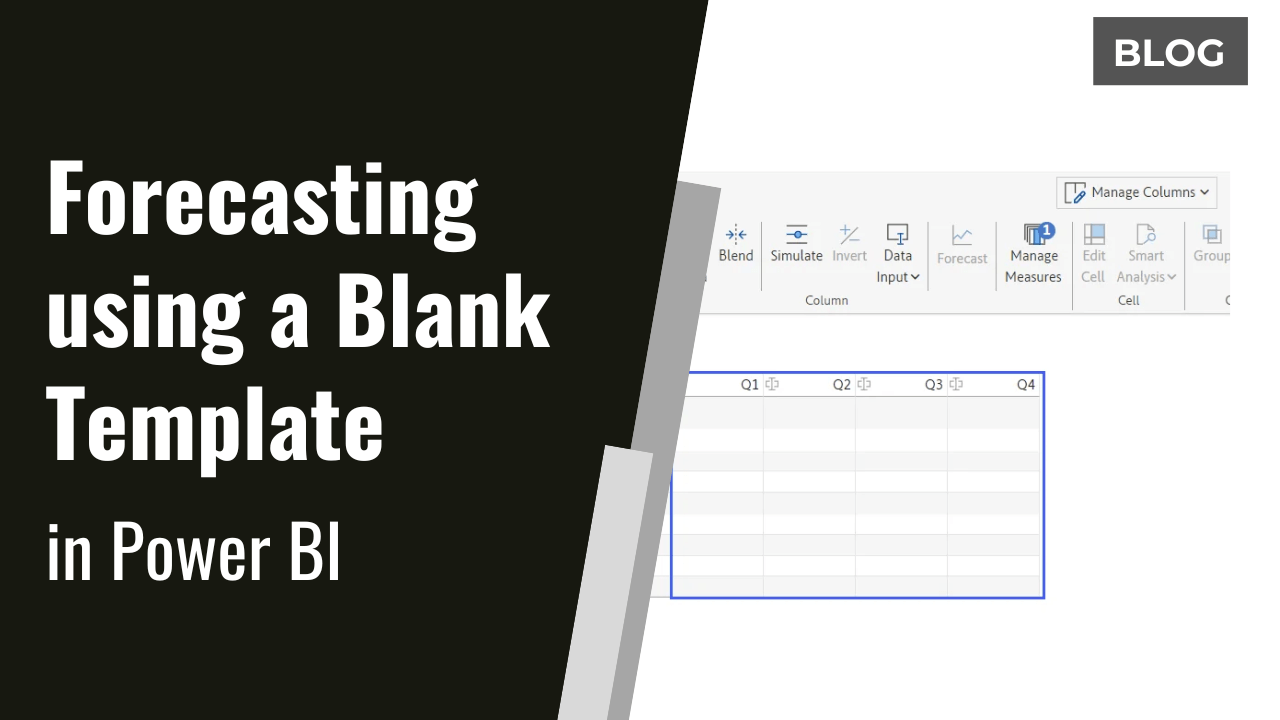
Create a blank template and enter values by simply double-clicking a cell and typing in the formula bar.
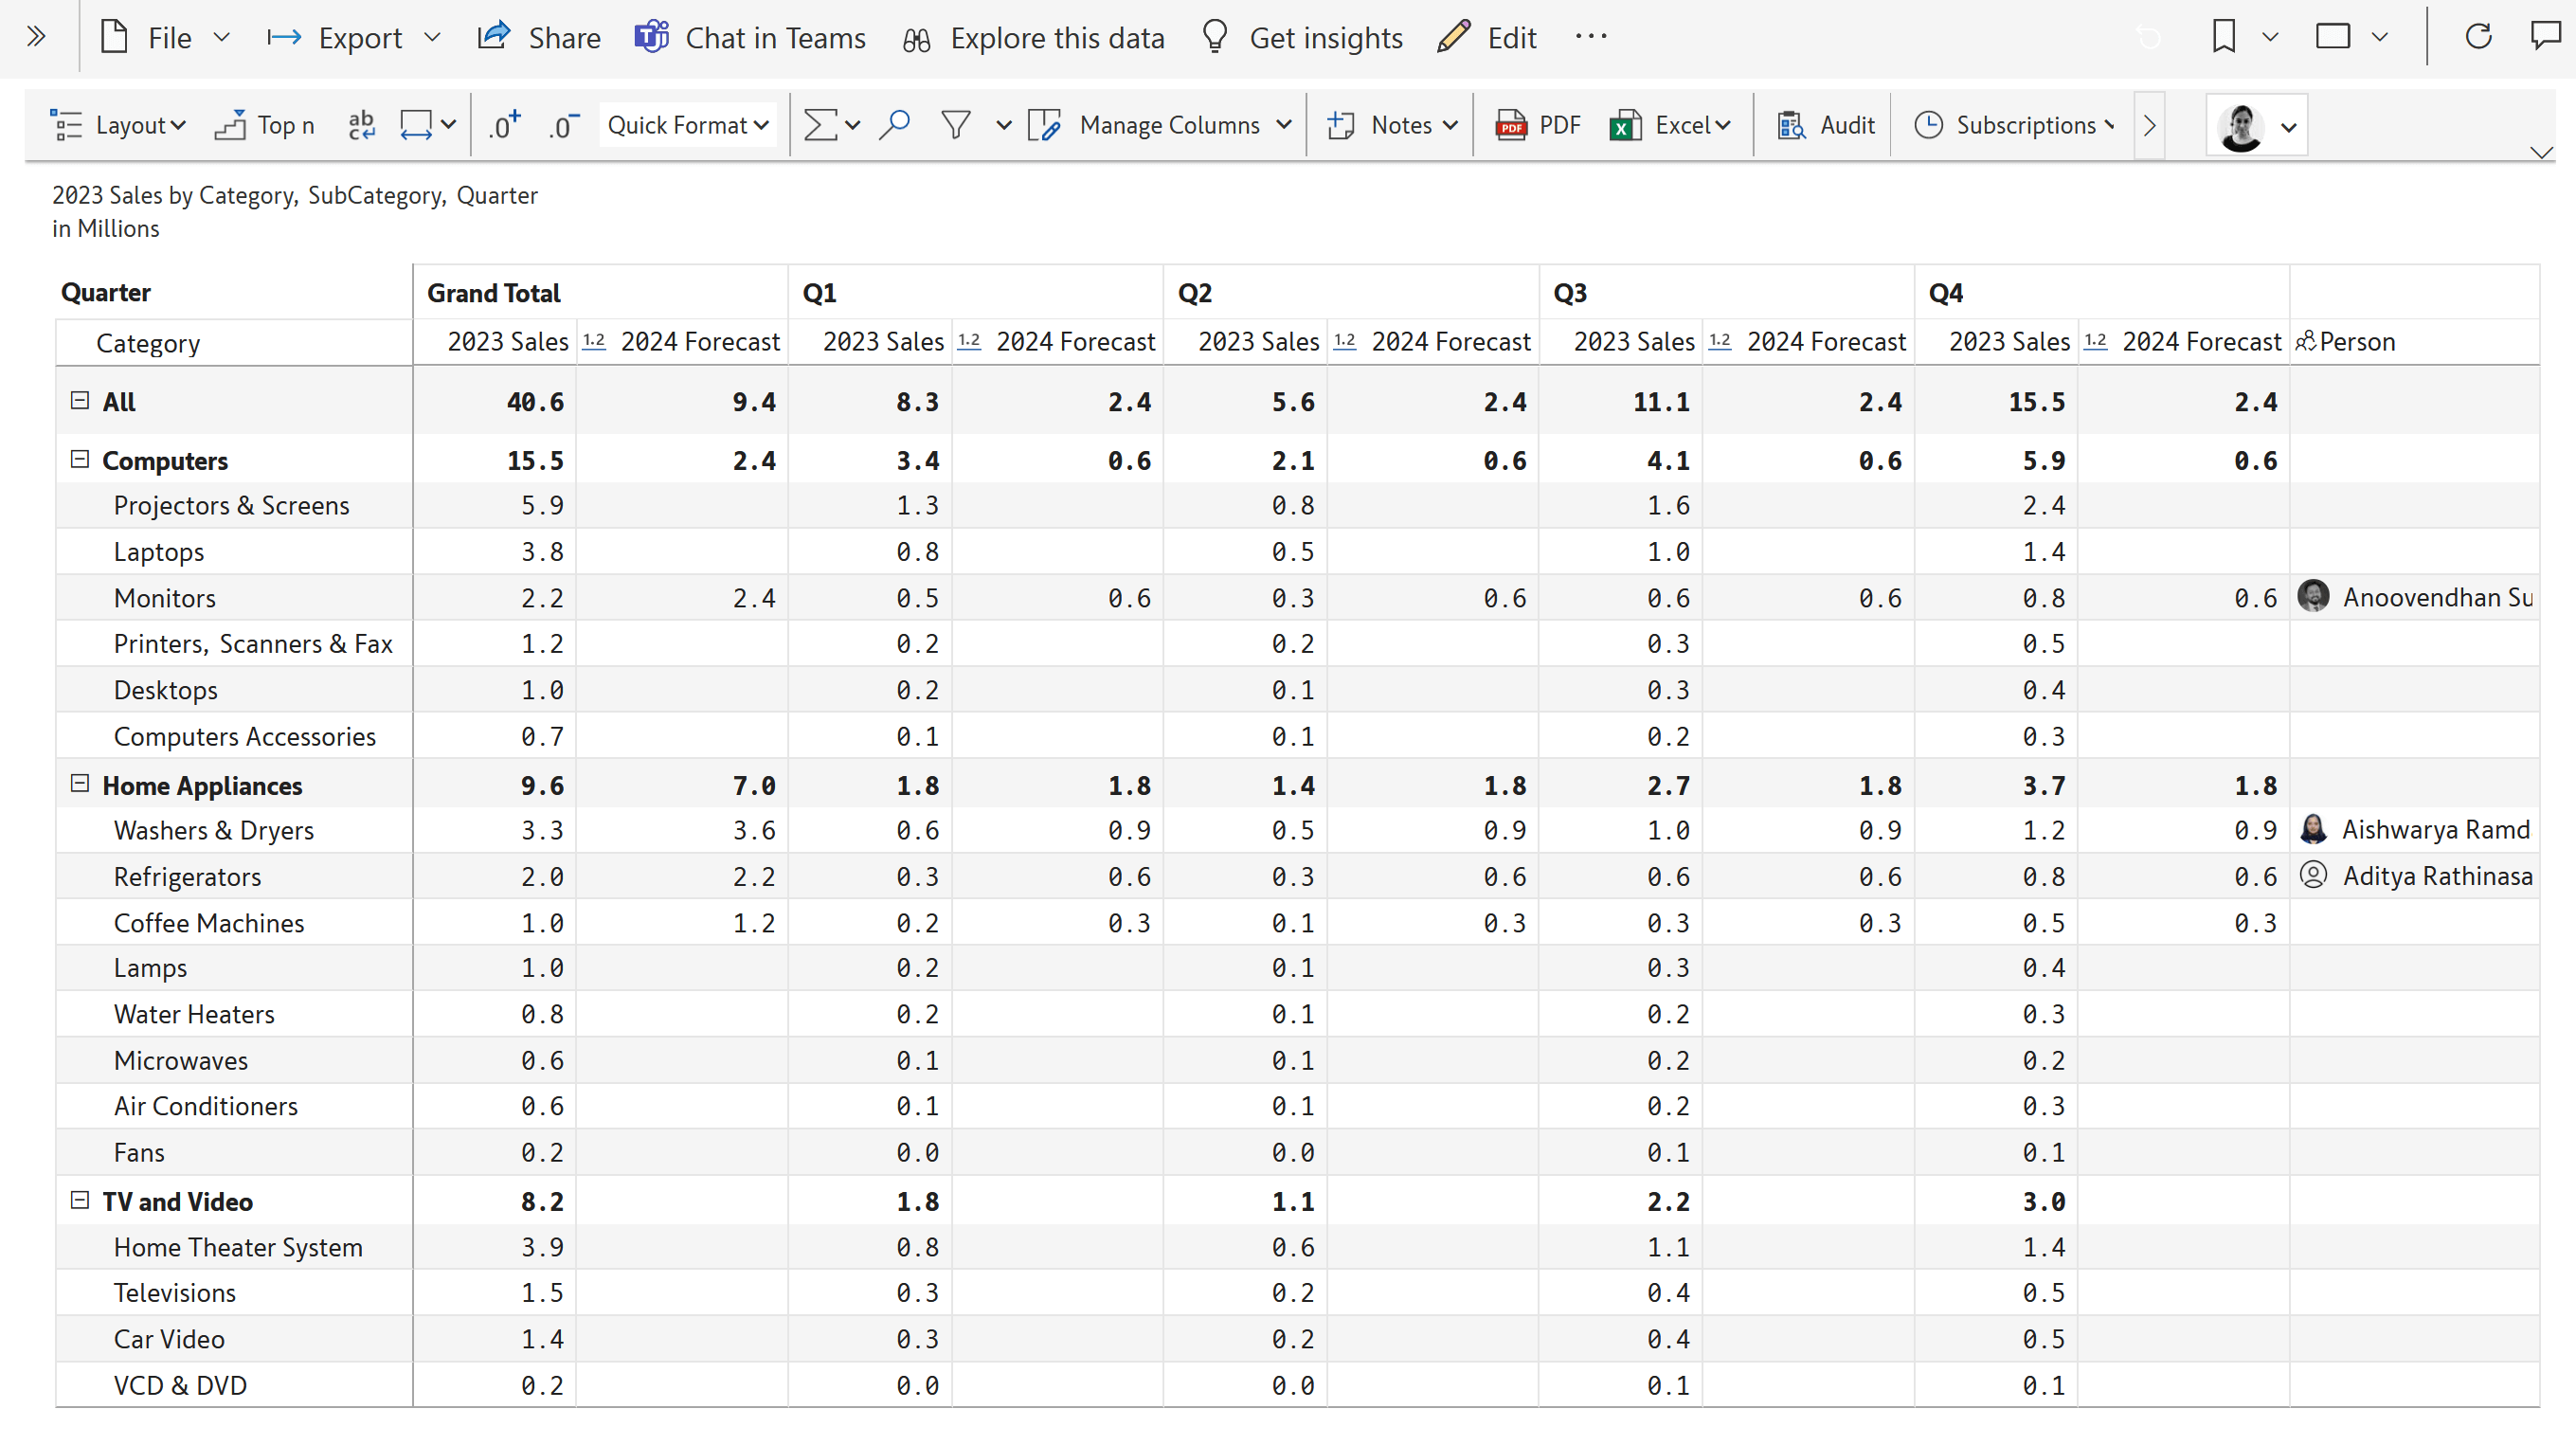
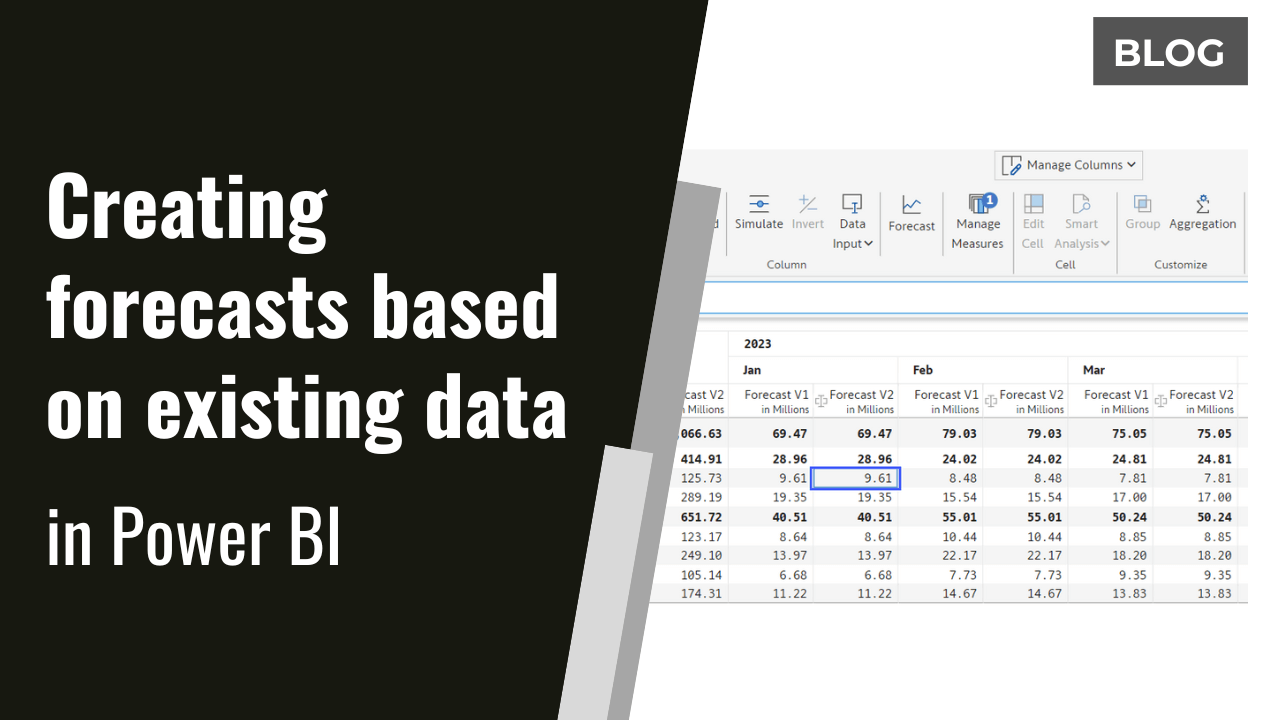
Create a forecast based on actual performance (from past periods) and make finer adjustments.
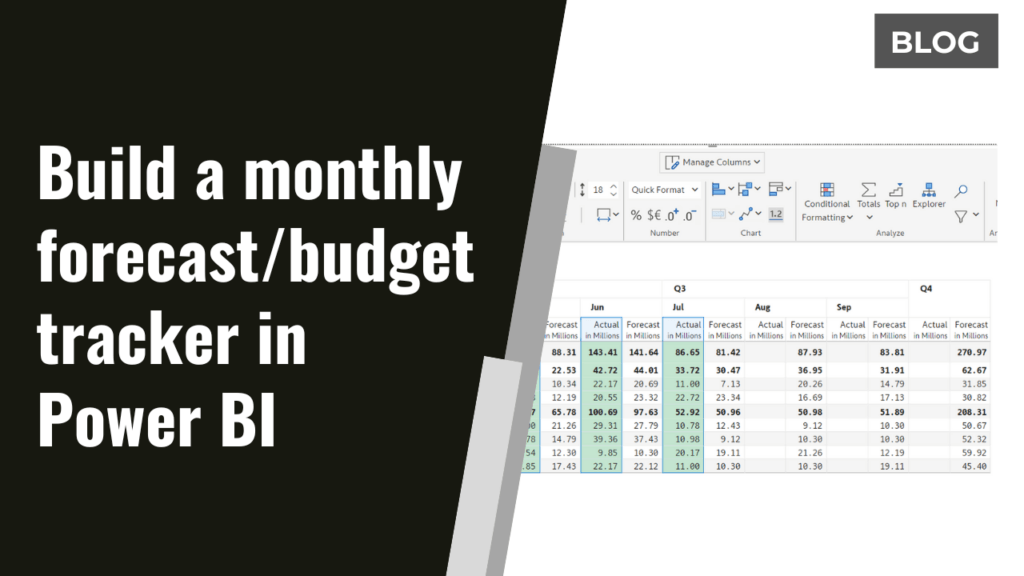
Create periodic forecast trackers to compare actual performance to projections. Format columns, rows, and cells just as you can do in Excel.
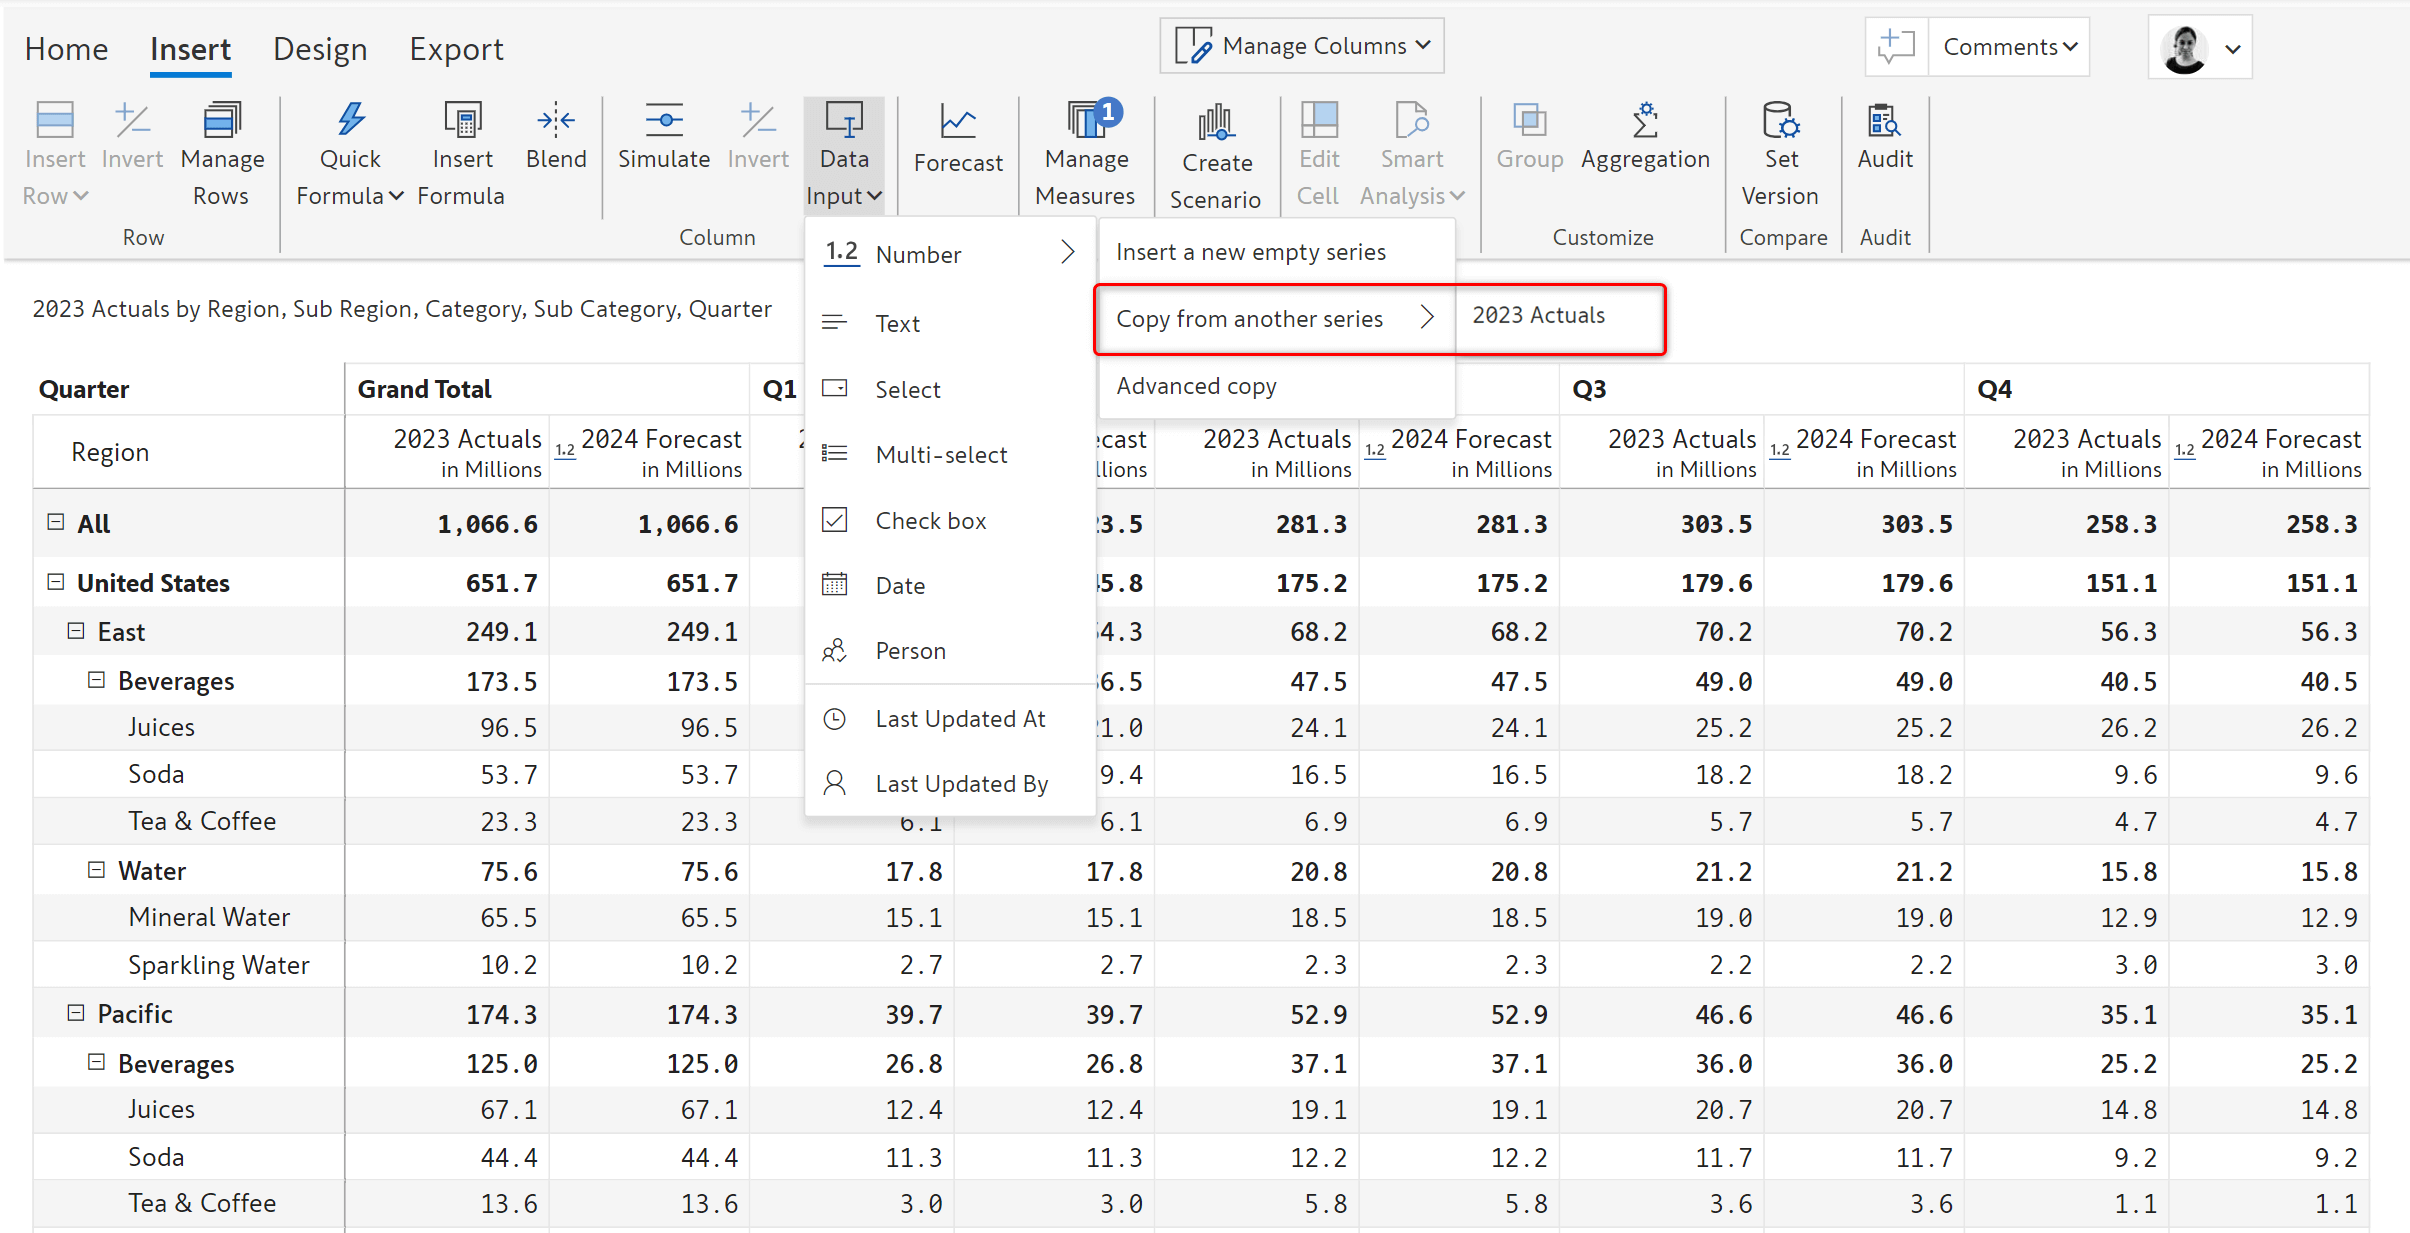
Create custom forecast templates with custom fields like text, single-select, multi-select, check box, date, and person columns.
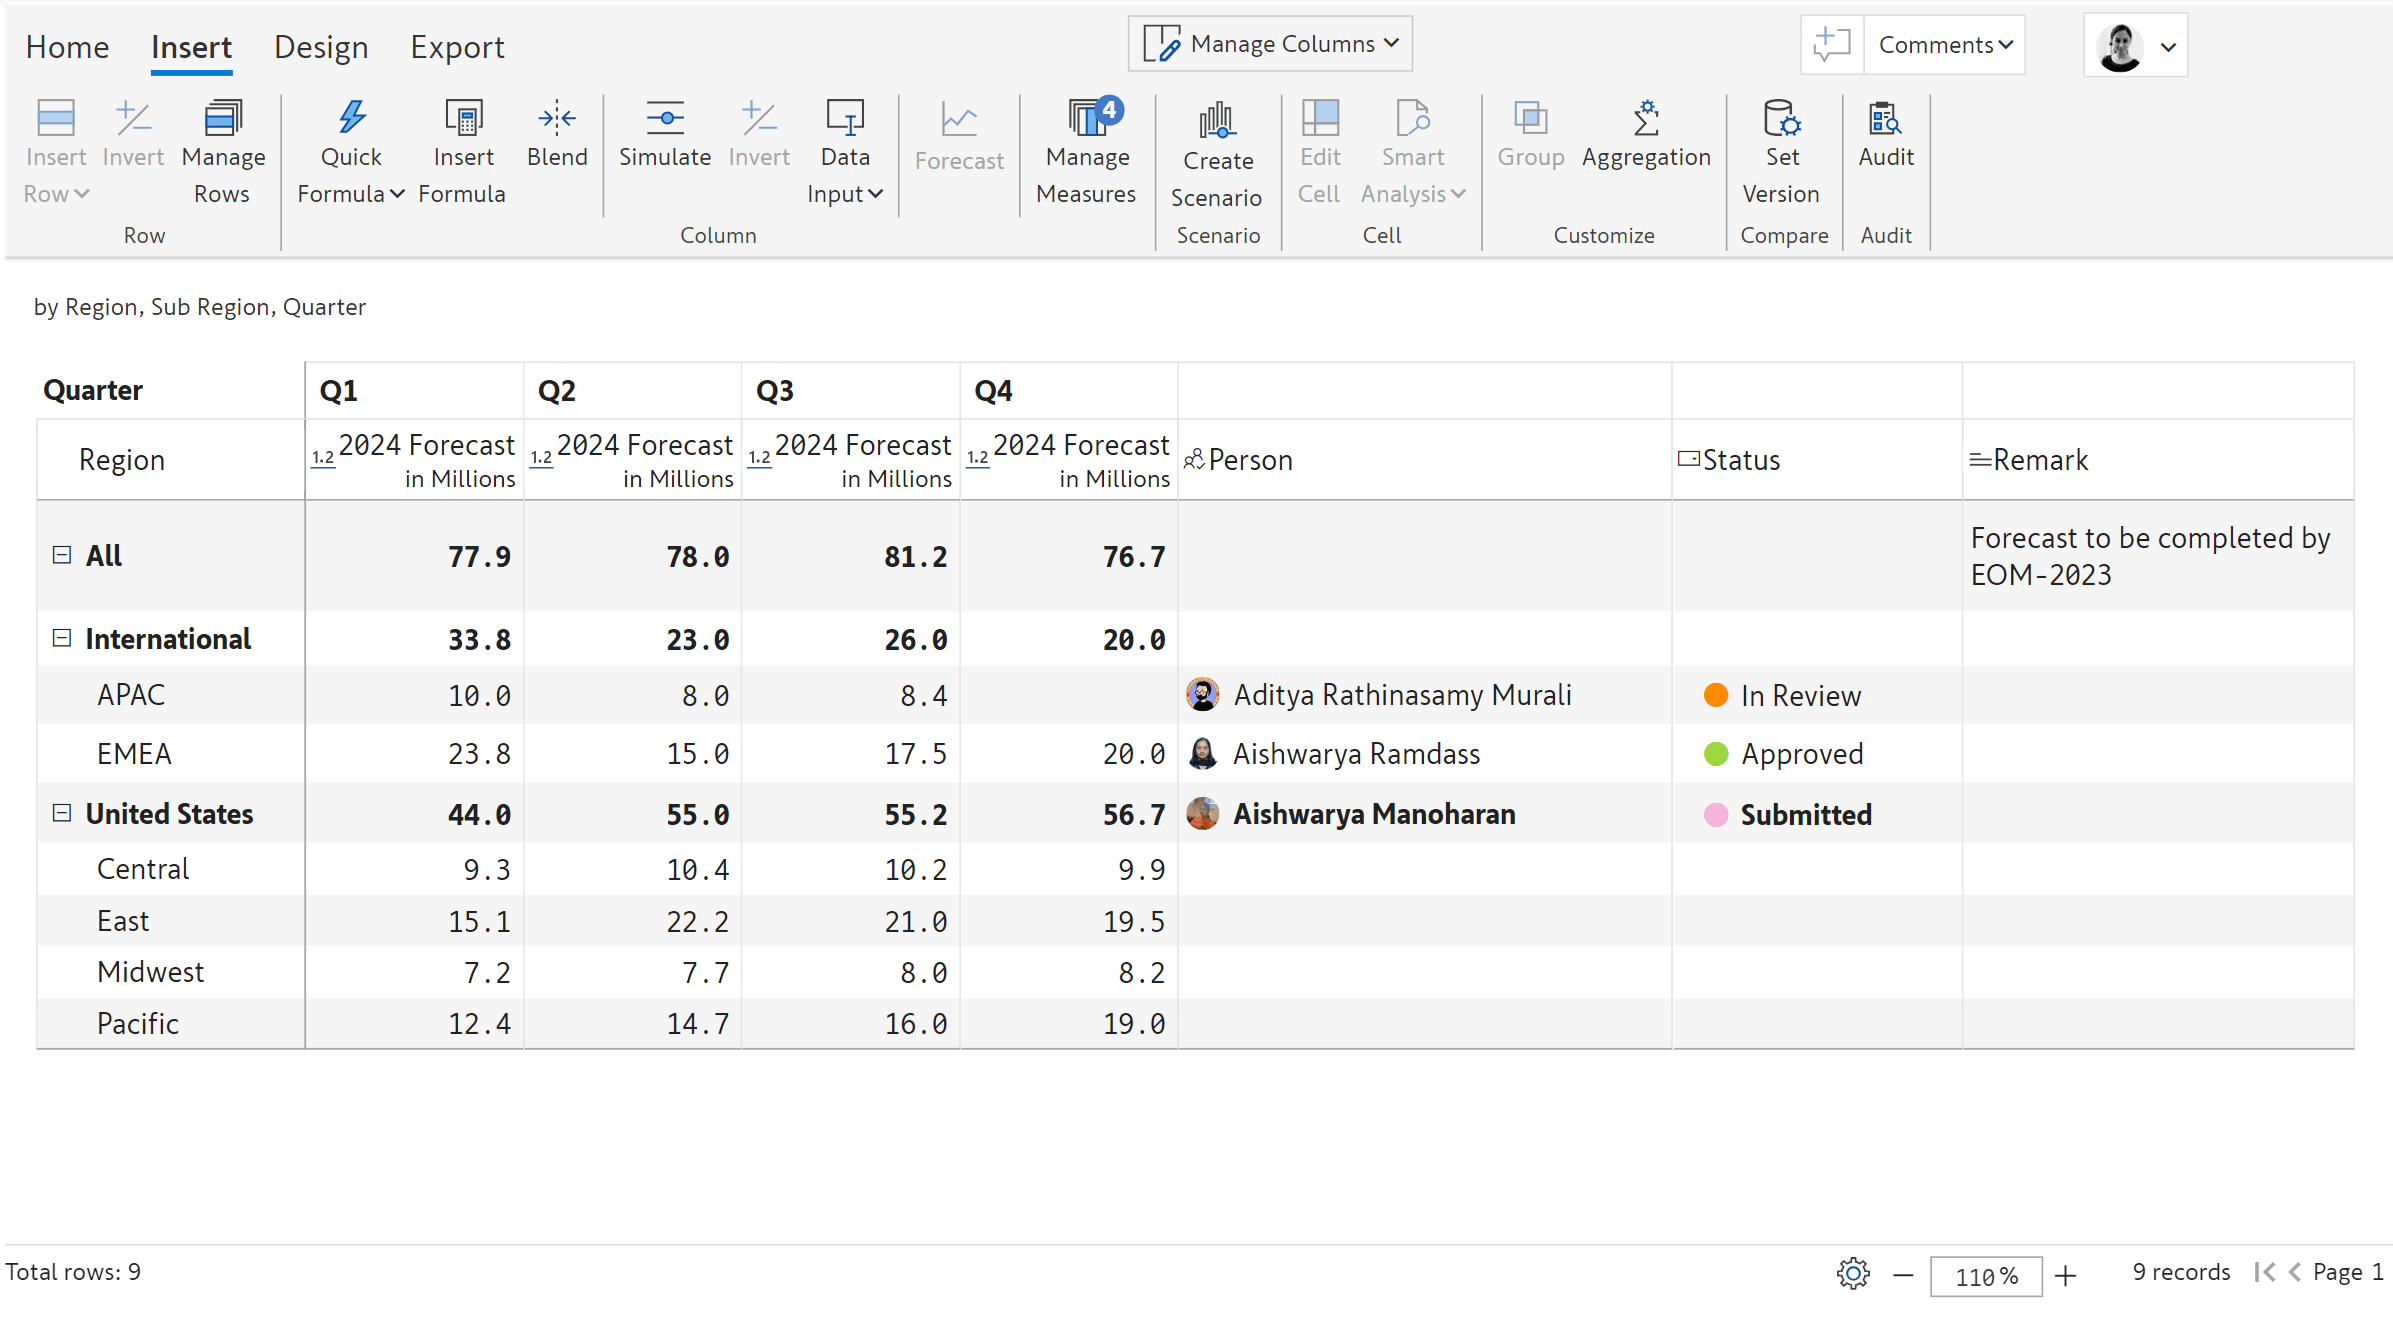
Enter data manually in the Power BI reports and collaborate with peers and stakeholders.
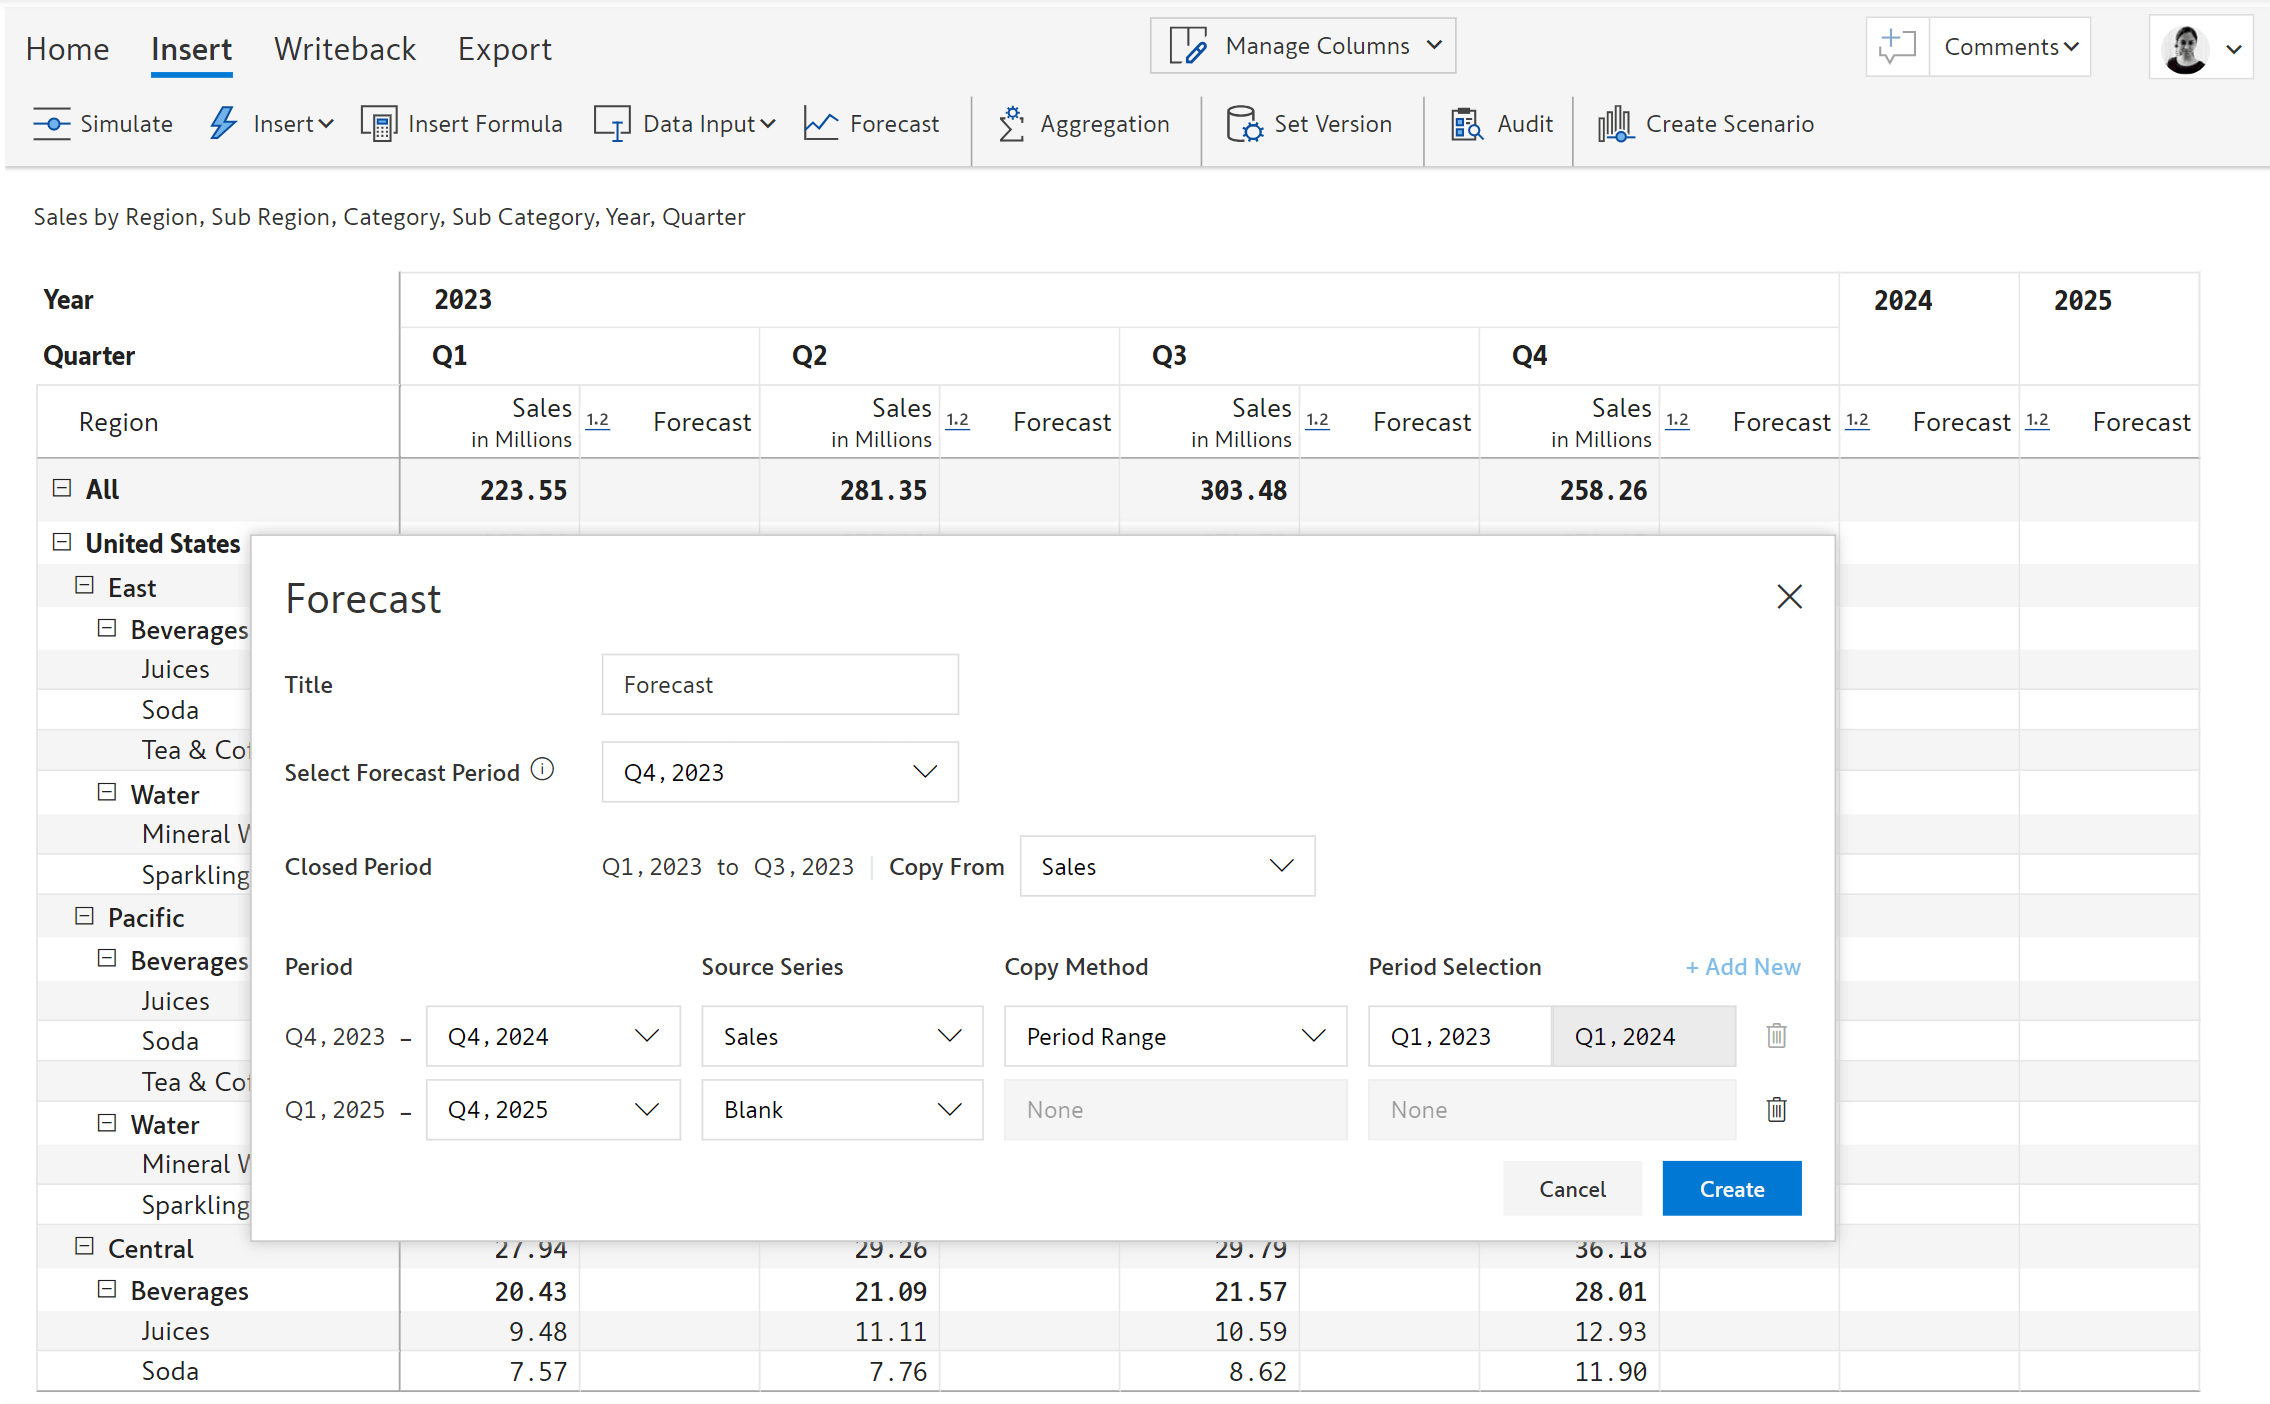
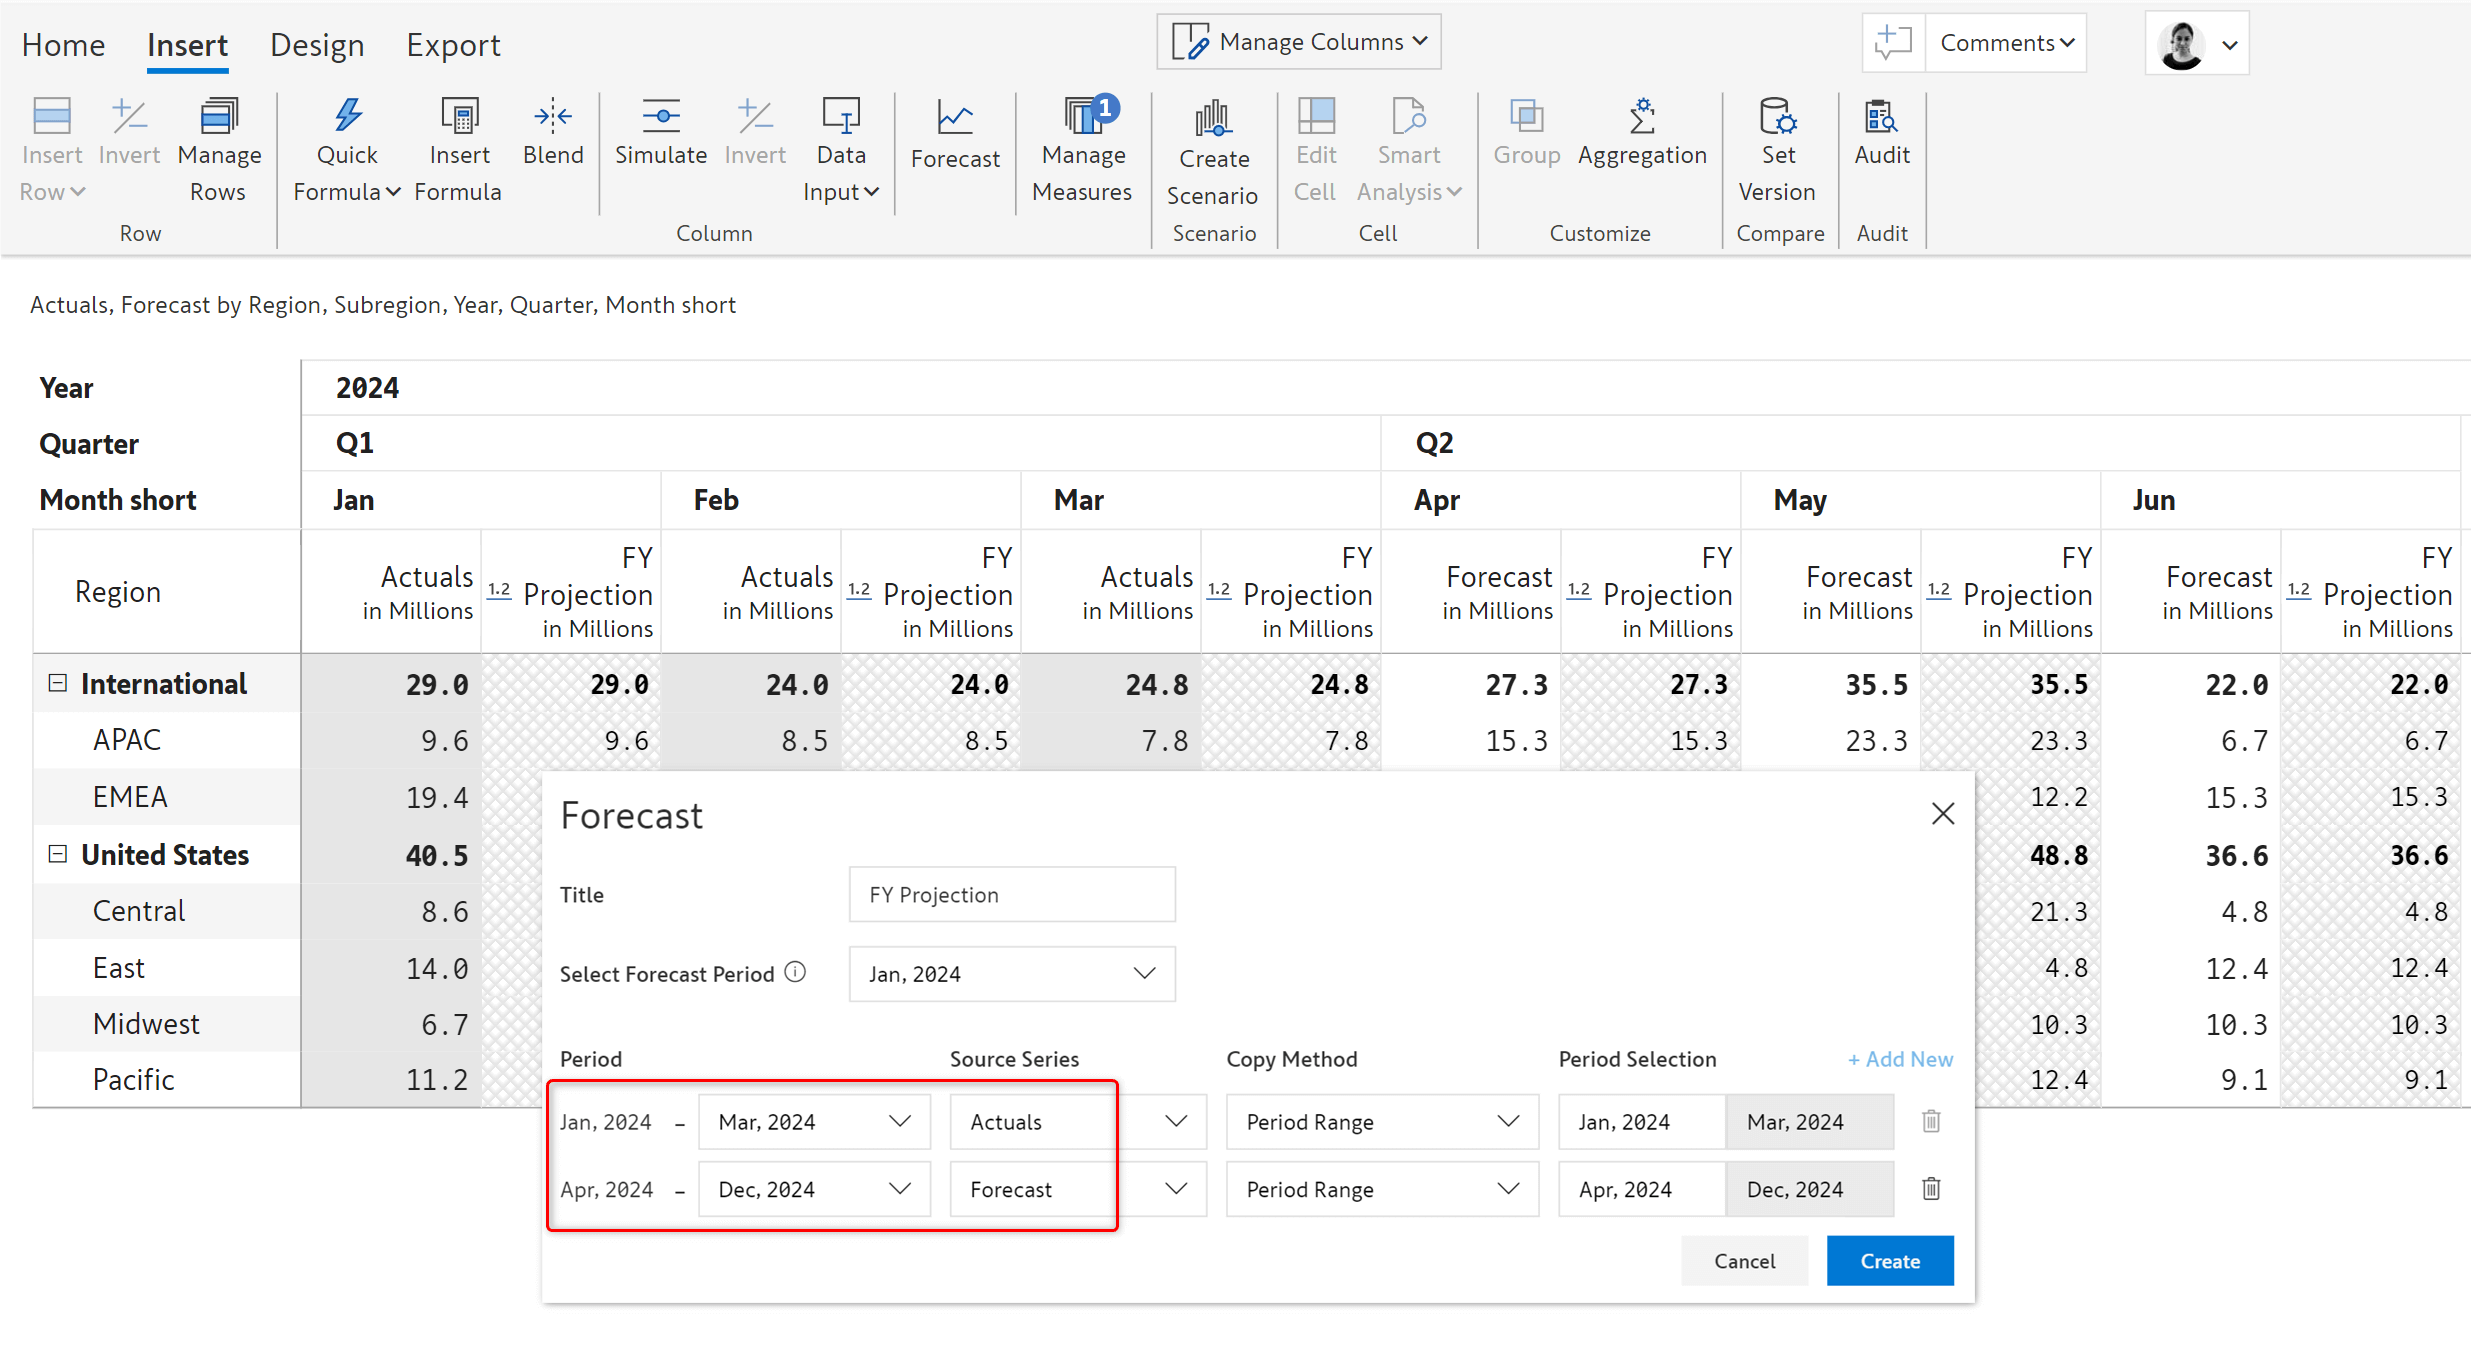
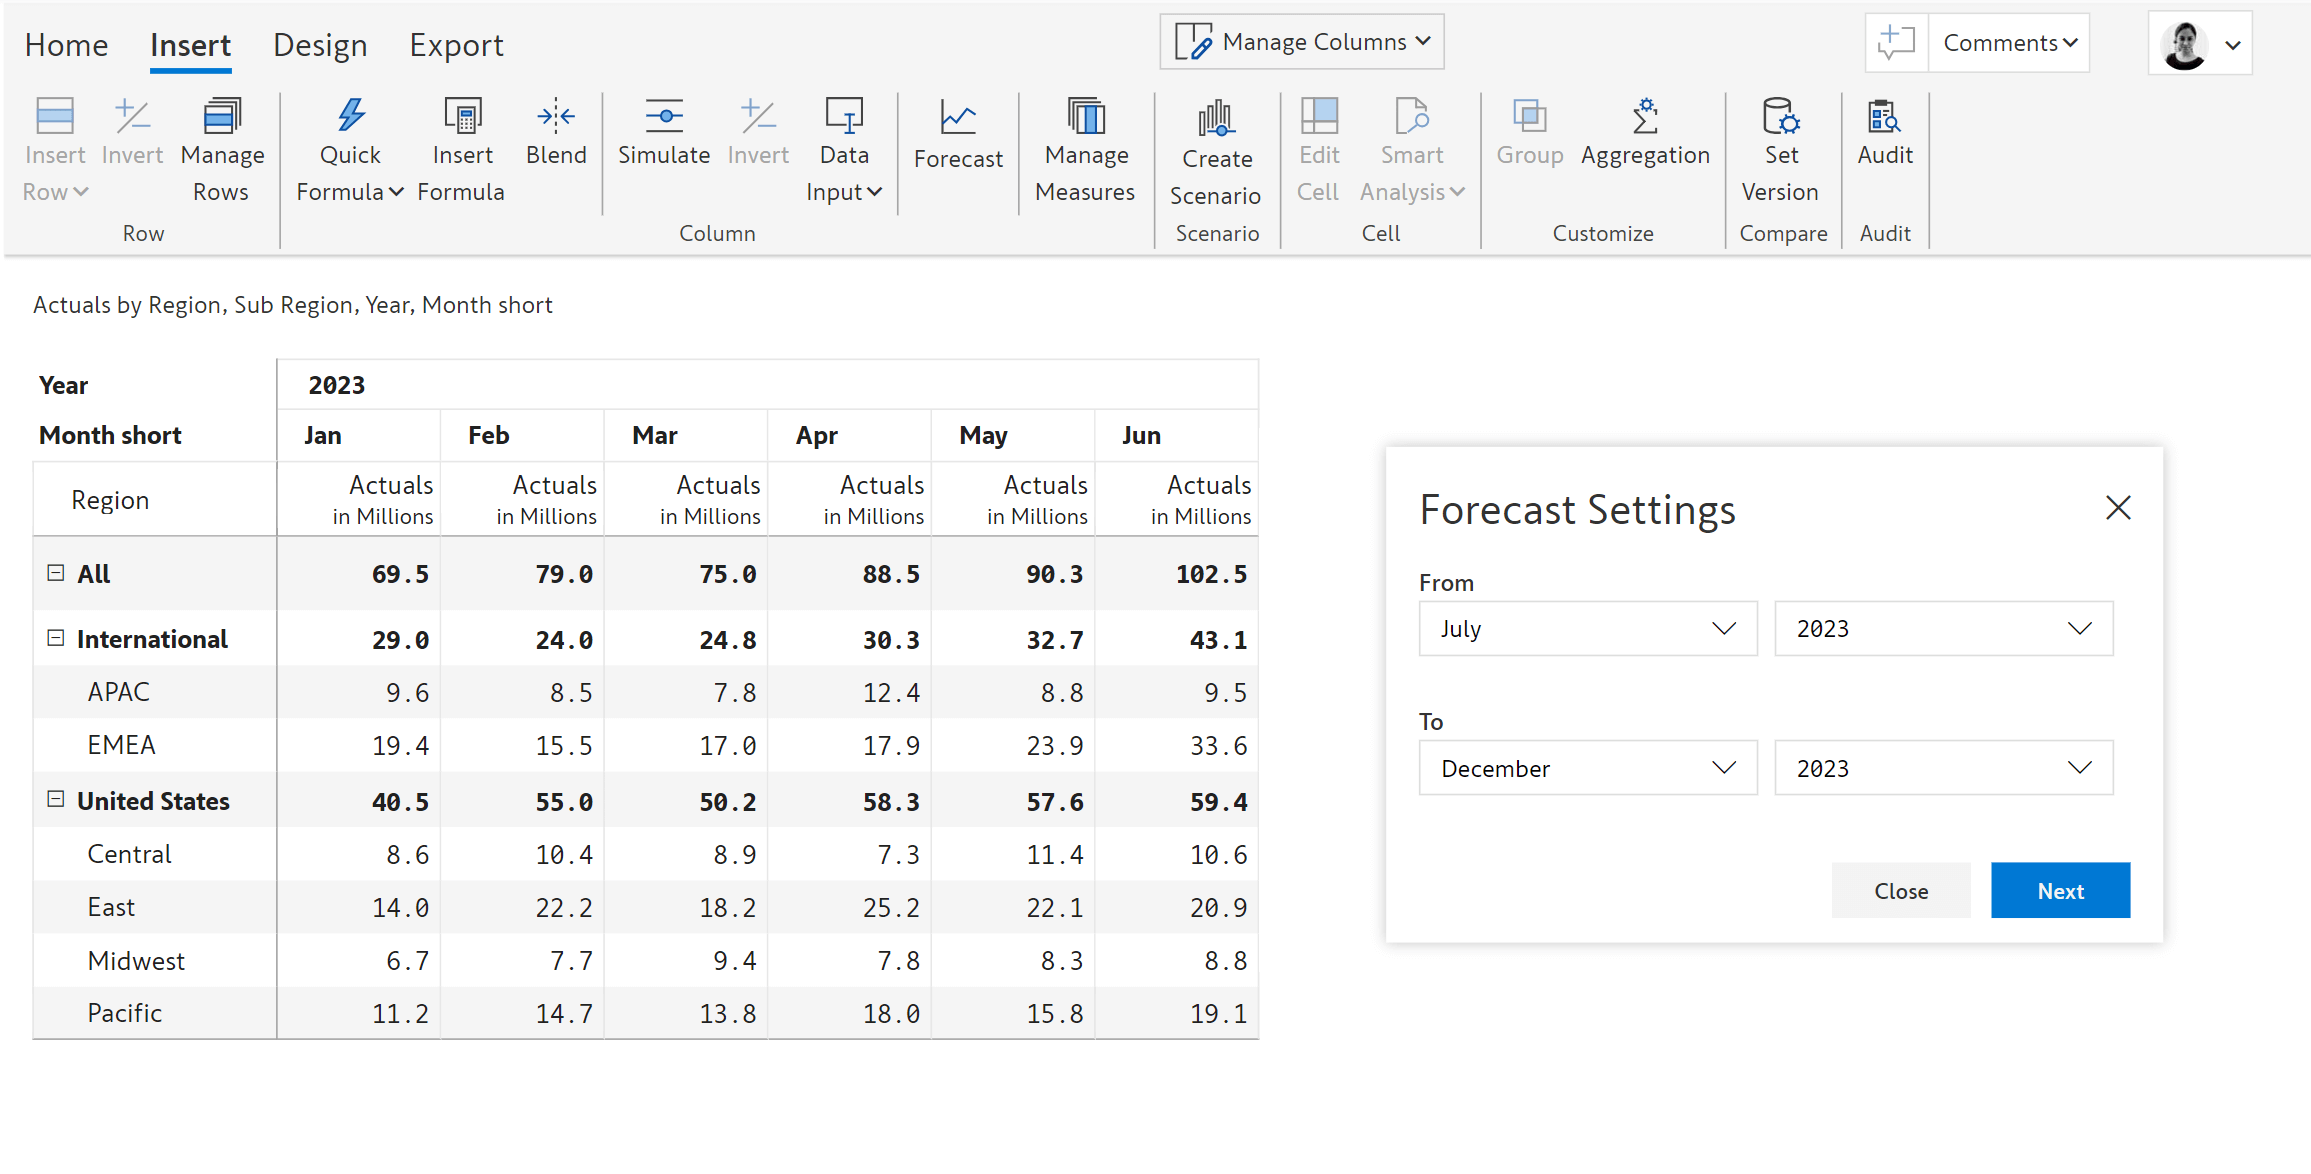
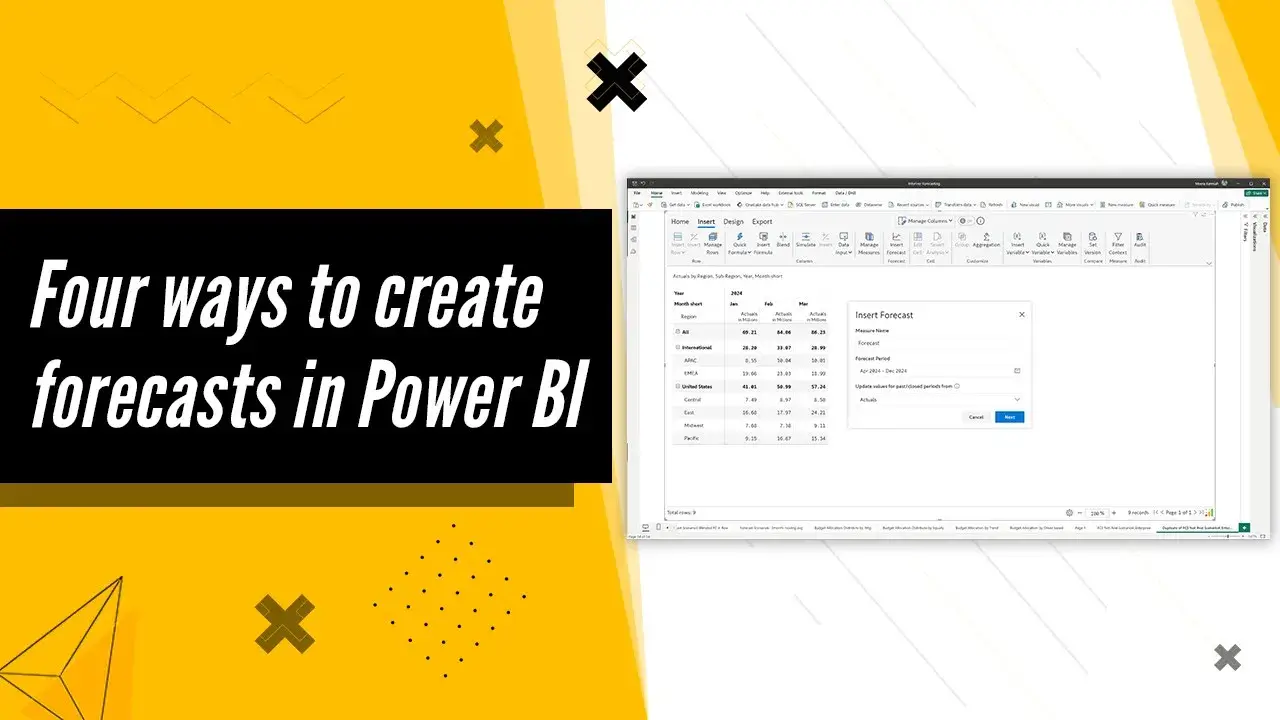
Combine actual data for elapsed periods and forecast data for future periods in a few clicks. In the image below, user is creating a new projection by merging actual data from Jan – Mar and forecast data for the rest of the year.
Add periods that are missing in your Power BI data model directly in the visual for quick projections. Inforiver reconciles these in the future as these periods become available in the data model.
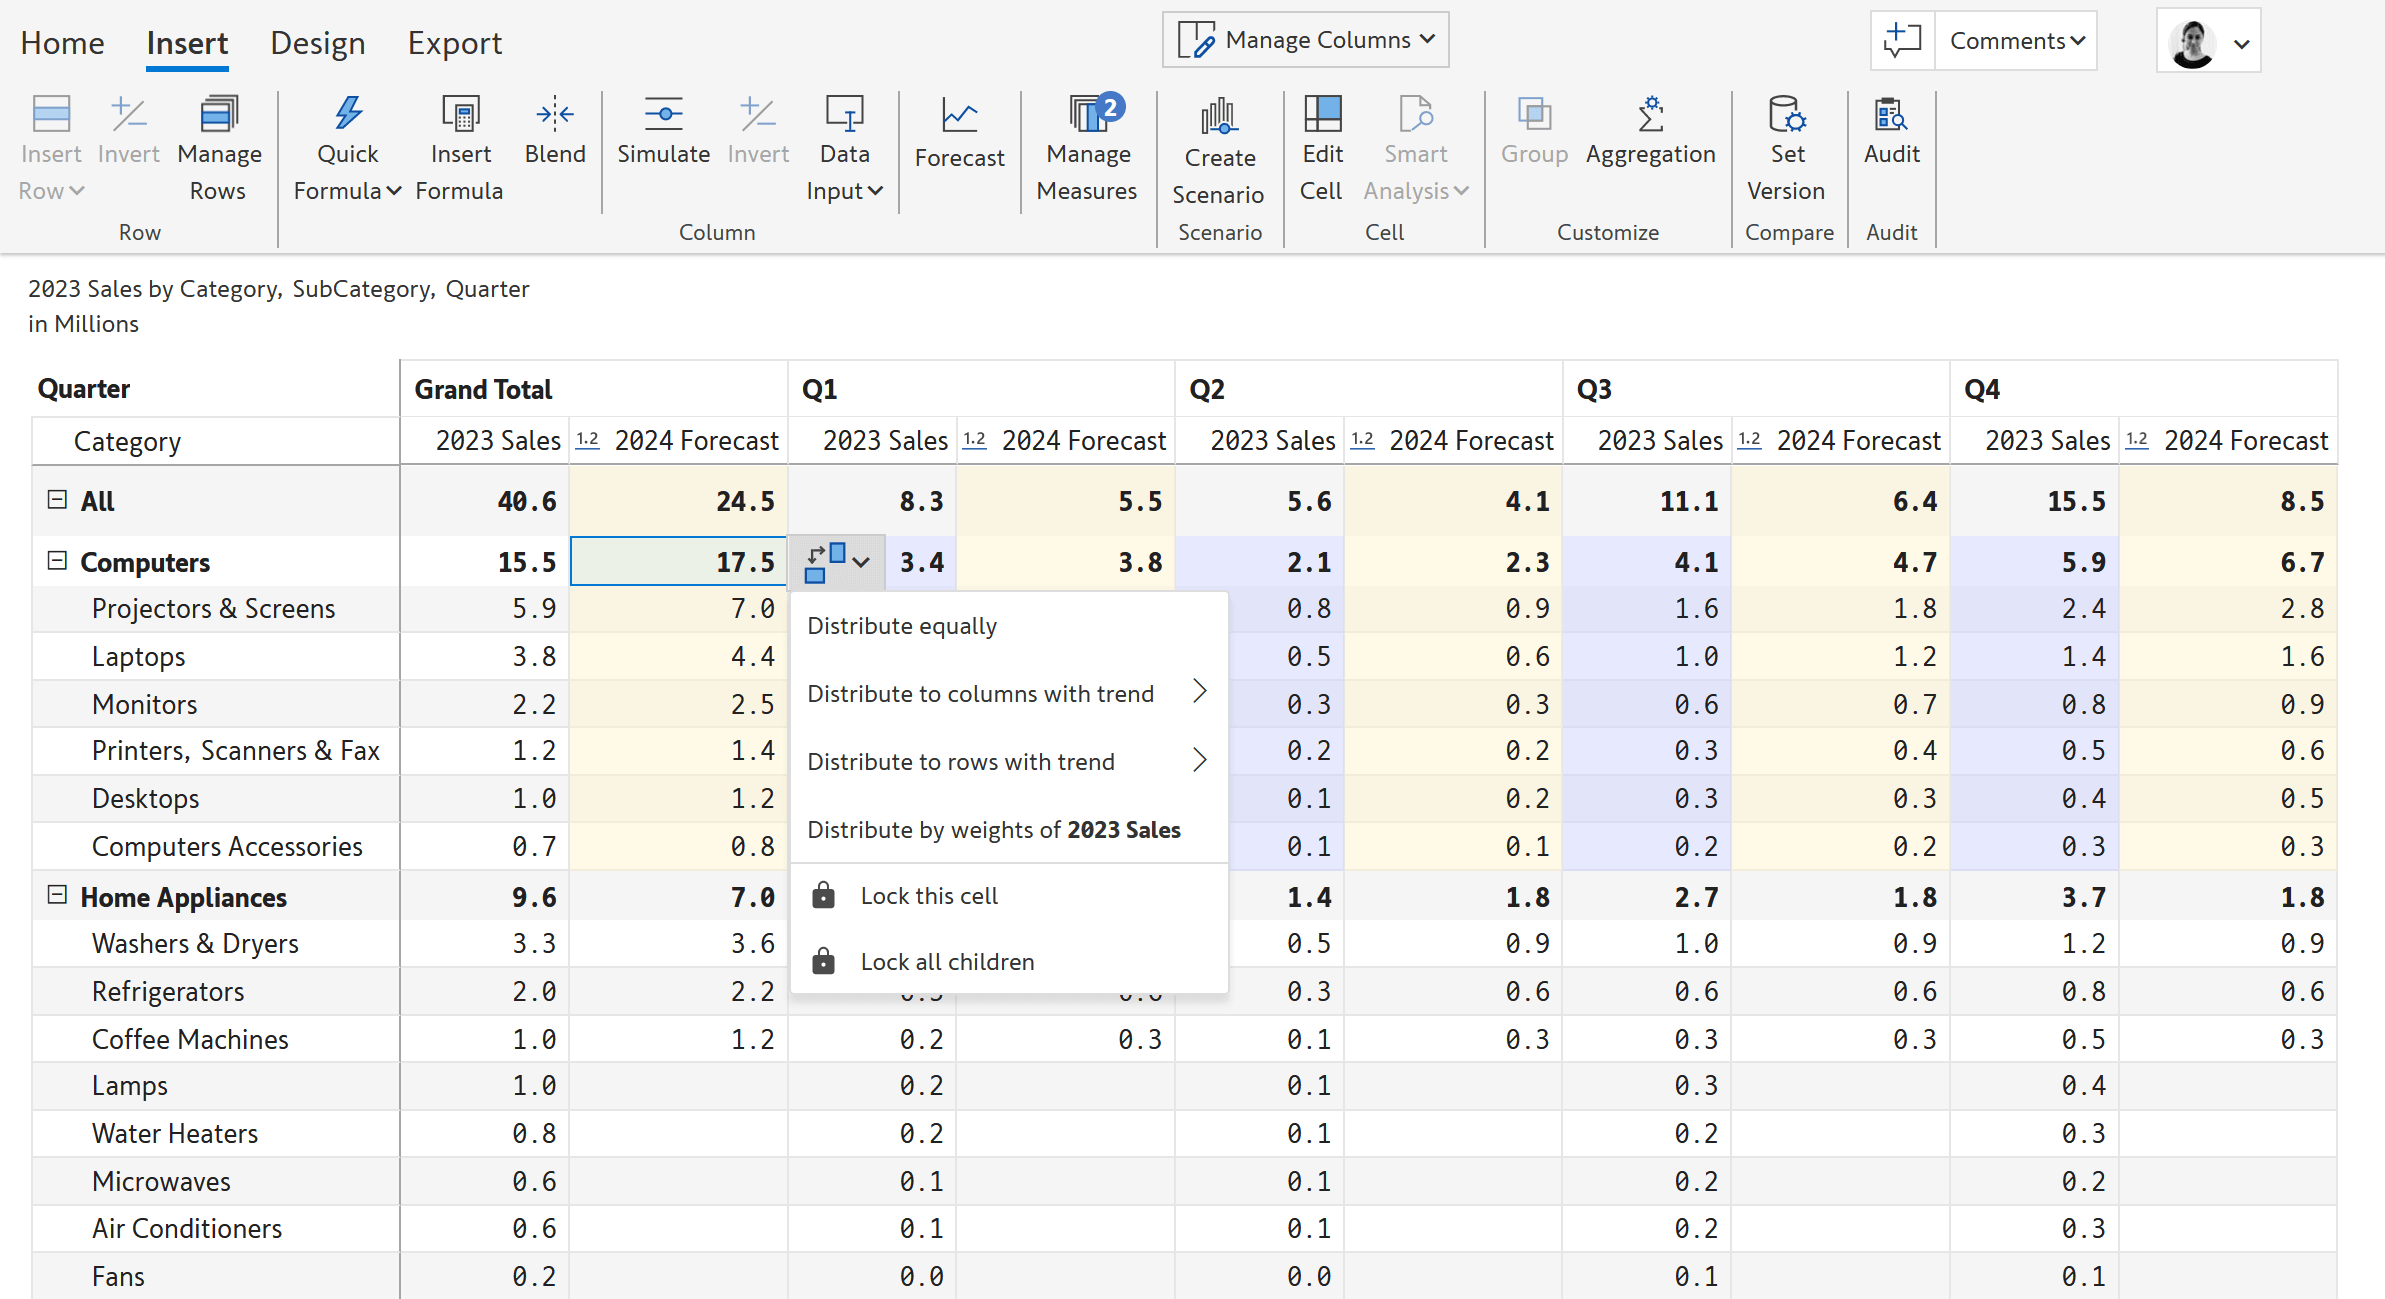
Enter forecasts at the top level and distribute to descendants (departments, teams, geographies, months, etc.) or based on weights of other series.
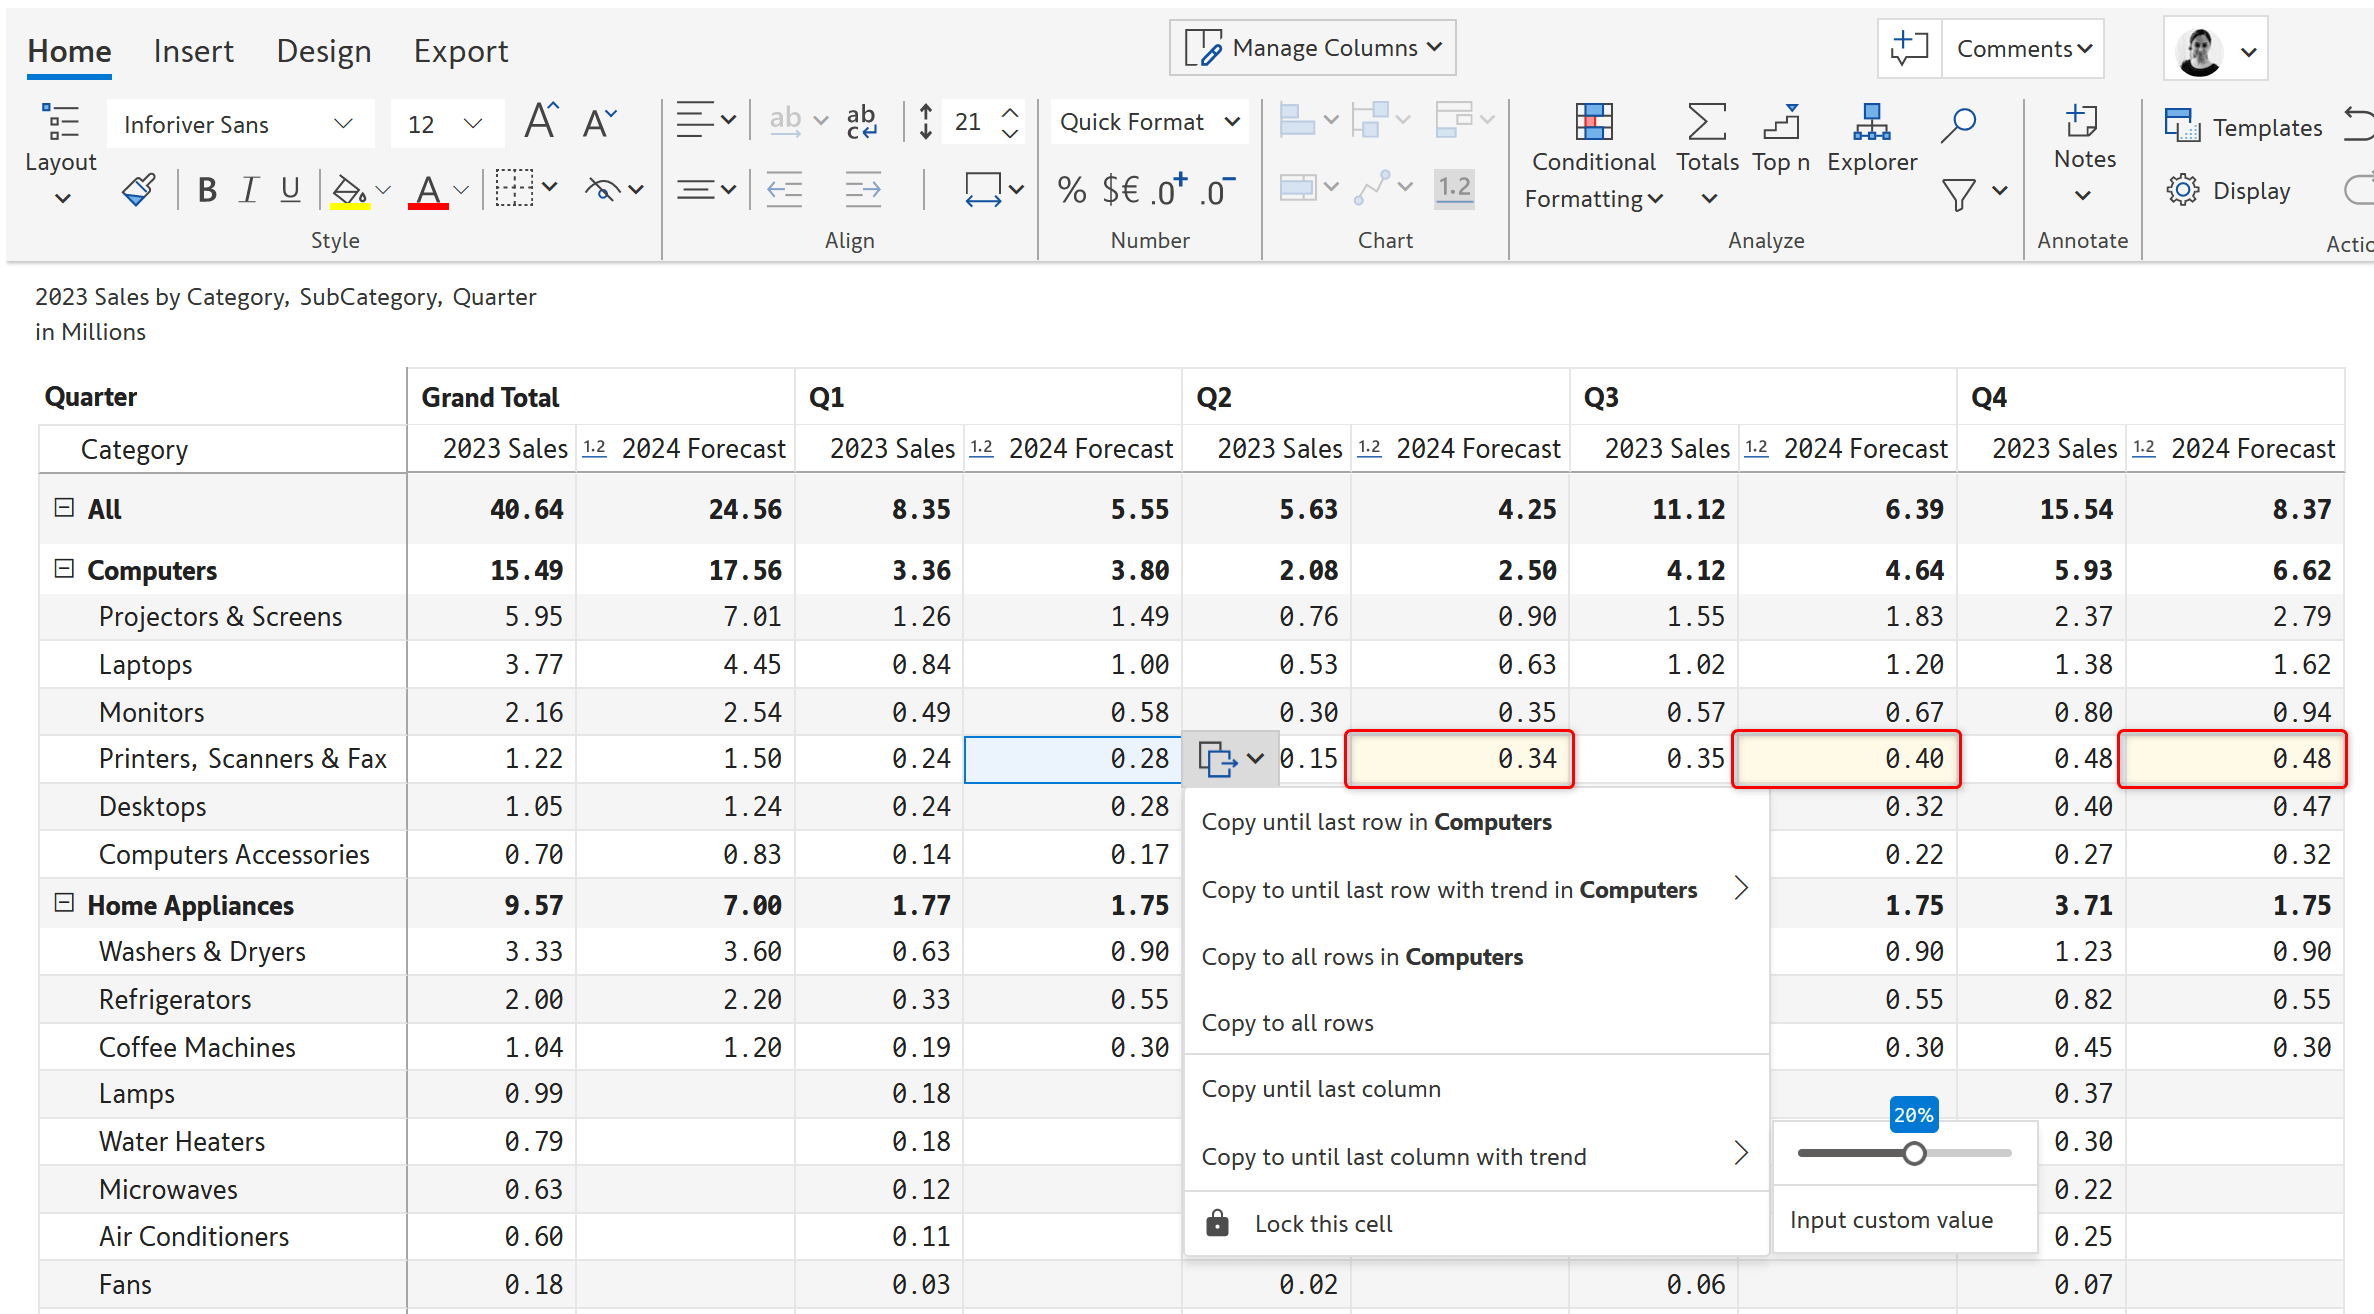
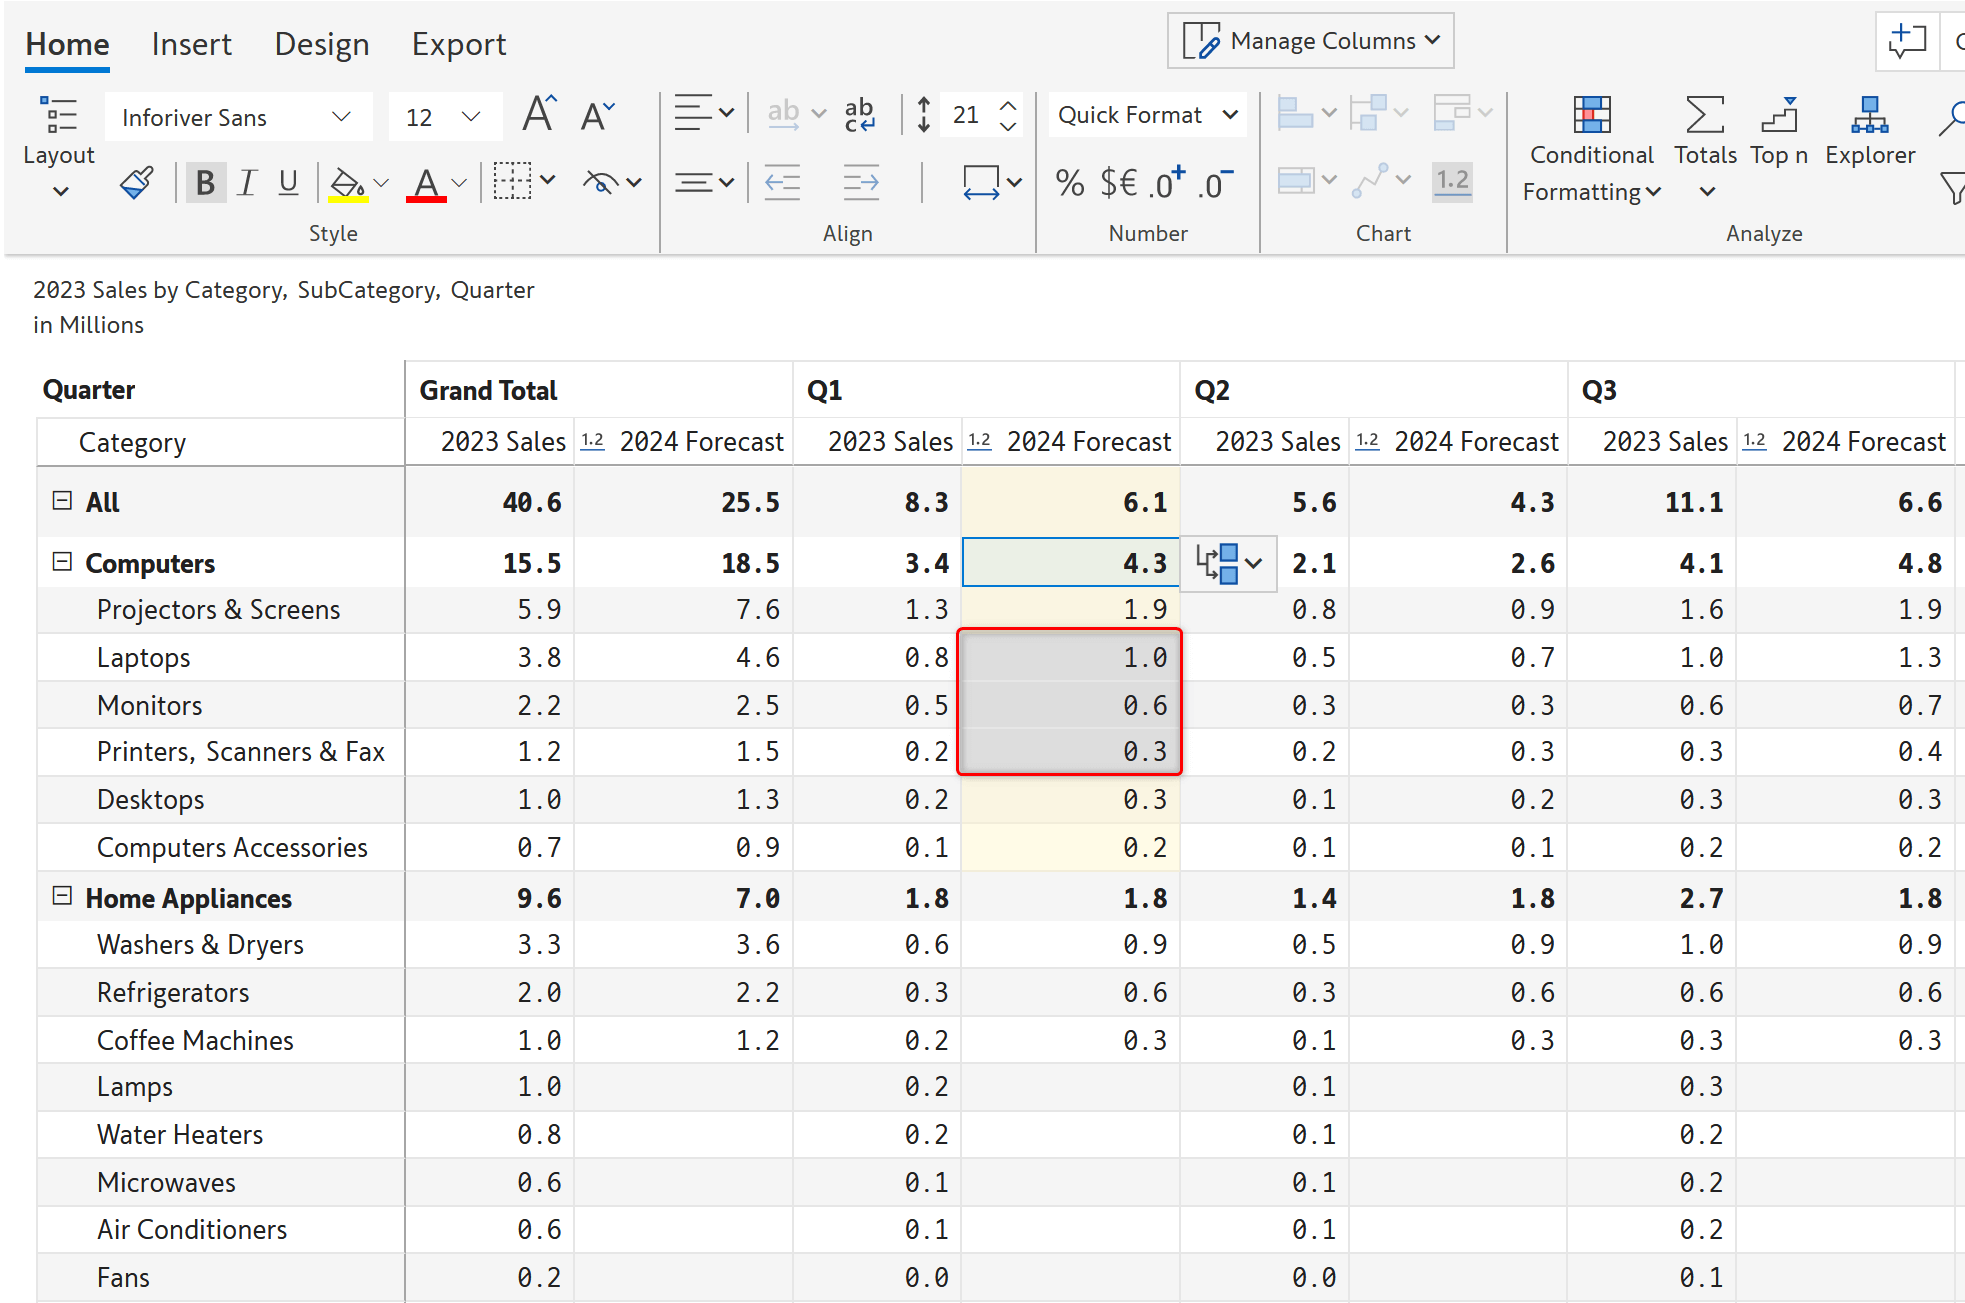
Copy values across other rows and columns, and apply percentage trends if needed.
Lock a range of cells and prevent changes while forecasting. Block specific cells or entire hierarchy branches.
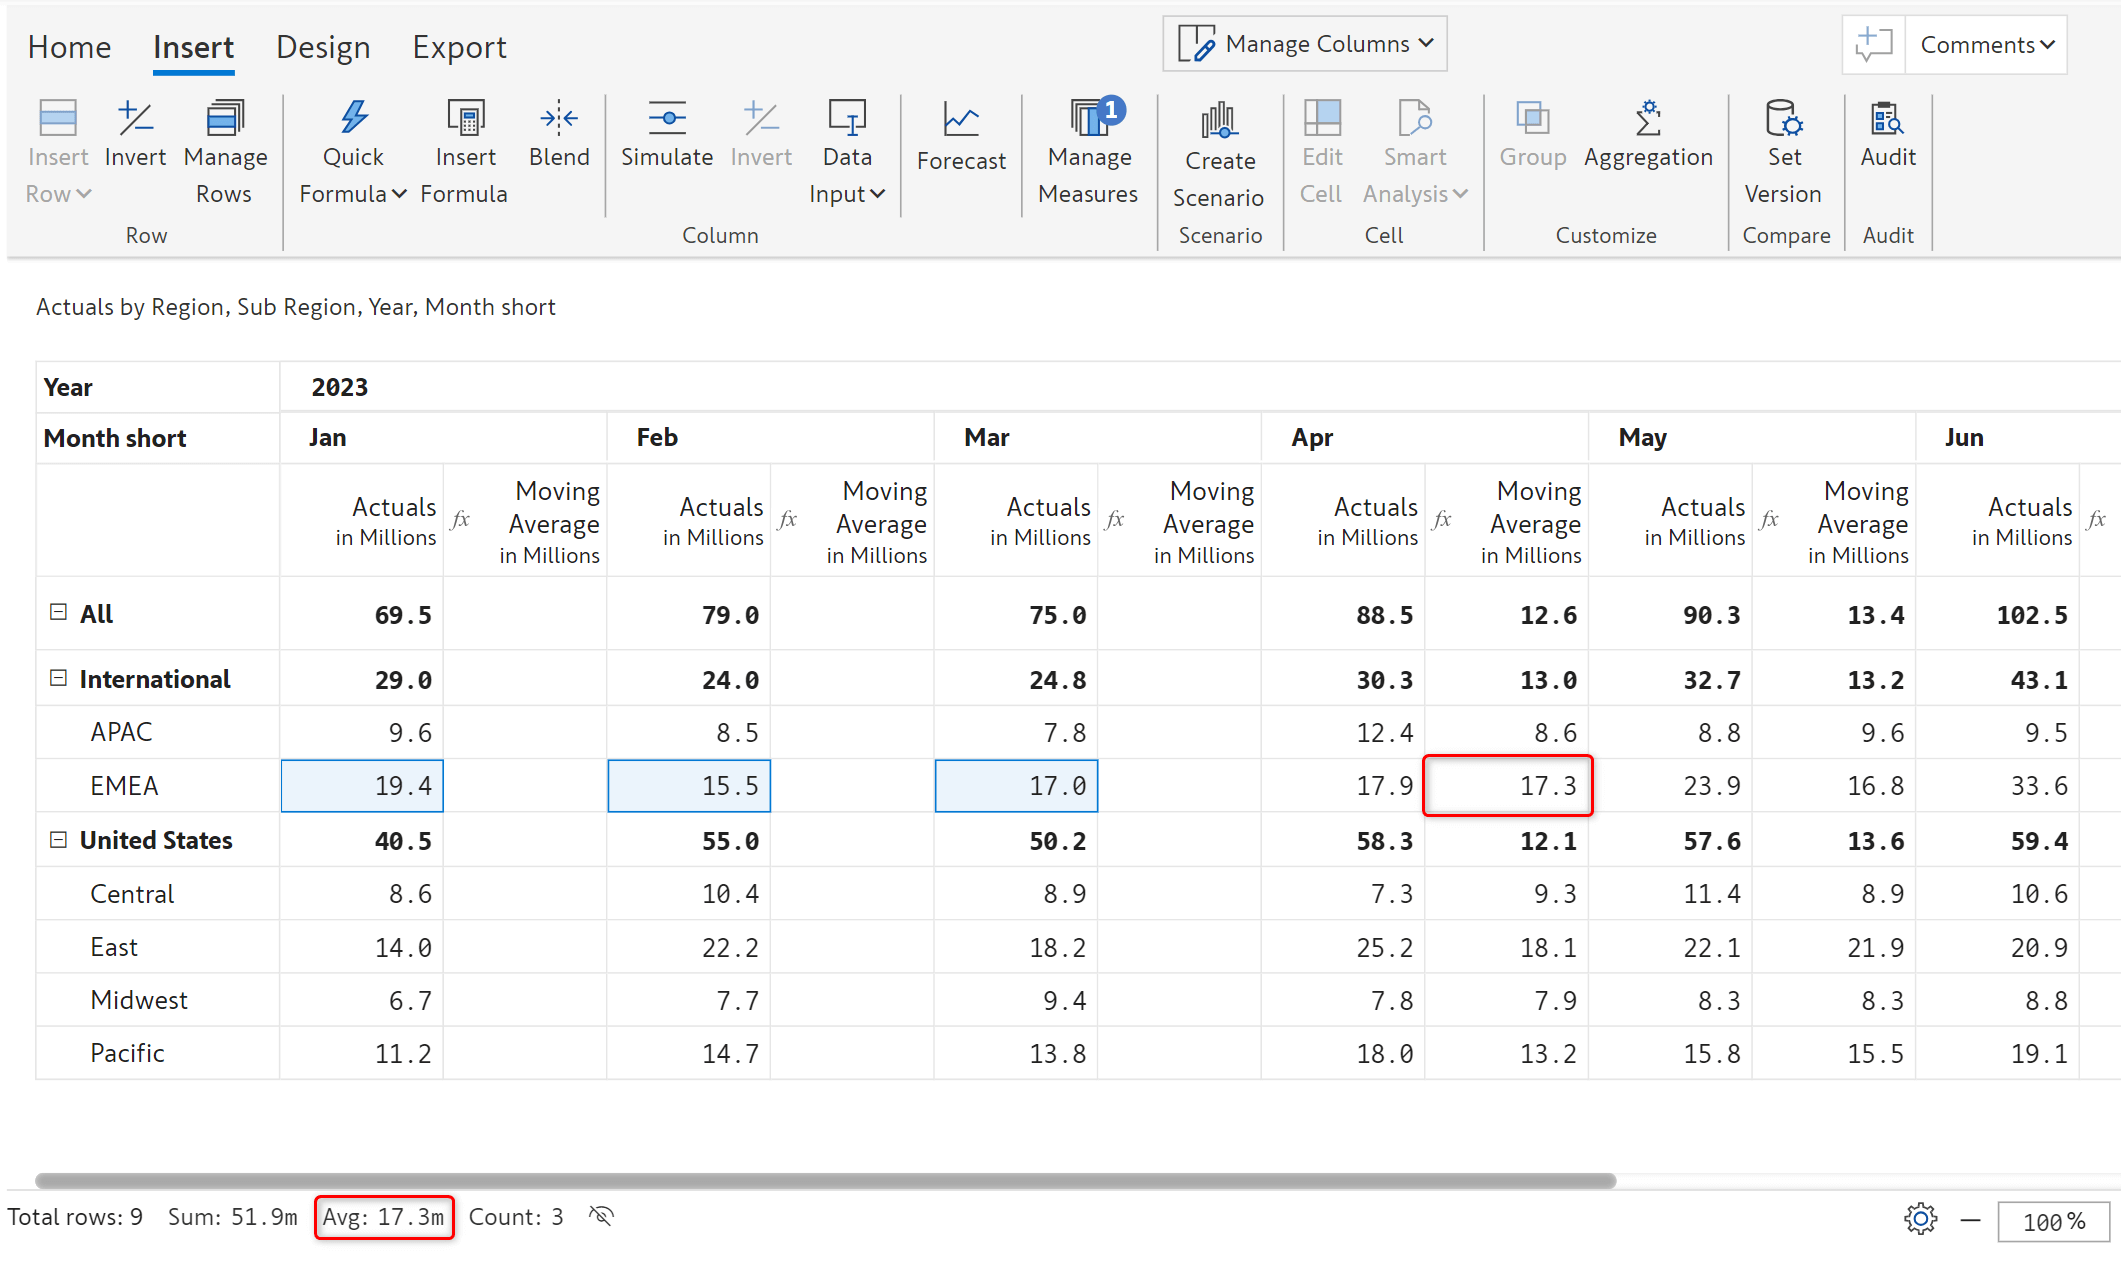
Implement quick forecasting techniques such as the 3-month moving average forecast.
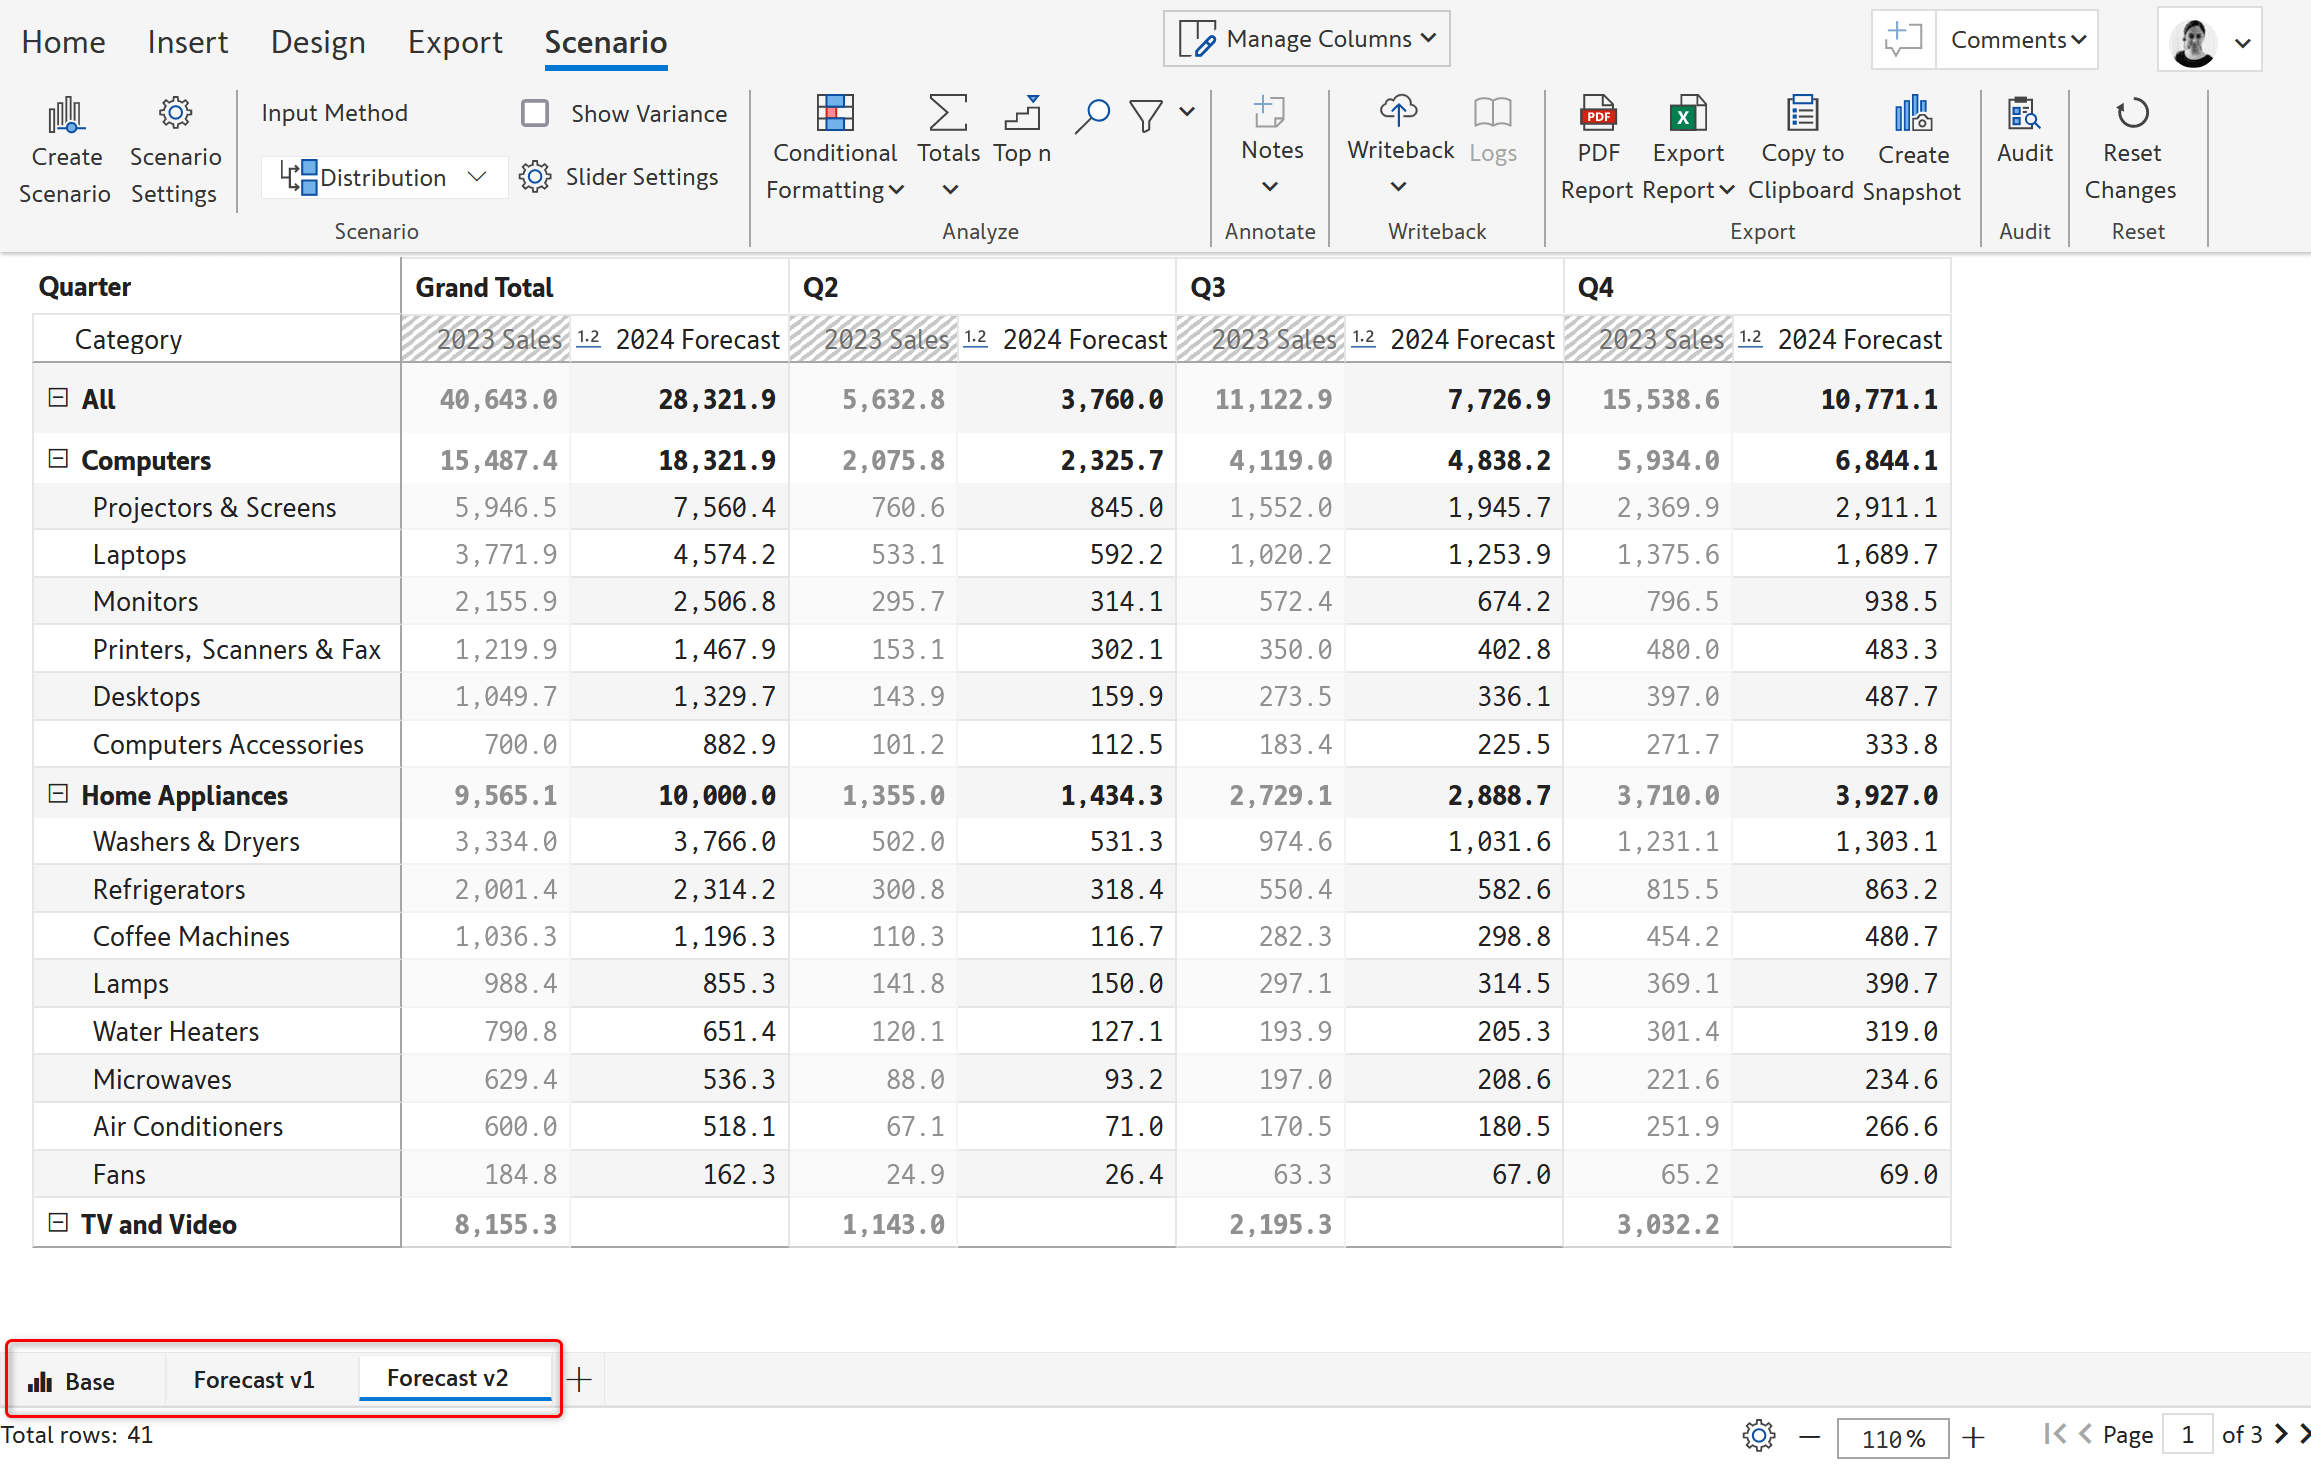
Create and compare multiple forecast versions using ‘scenarios’ and write them back. Scenarios can be created in both the edit and read modes and shared publicly or only with specific users in the organization. You can write back all or particular scenarios.
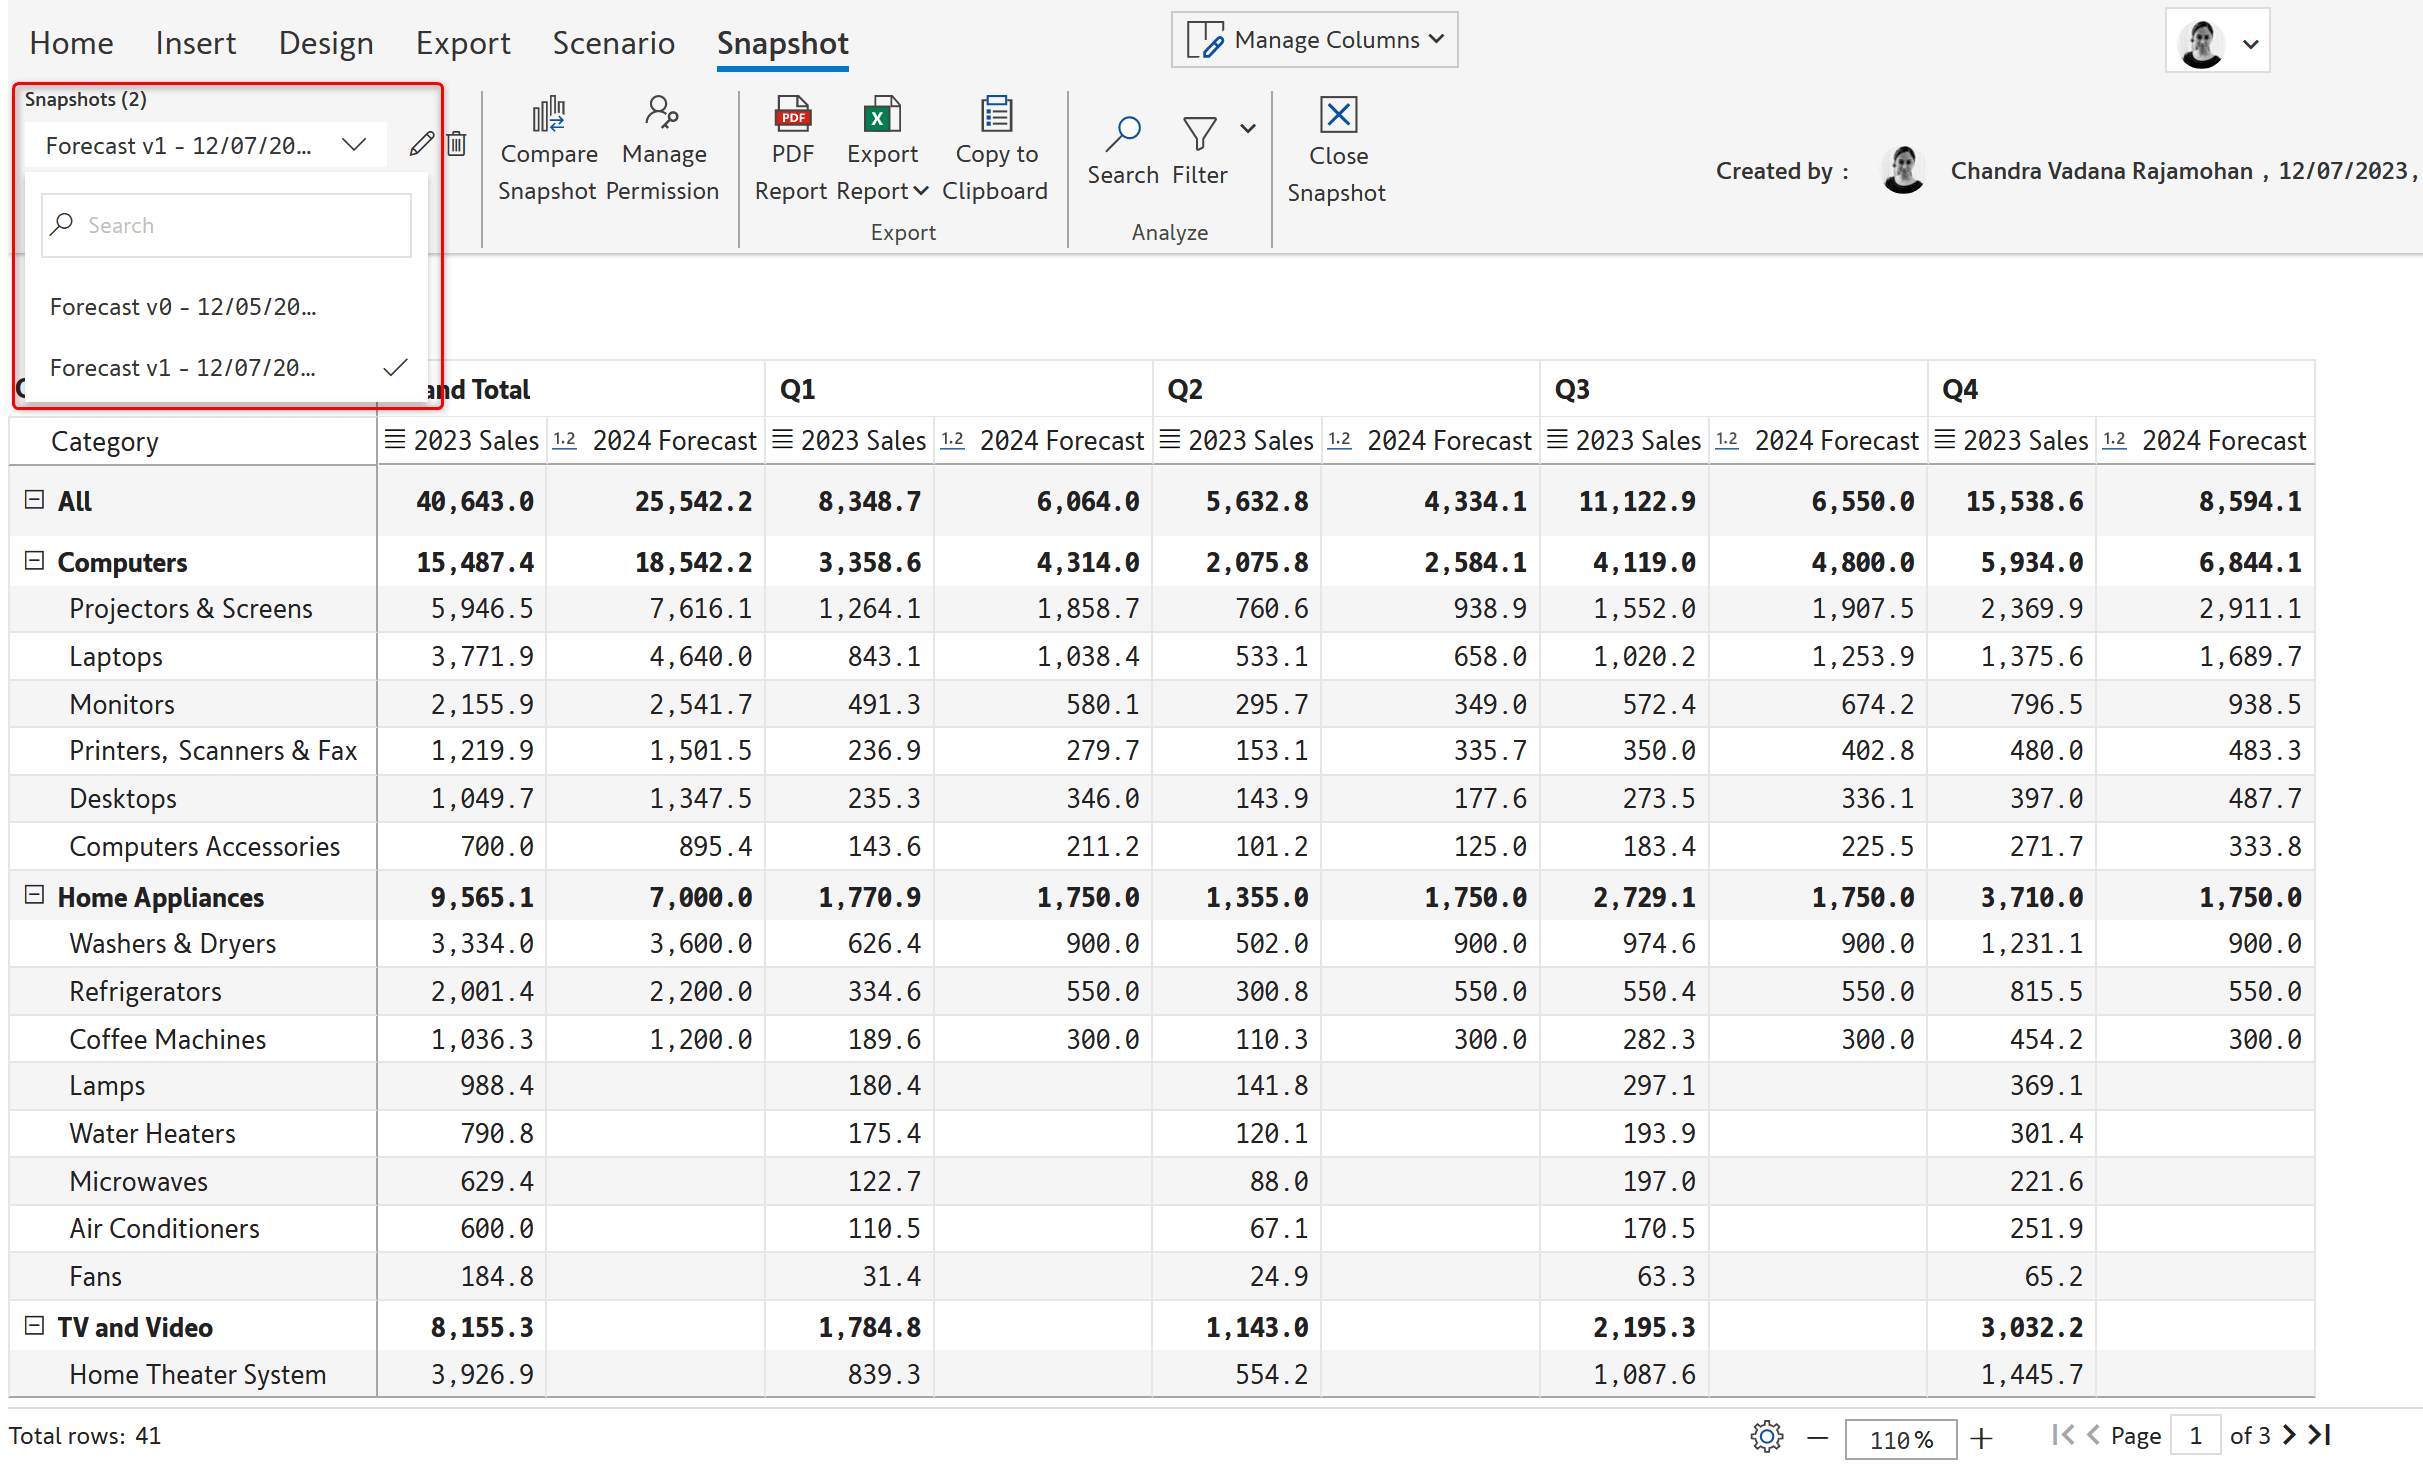
Save the current state of the report as a static snapshot at month-end accounting/financial close. Compare multiple snapshots to see how forecasts have evolved over time. Snapshots preserve original data and are not impacted by source data changes and dataset refreshes.
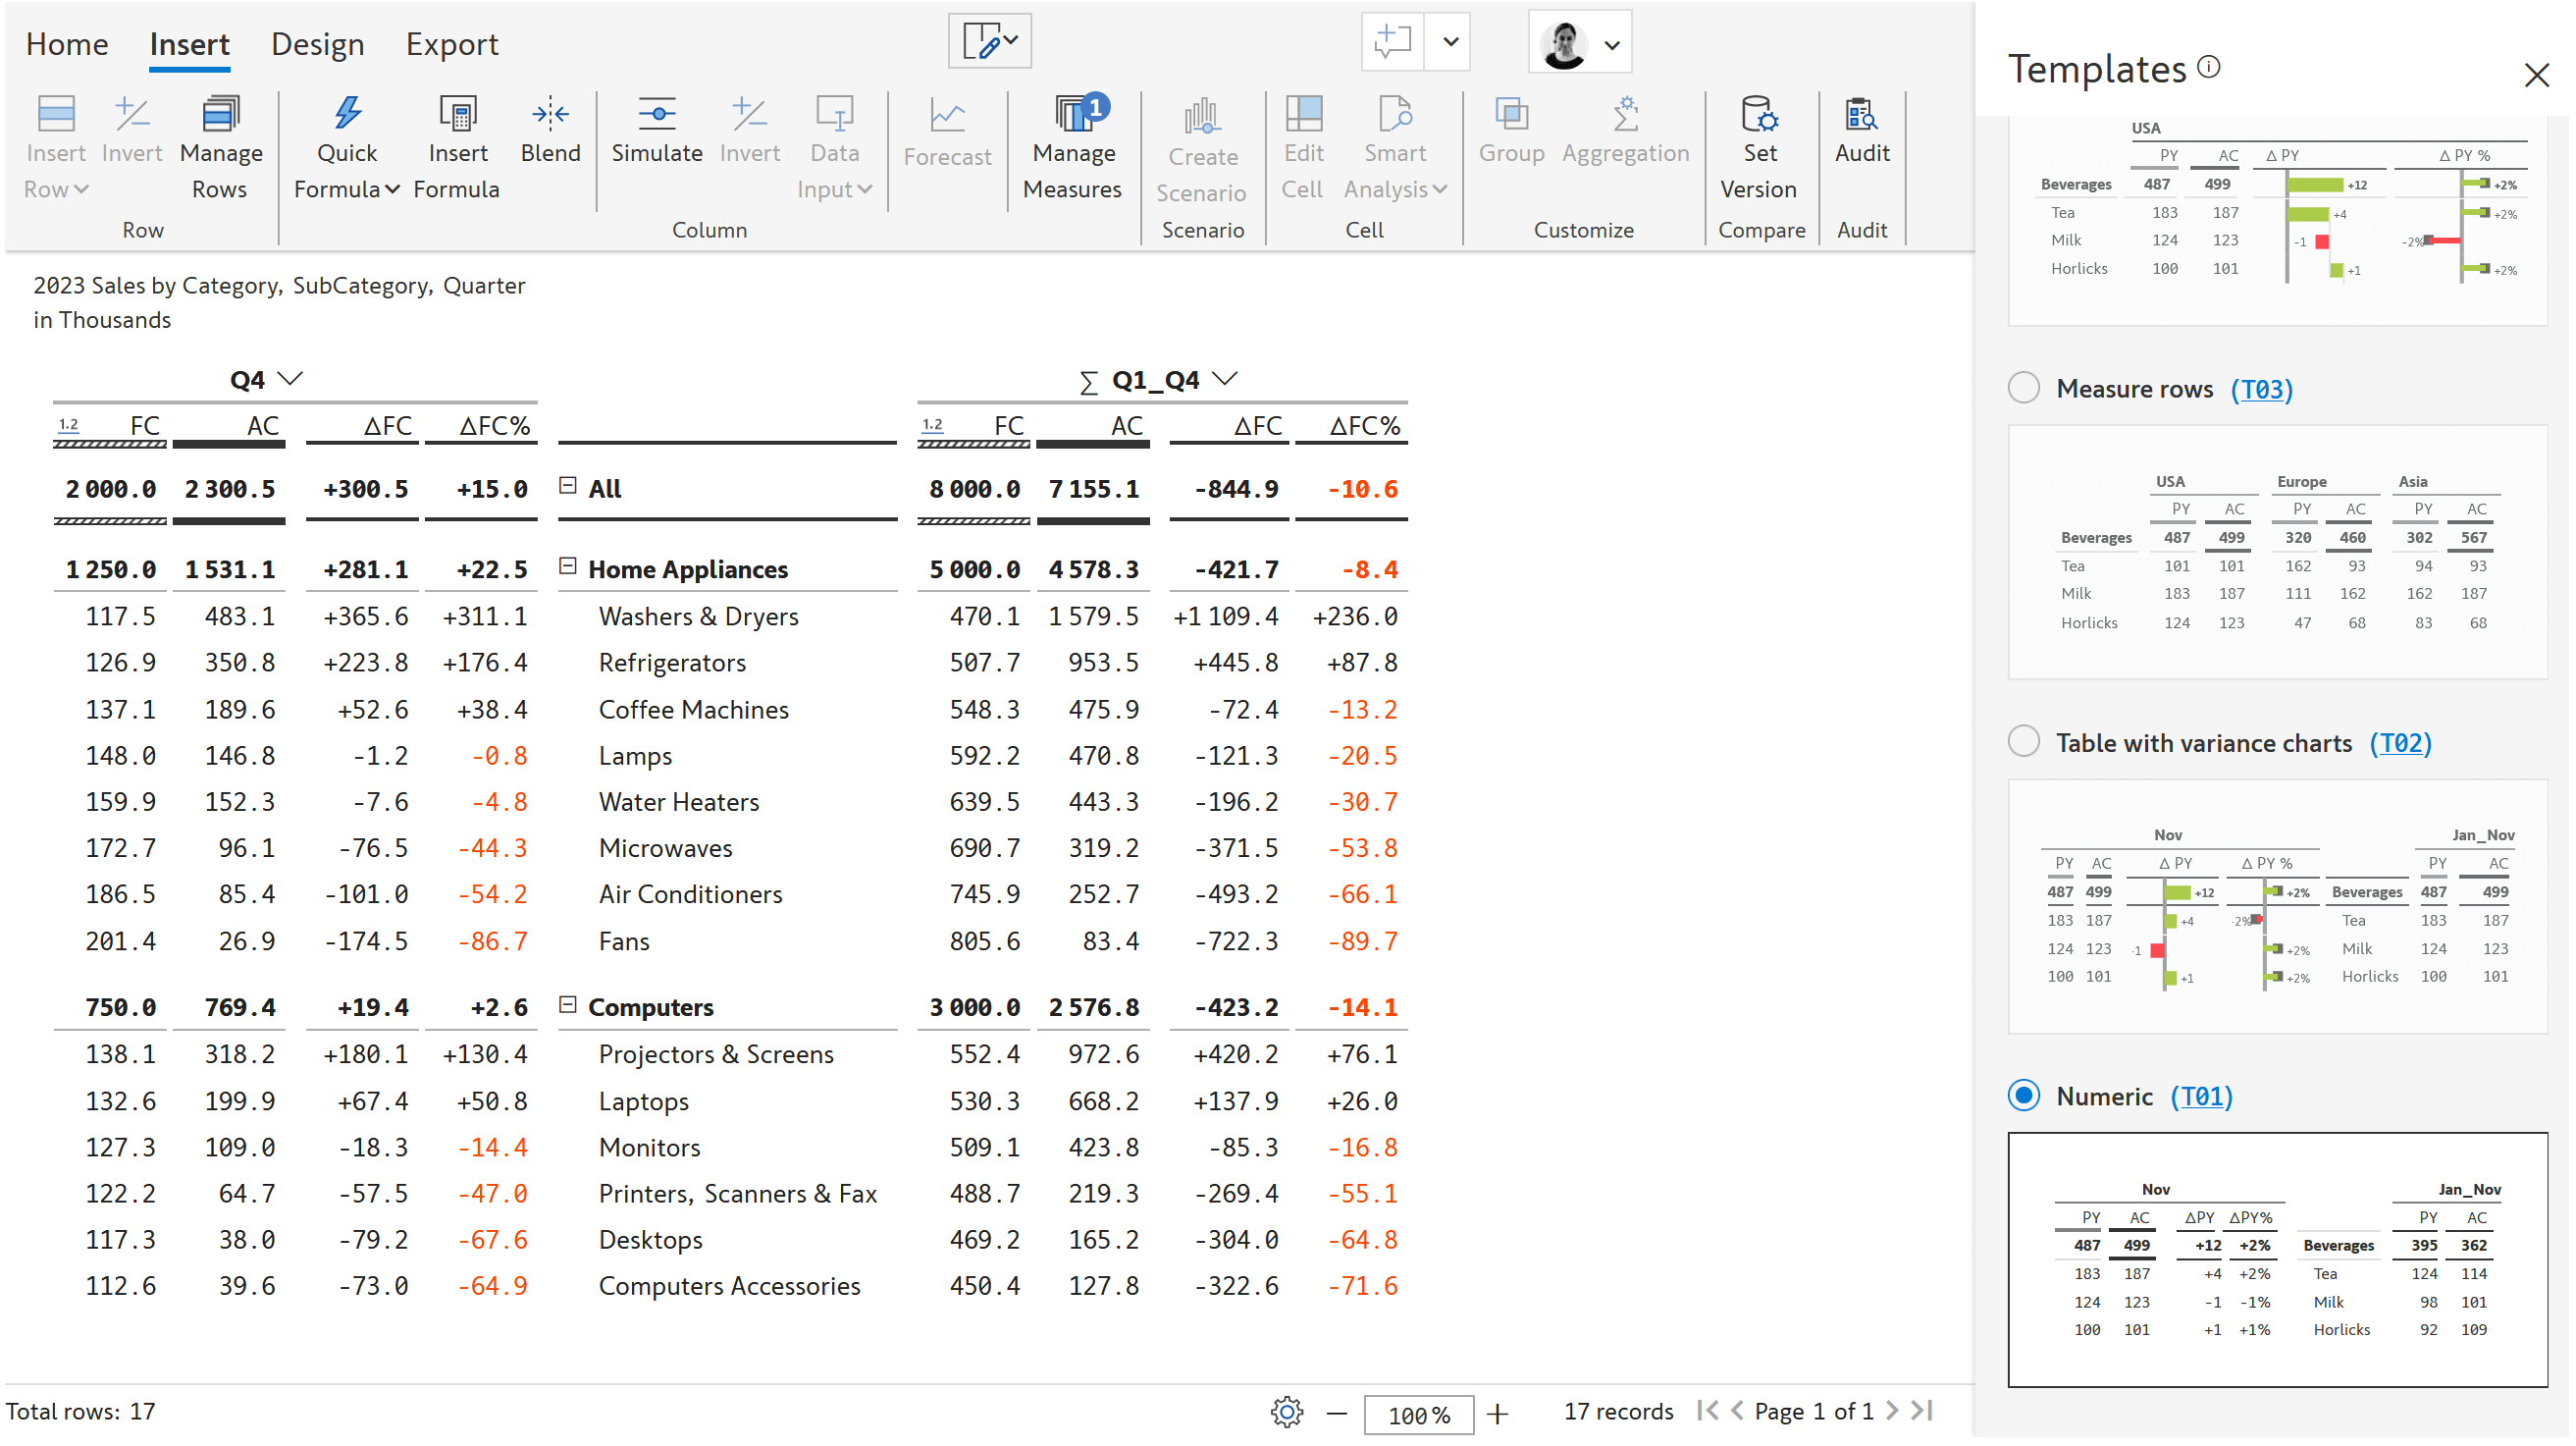
Perform a one-click variance analysis between various versions of forecasts and actual performance using IBCS templates.
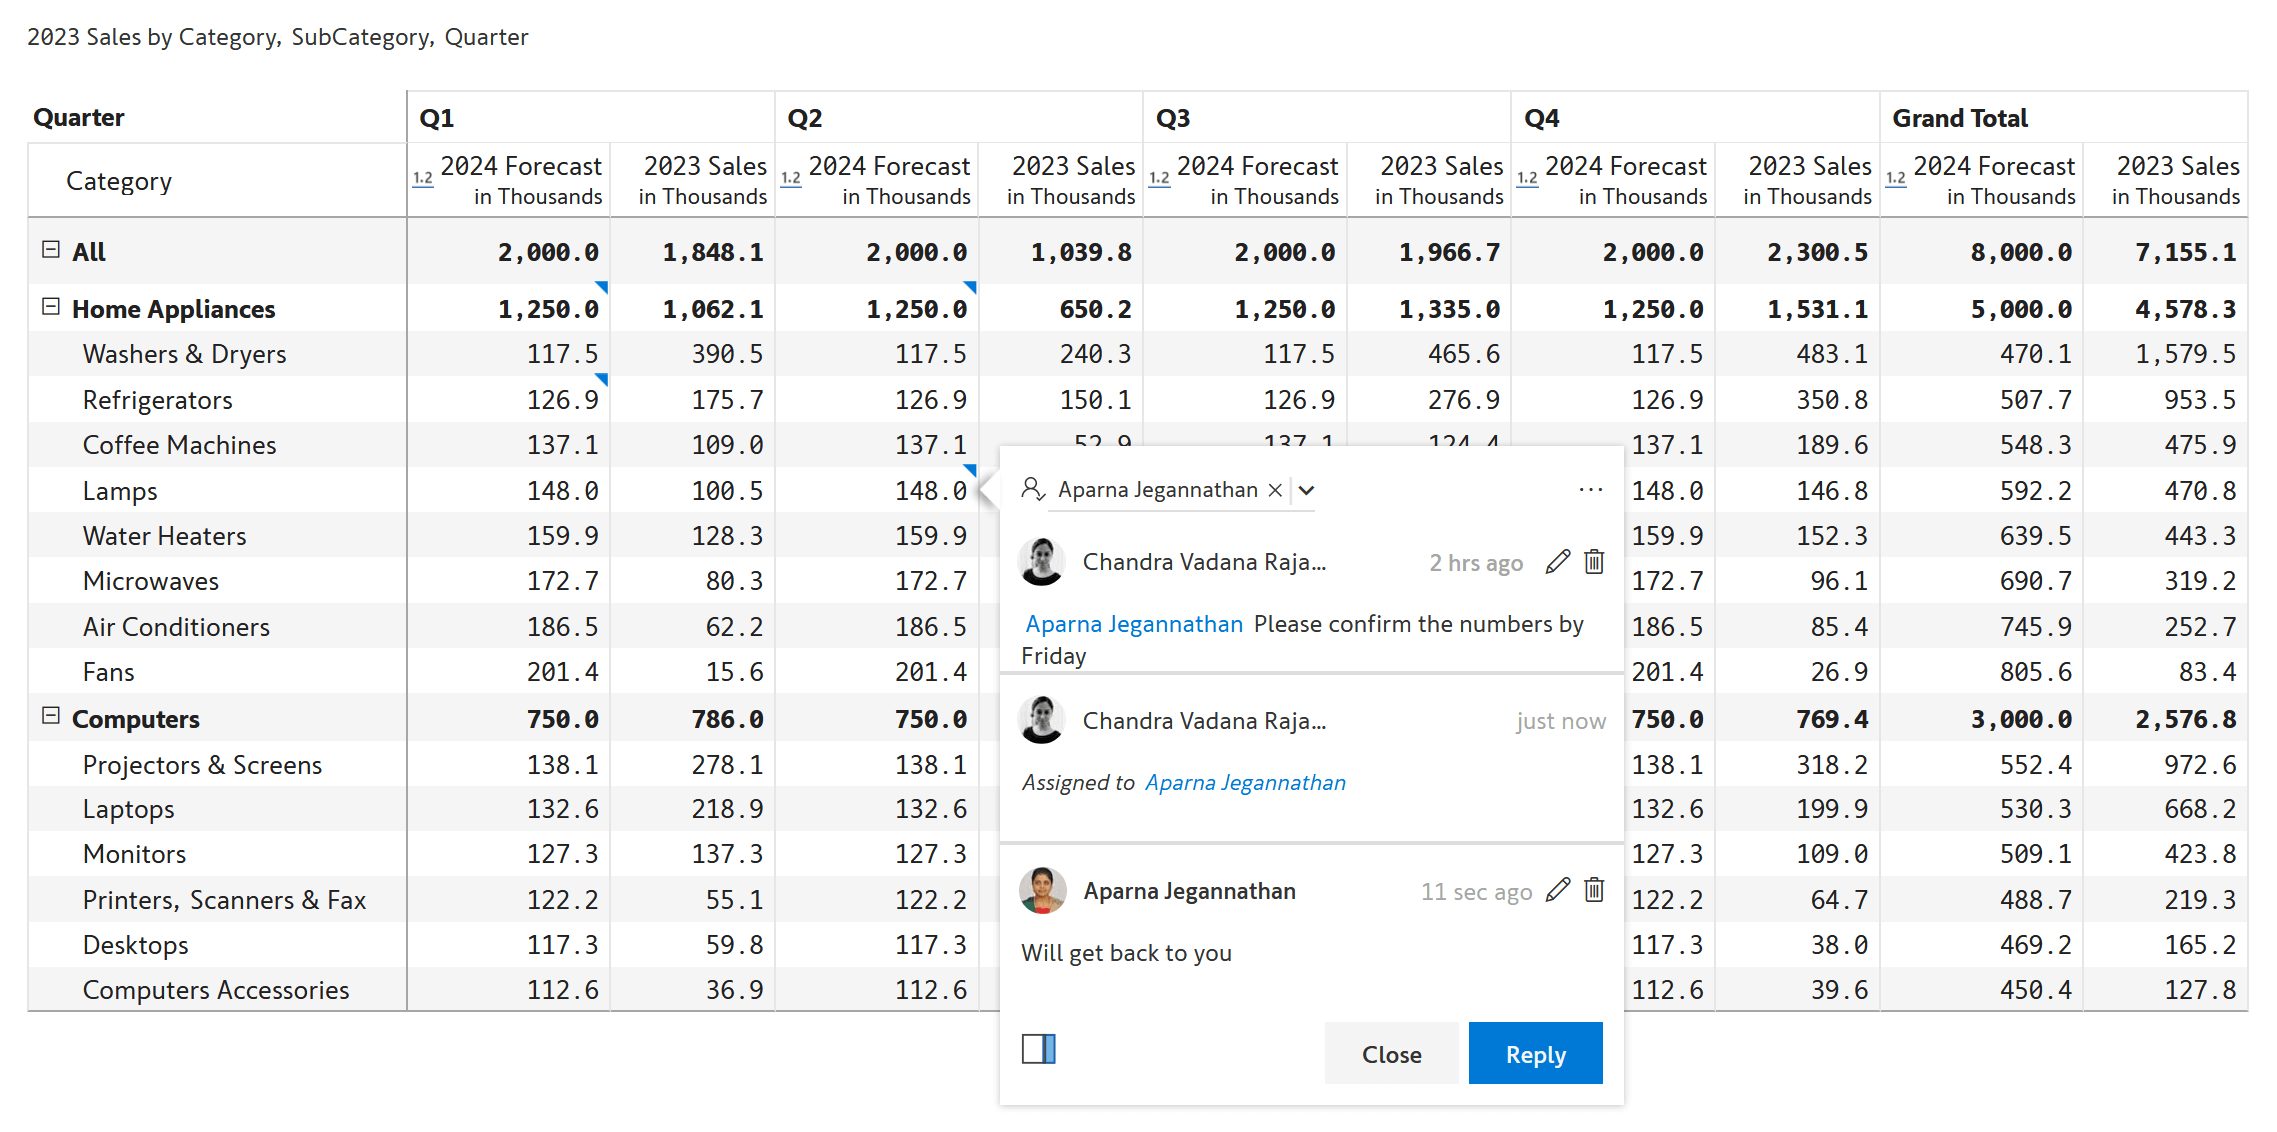
Add context to your reports, such as cell, row, column level comments, and comments column. Save comments securely to the database along with author and time stamp details.
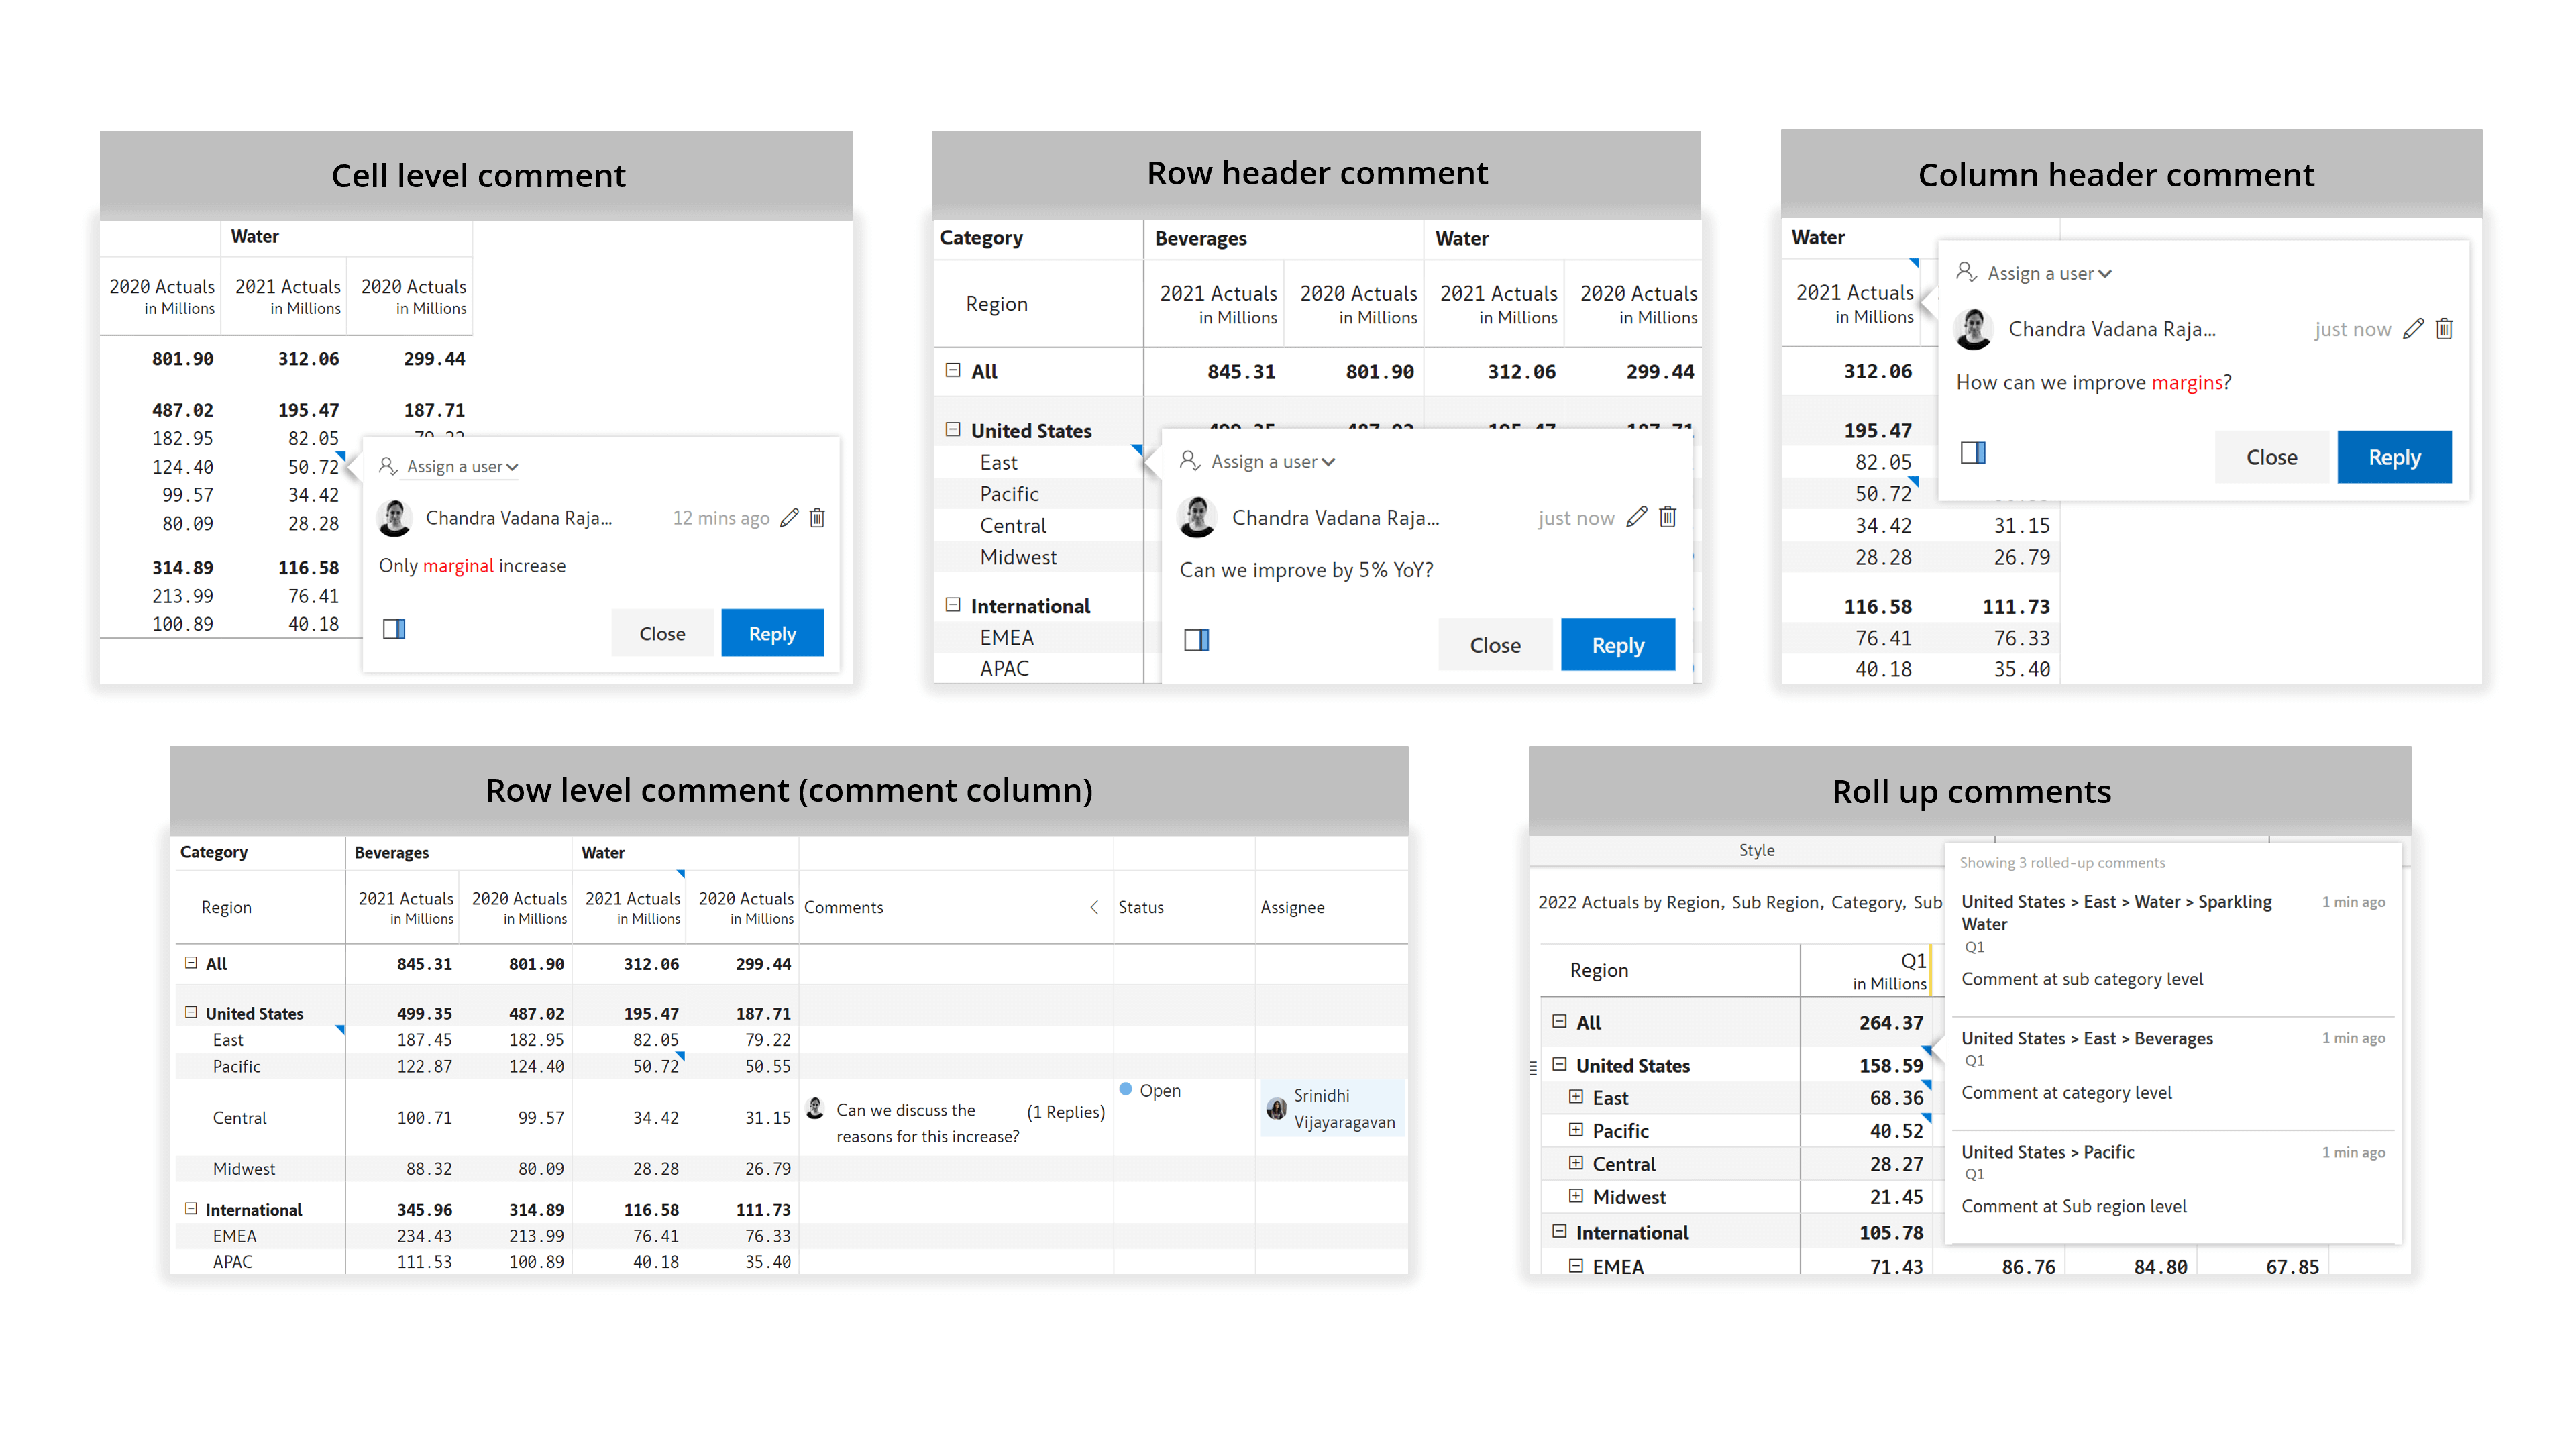
Use the @ symbol to tag other stakeholders and reply to comments posted by other users. Assign and track task status as needed. Receive instant email notifications when someone responds to you, mentions you, or assigns a task to you.
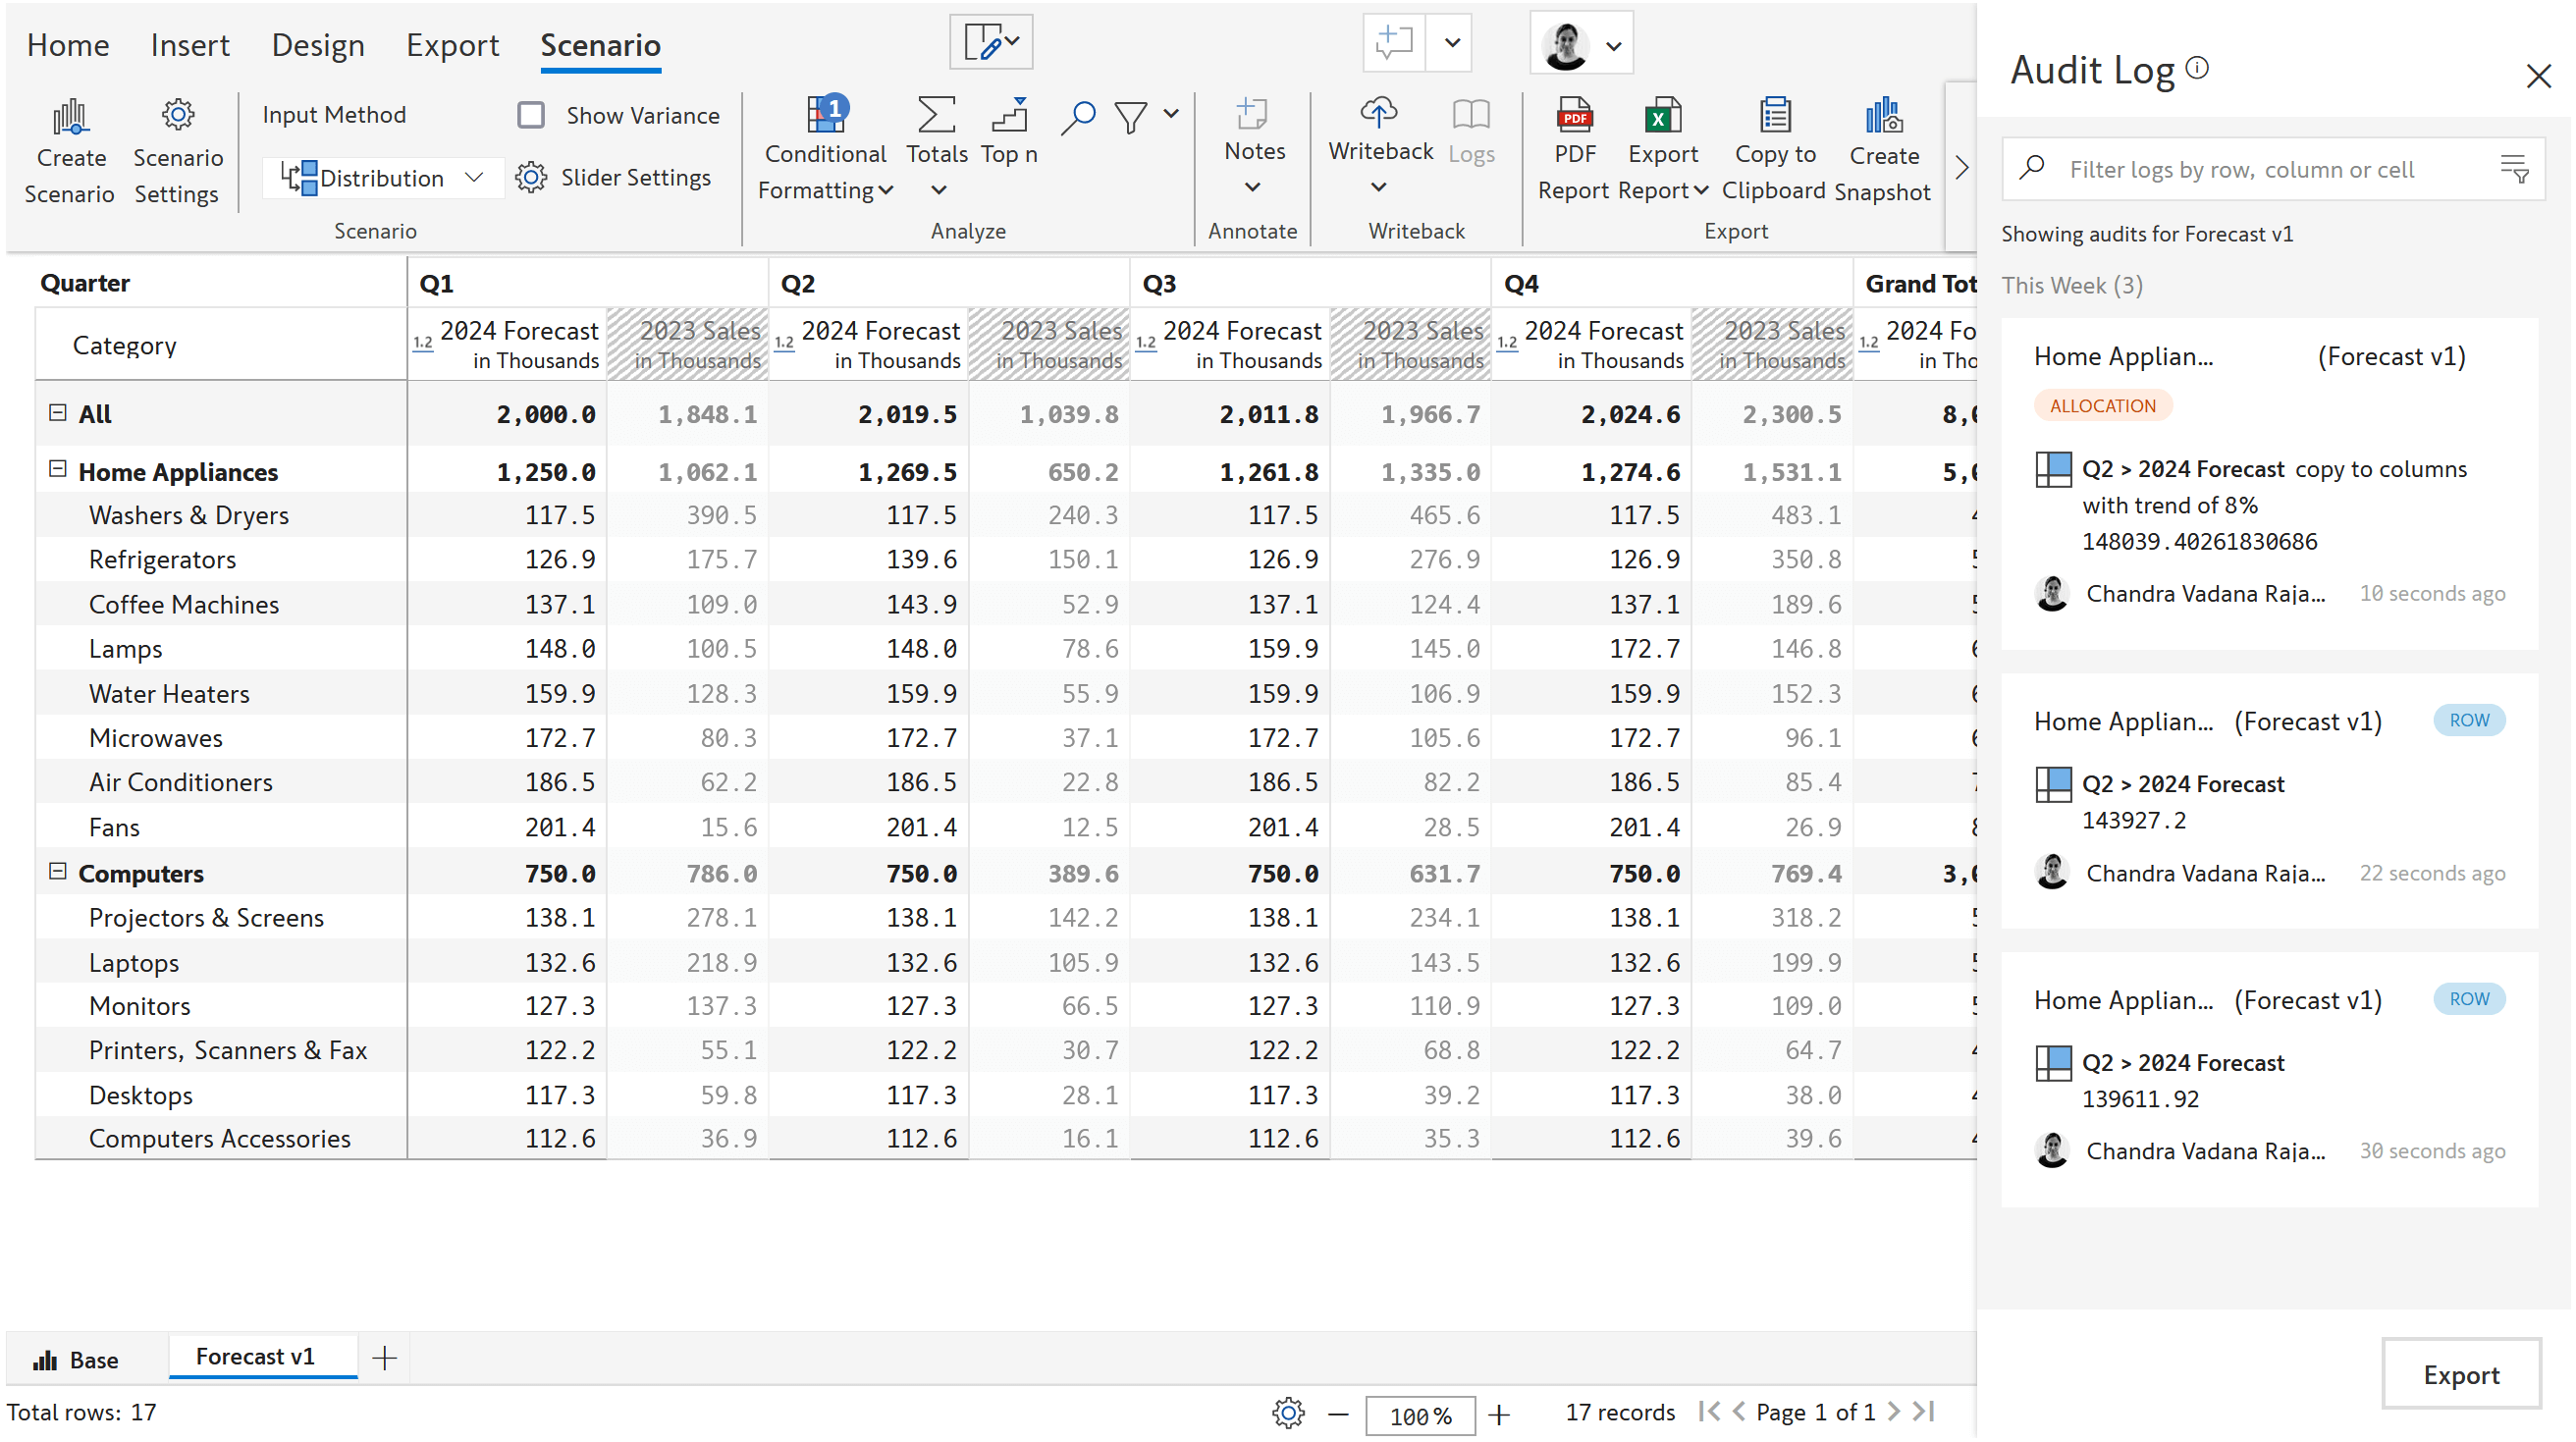
Audit and explore changes made to the report (who-what-when) using the audit log. Export audit details to an Excel file.
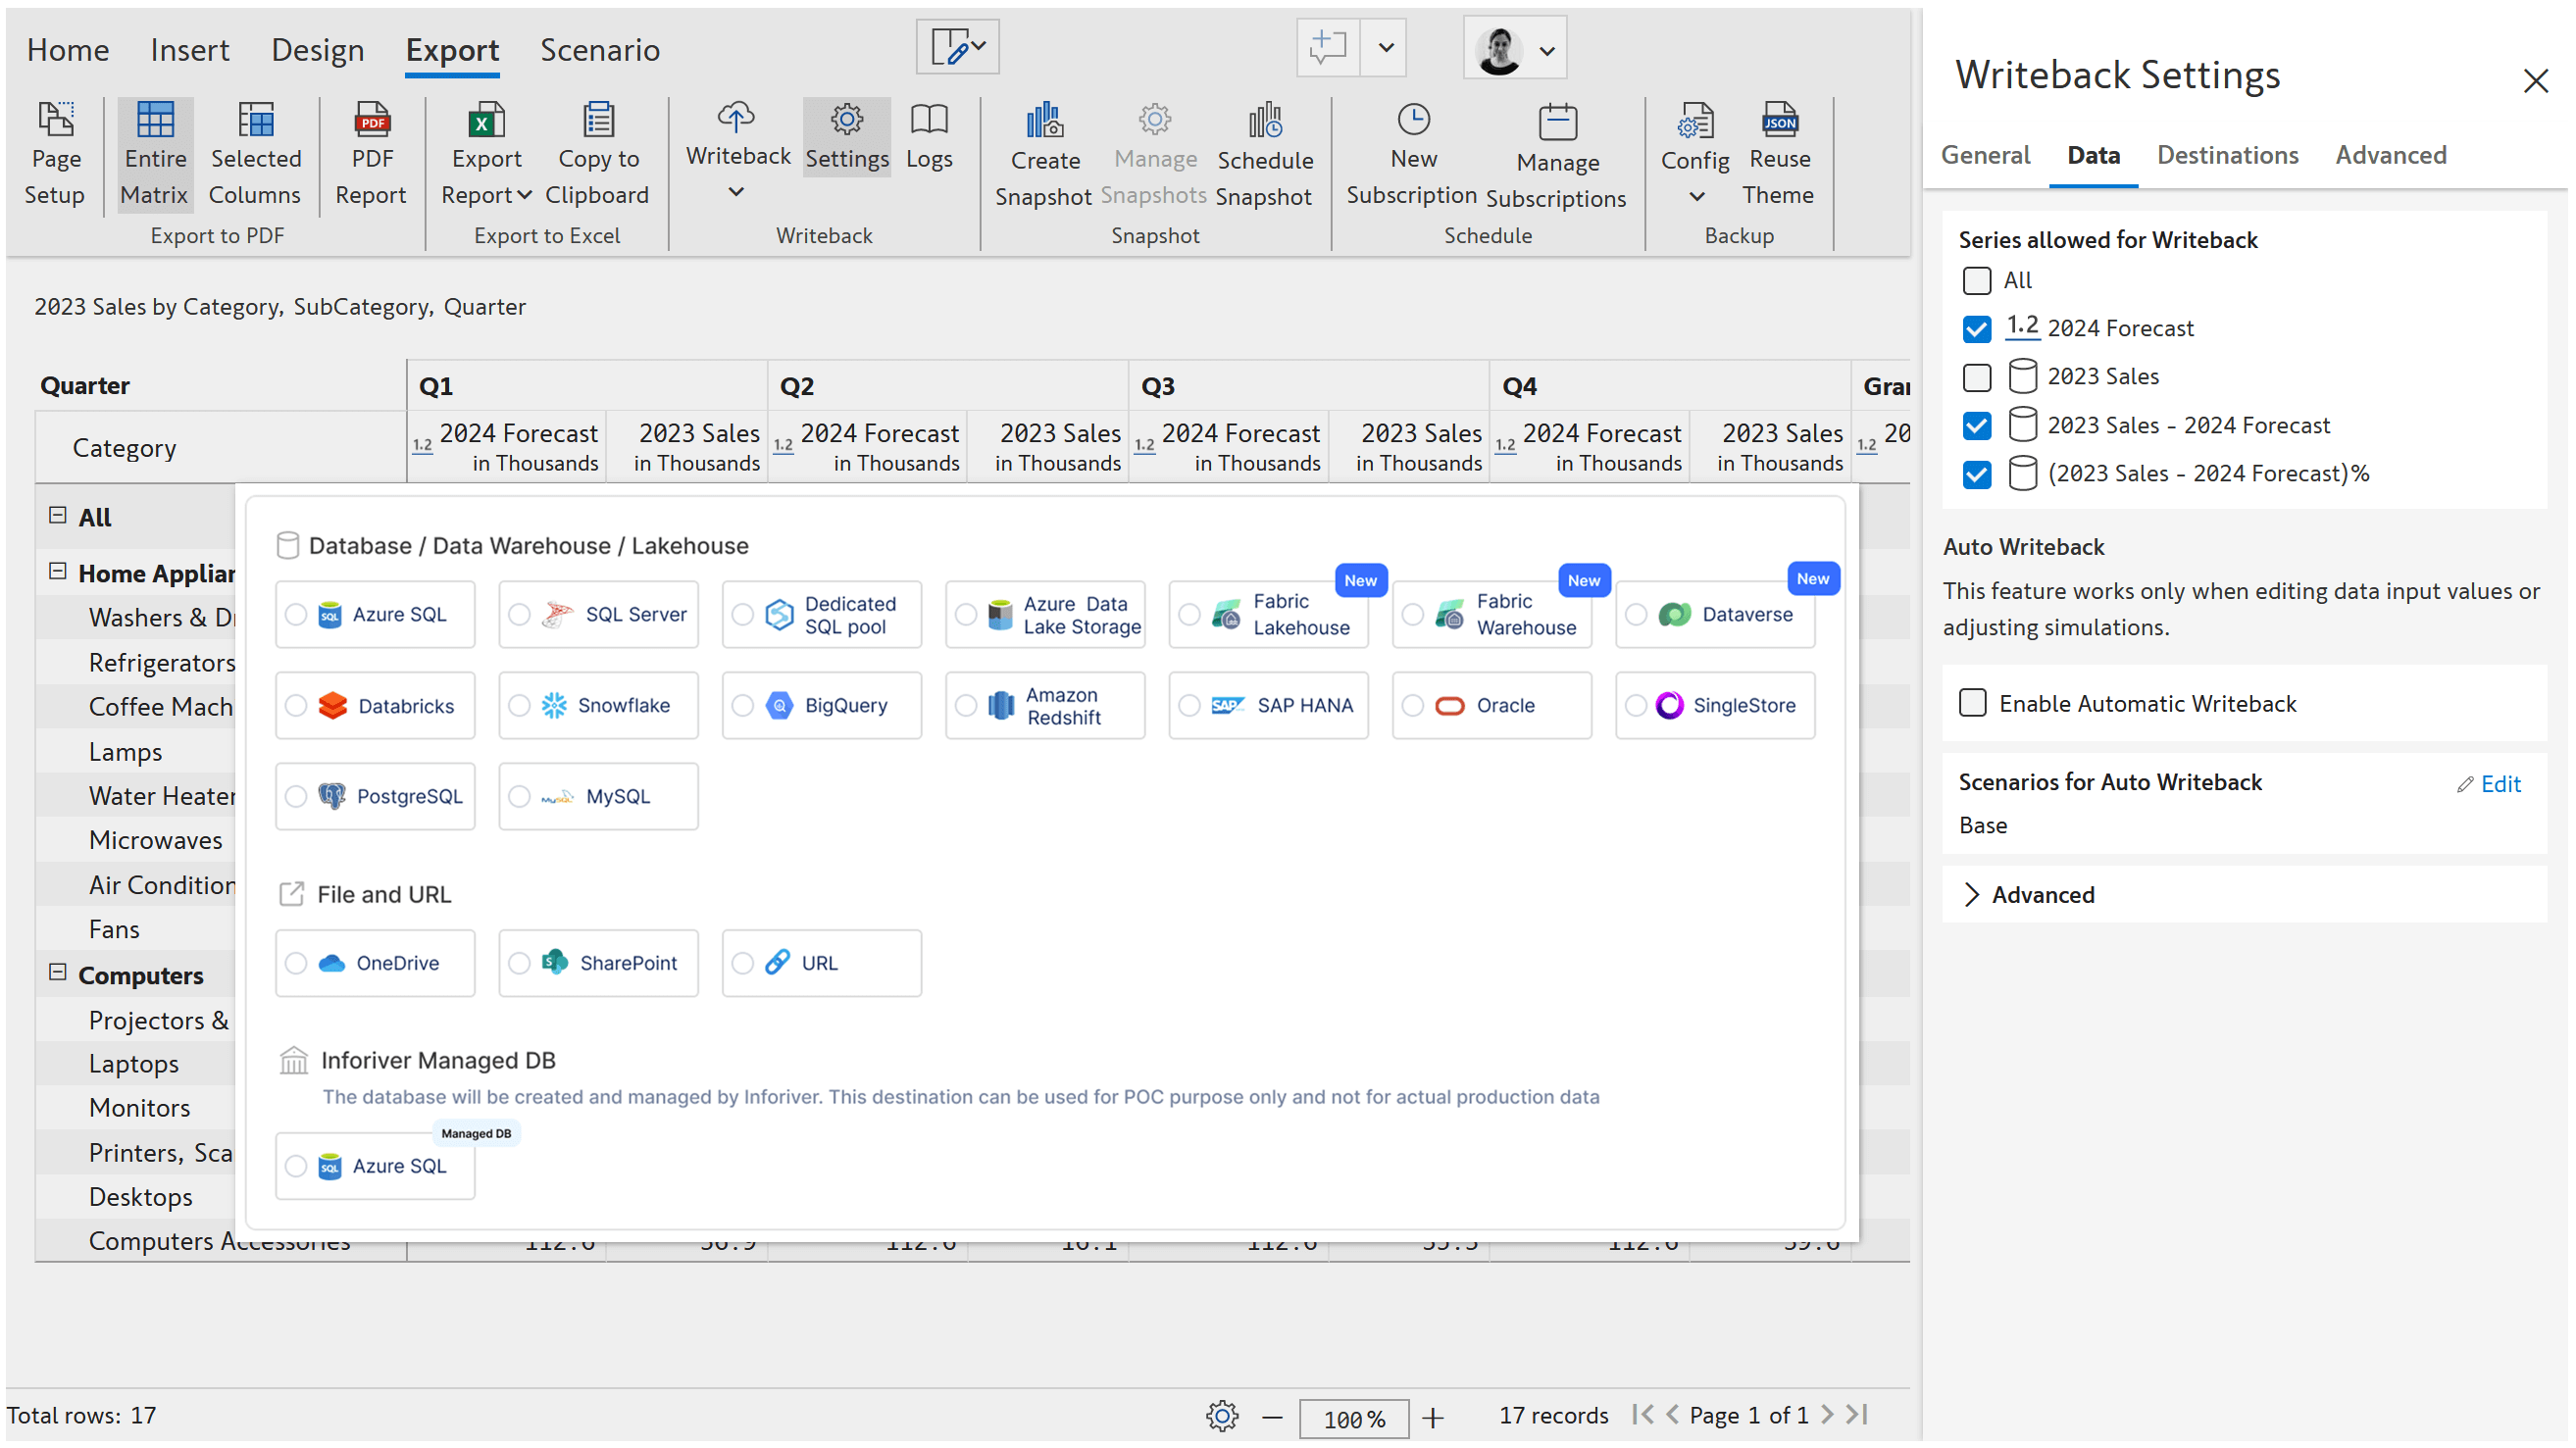
Inforiver allows you to write your forecasts, other custom fields, and comments to Microsoft Fabric OneLake/Lakehouse, Fabric Data Warehouse, Microsoft Dataverse, and several other destinations, as shown in the following image.


Inforiver helps enterprises consolidate planning, reporting & analytics on a single platform (Power BI). The no-code, self-service award-winning platform has been recognized as the industry’s best and is adopted by many Fortune 100 firms.
Inforiver is a product of Lumel, the #1 Power BI AppSource Partner. The firm serves over 3,000 customers worldwide through its portfolio of products offered under the brands Inforiver, EDITable, ValQ, and xViz.