
Upcoming webinar on 'Inforiver Charts : The fastest way to deliver stories in Power BI', Aug 29th , Monday, 10.30 AM CST. Register Now
Upcoming webinar on 'Inforiver Charts : The fastest way to deliver stories in Power BI', Aug 29th , Monday, 10.30 AM CST. Register Now
Today we are going to take a quick look at how to calculate Month over Month (MoM), Quarter over Quarter (QoQ) and Year over Year (YoY) growth in Power BI, just as easy as you can do in Excel.
We have a monthly P&L dataset in Excel starting Jan 2019 going all the way till Dec 2021, totaling 36 months in columns. The first few columns are shown here.
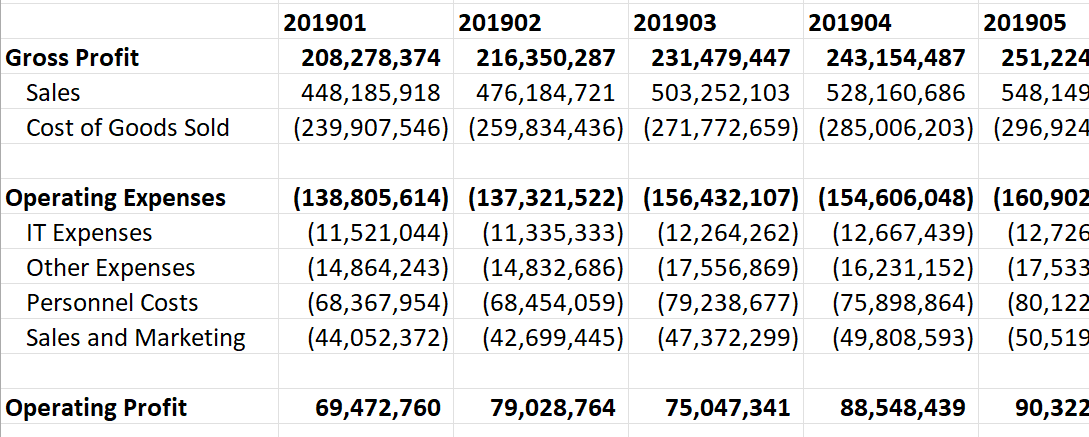
If we need to calculate MoM, QoQ and YoY growth in Excel, for each month, we start adding additional rows and type in the formulae. Here is one way to do it.
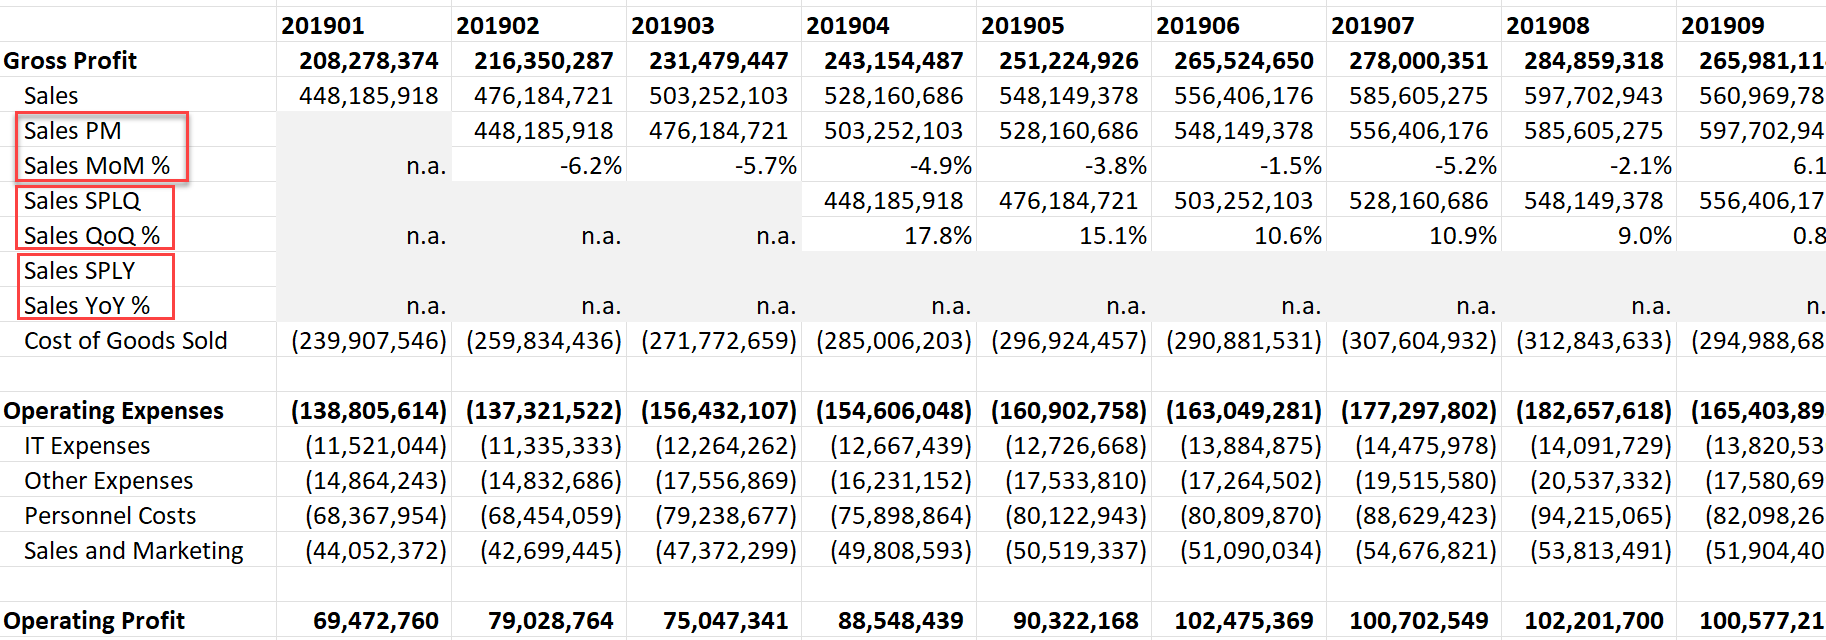
In essence, we have inserted 6 rows in the table:
Notice that the Sales PM, Sales SPLQ and Sales SPLY metrics just shift the original Sales record across time - respectively by 1, 3 and 12 months.
Let’s look at how we can do this in Power BI.
***
When we create a DAX measure for tracking YoY, QoQ and MoM changes, we run into some issues. To begin with, DAX measures are rendered as columns, and not as a row. The second issue is that the measure is calculated for all the financial accounts – not just Net Revenue.
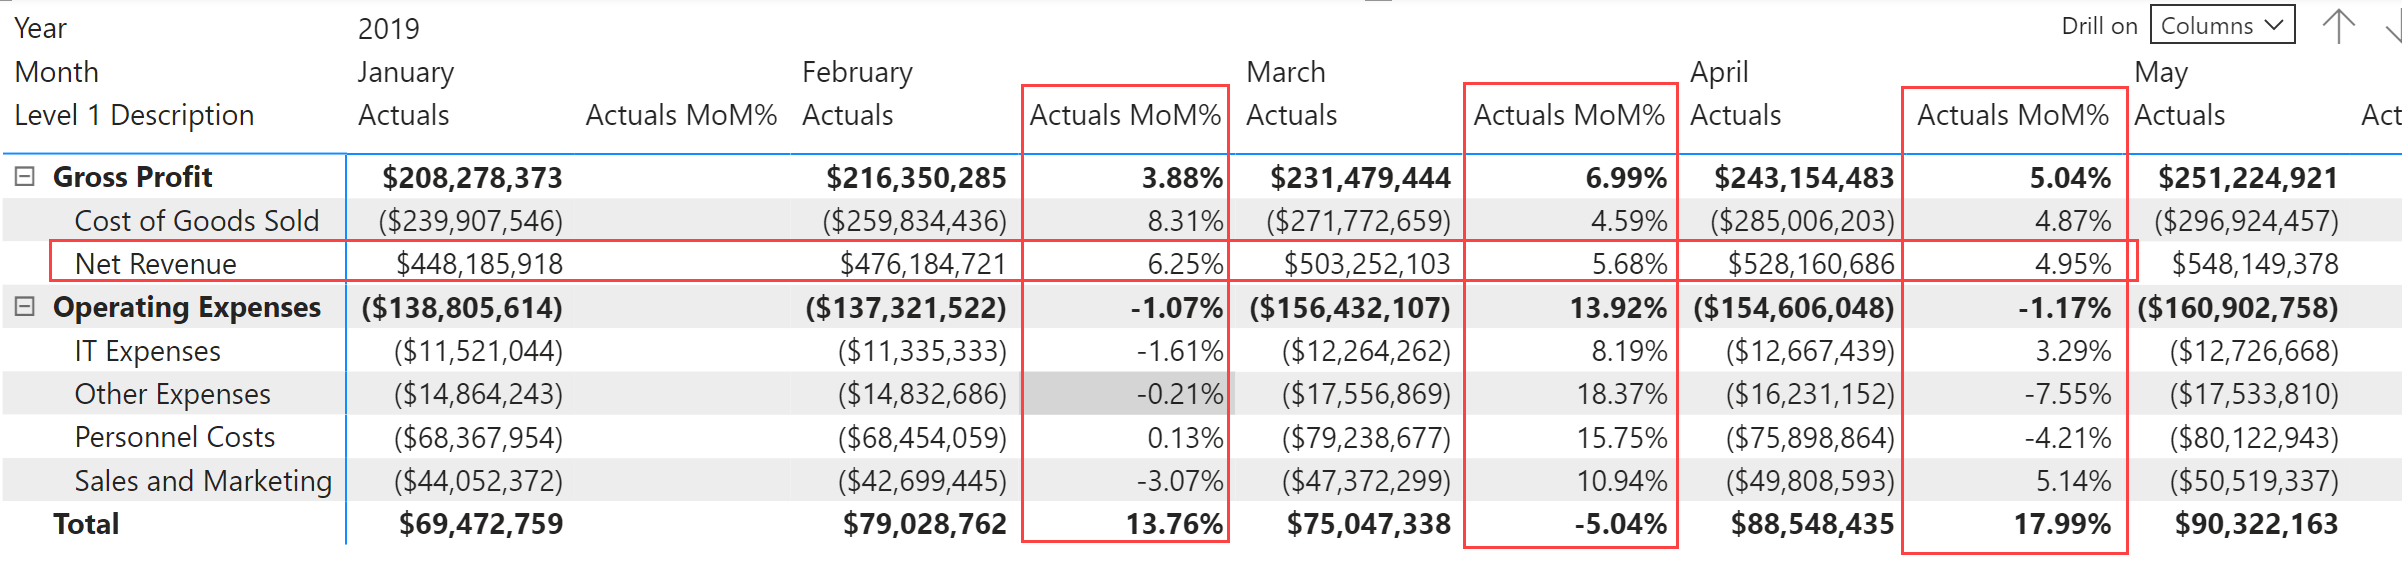
When you turn on the ‘Switch values to rows’ property of the matrix, things get worse as the records simply double. The GL account rows (e.g., Net Revenue, Cost of Goods Sold) become empty too, as the values shift to the measure groups beneath them.
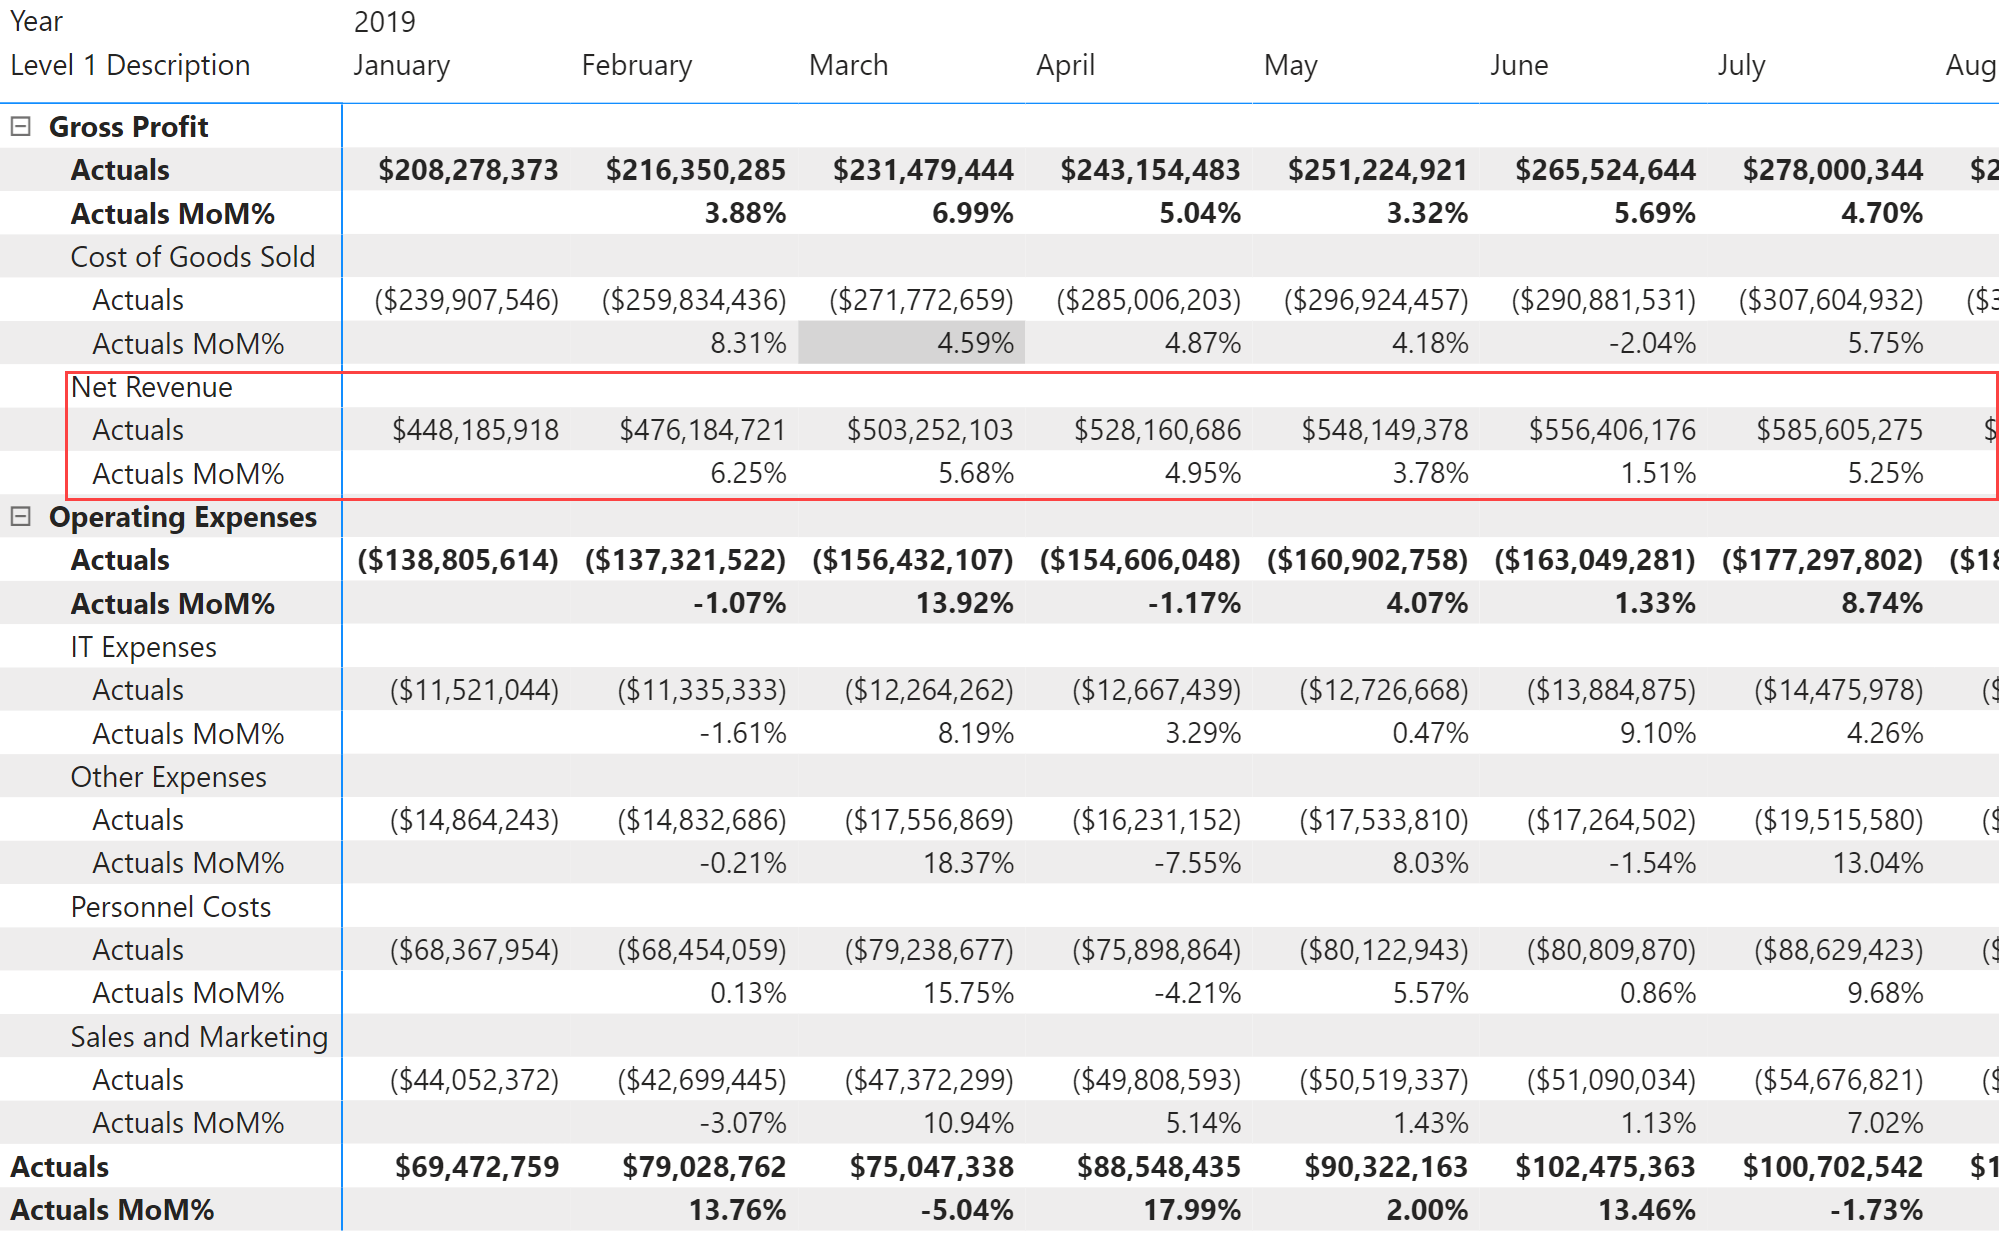
Unfortunately, neither of these formats will suit us.
With Inforiver, you can insert calculated rows like how you are used to doing in Excel.
Here we have the account statement recreated in Power BI using Inforiver. All values in the table are scaled to millions.
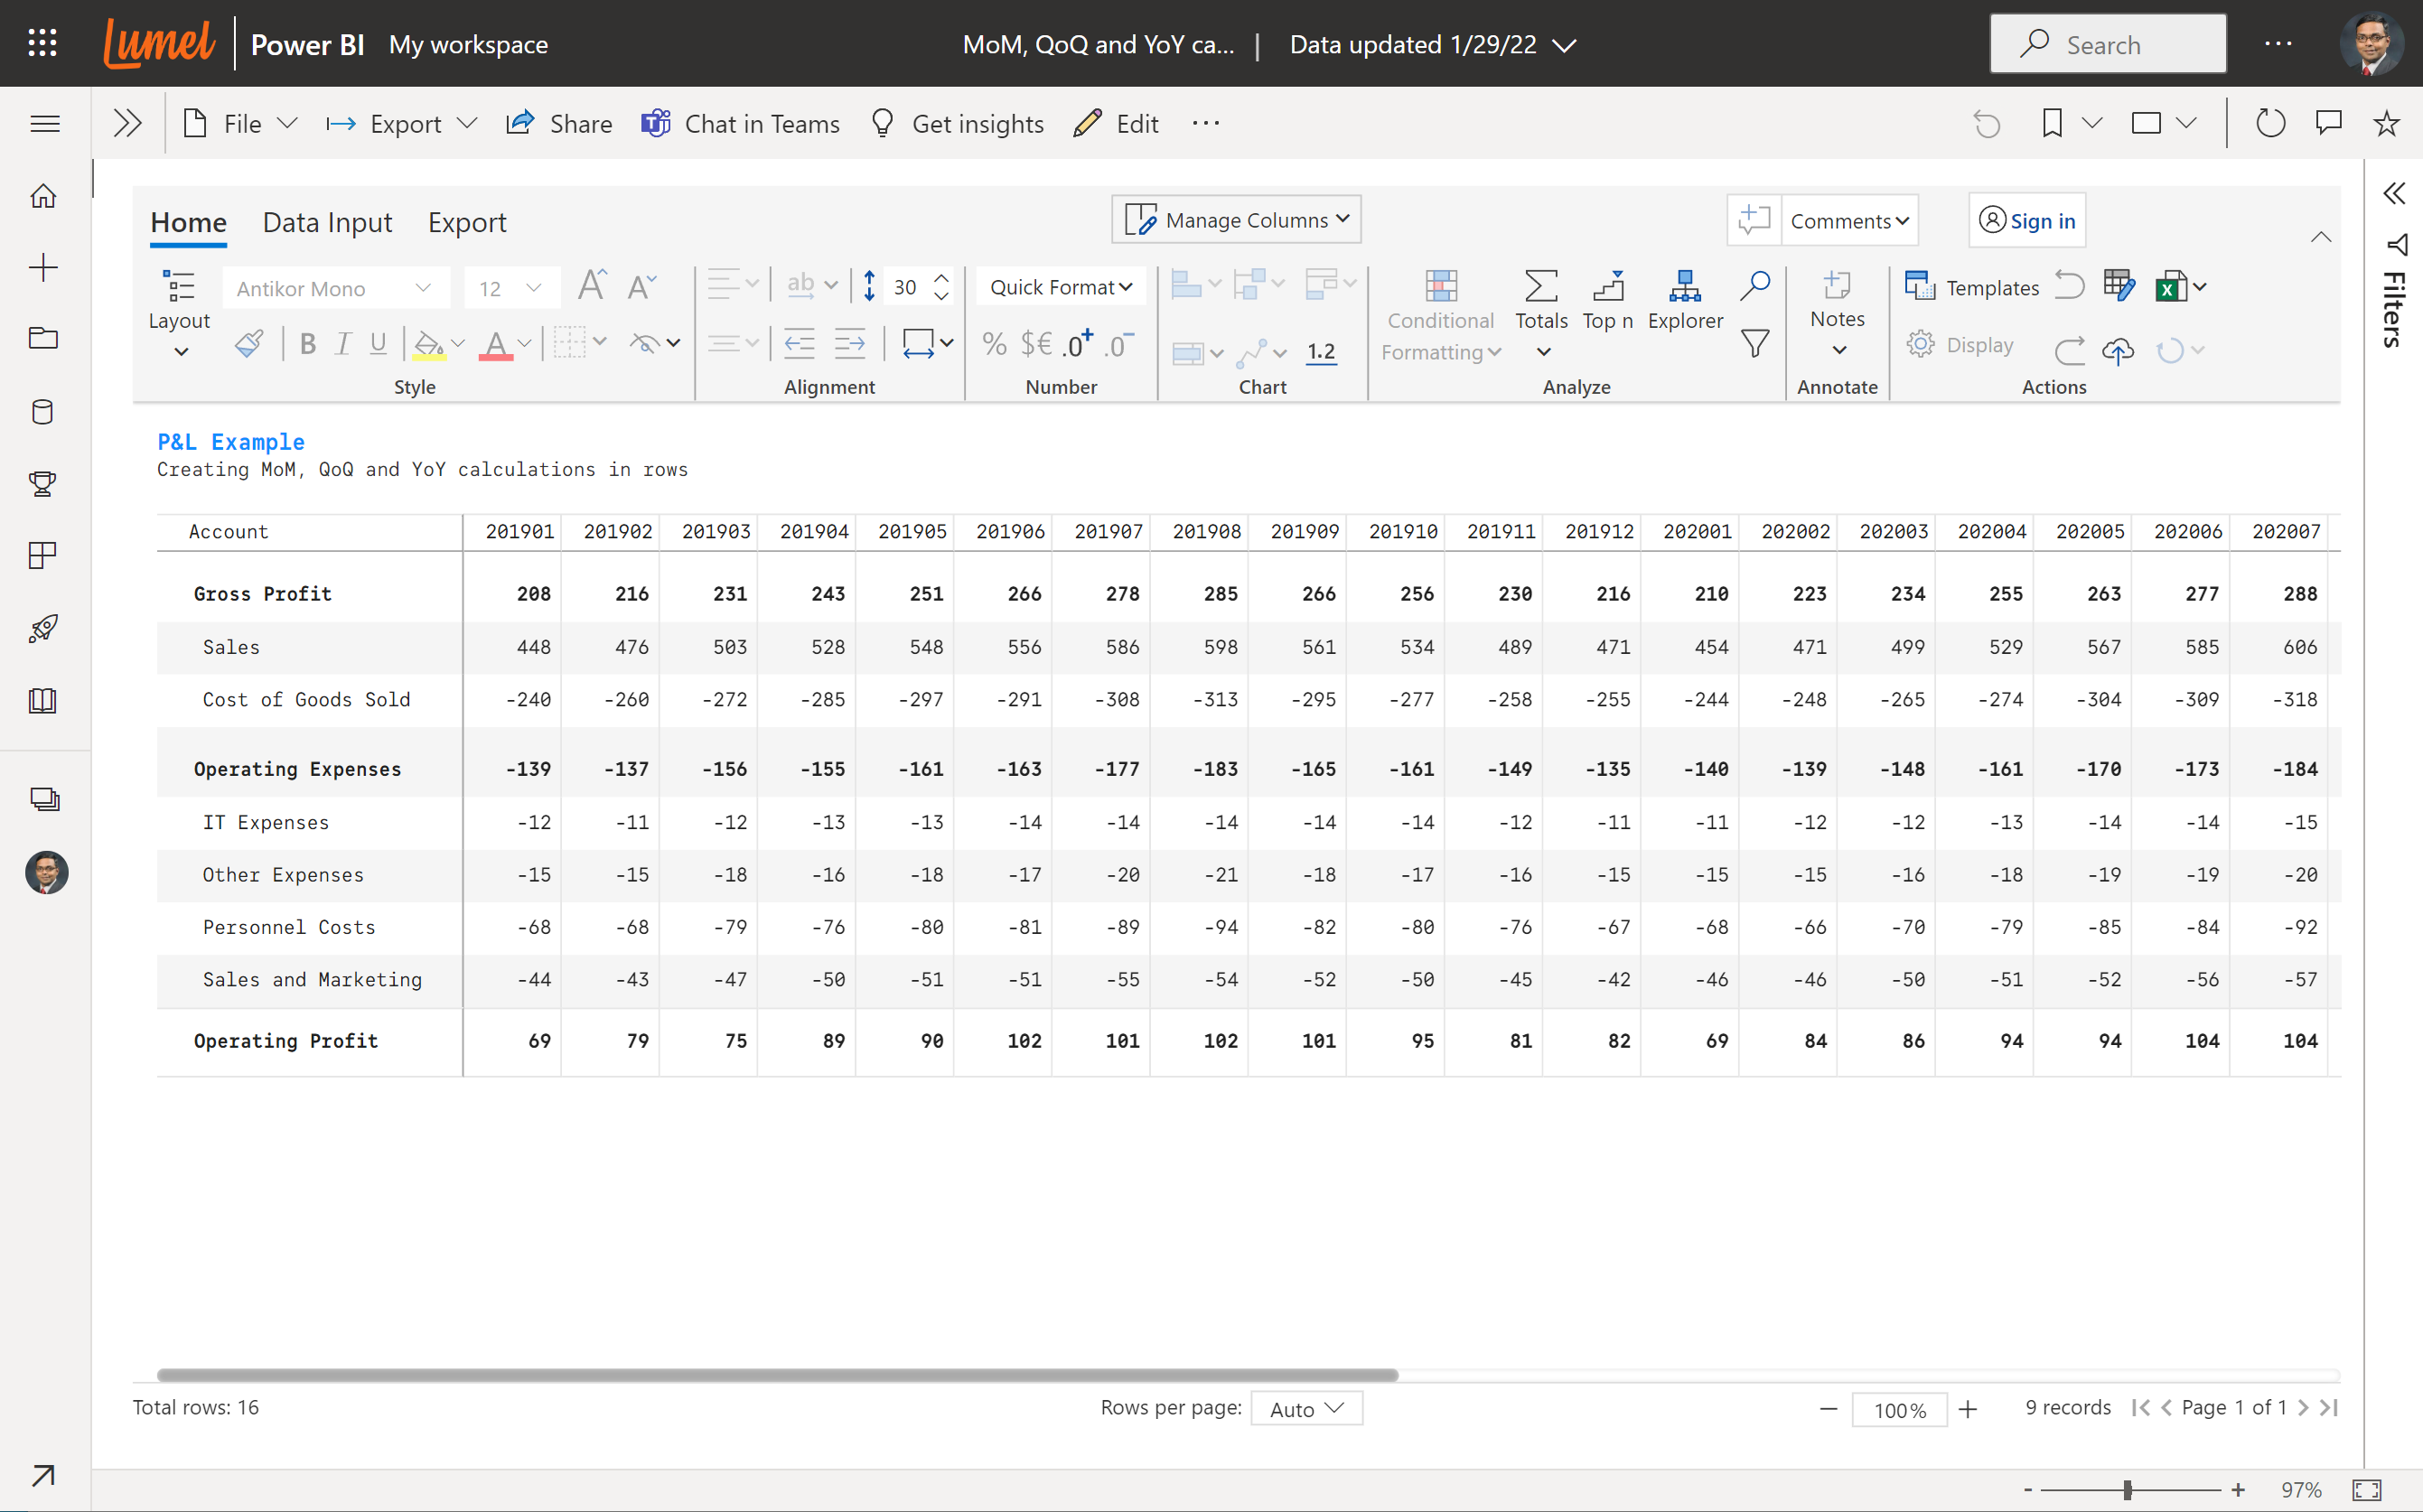
We’ll now explore how to insert MoM, QoQ and YoY calculations in additional rows.
To do this, we leverage Inforiver’s powerful formula engine which you can use to insert rows and columns. In the walkthrough below, we will restrict our focus to the formulae used after you have inserted each row.
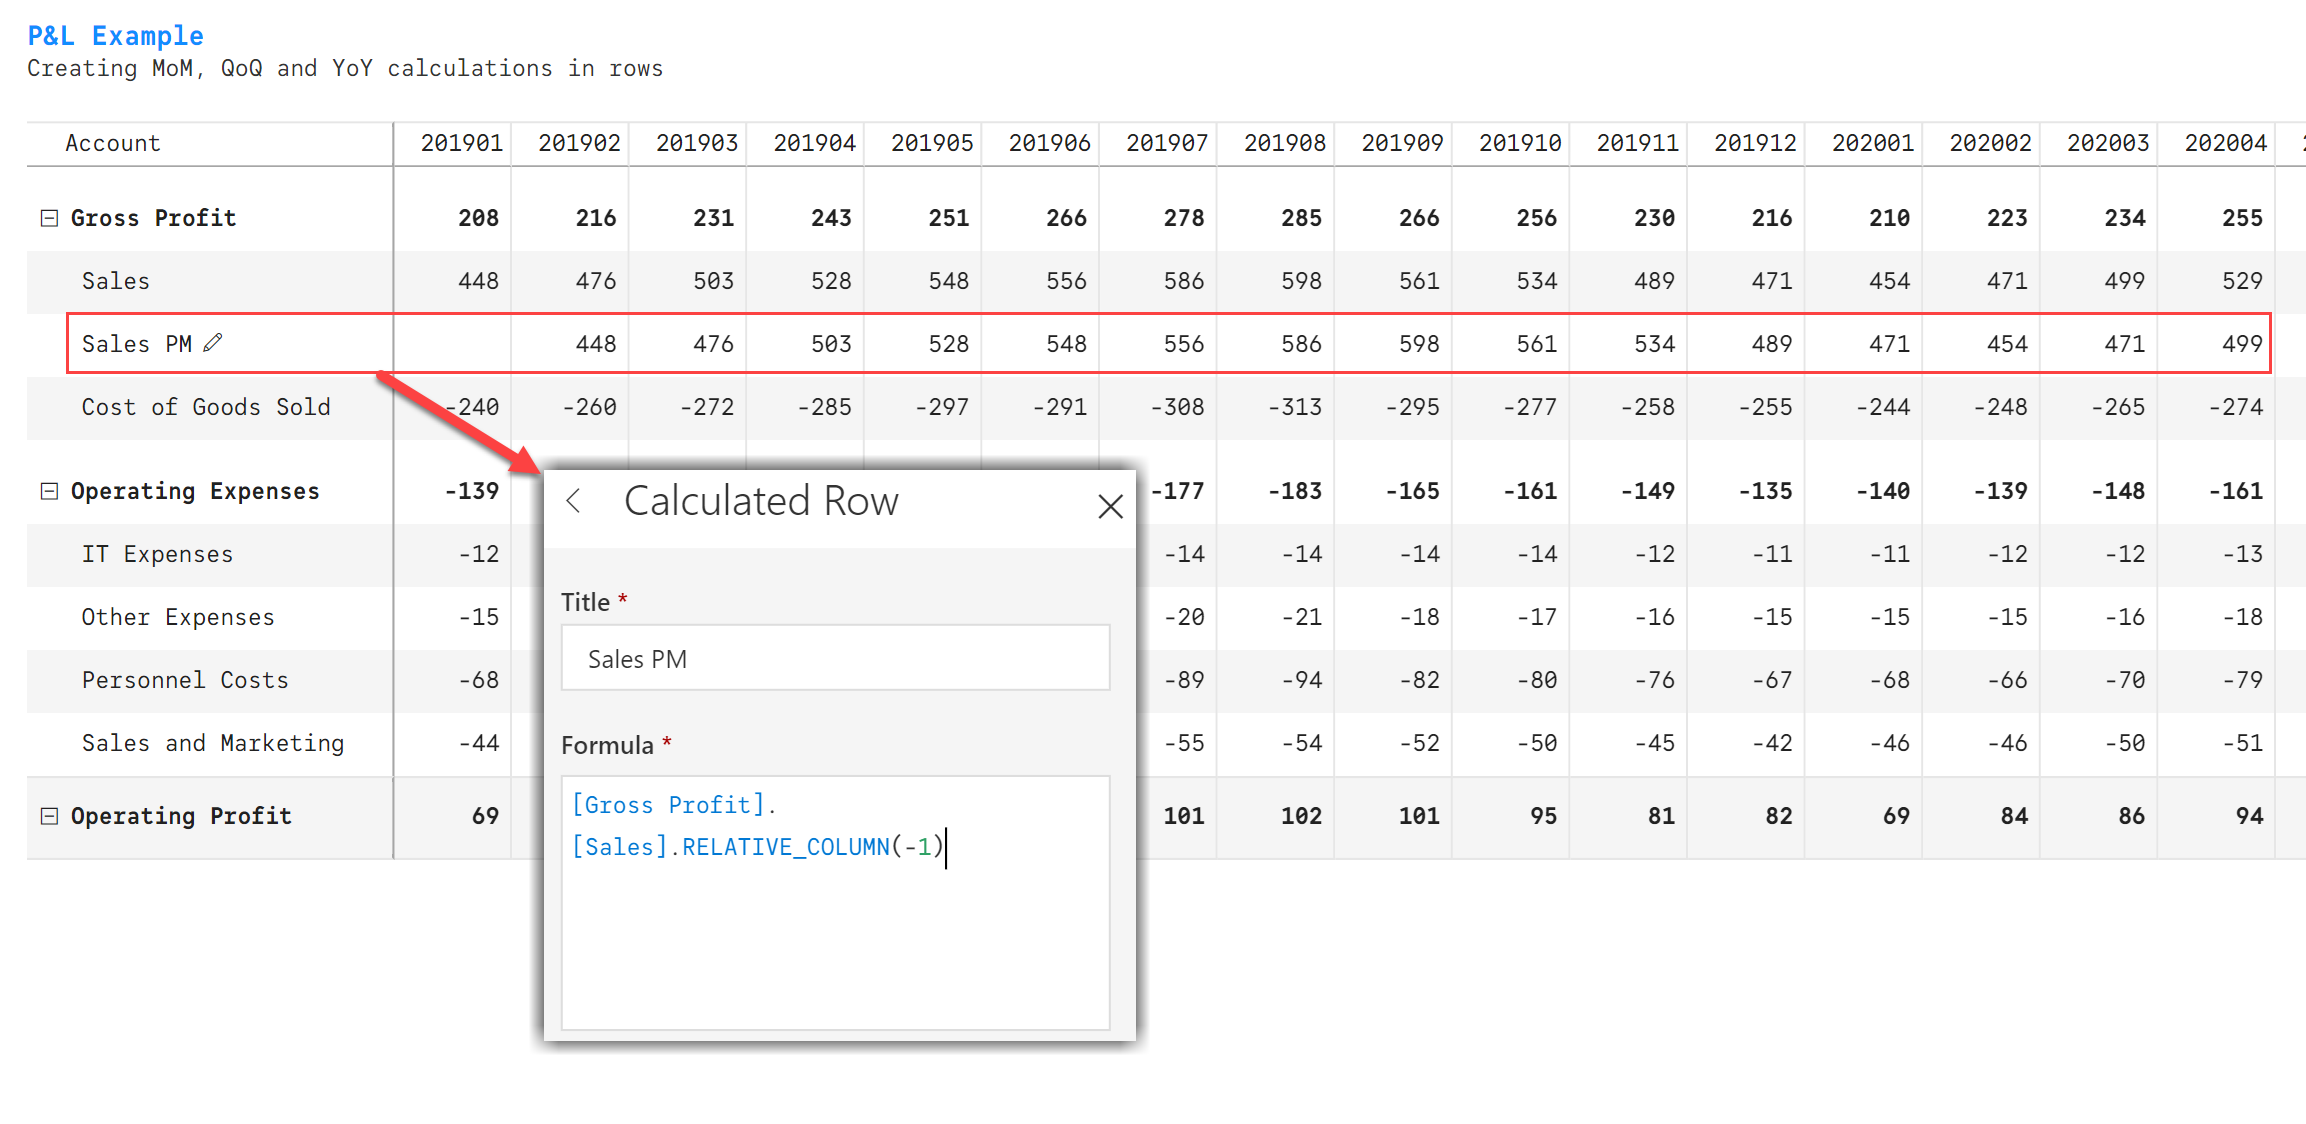
To compute Sales Prior Month (Sales PM), we need to shift Sales record by a month to the right. This is accomplished by using the function RELATIVE_COLUMN(), to which we pass the offset amount of -1, signifying the position of the prior period relative to the current period.
Check out the formula below.
The [Gross Profit].[Sales] indicates that the Sales account is part of the Gross Profit hierarchy.
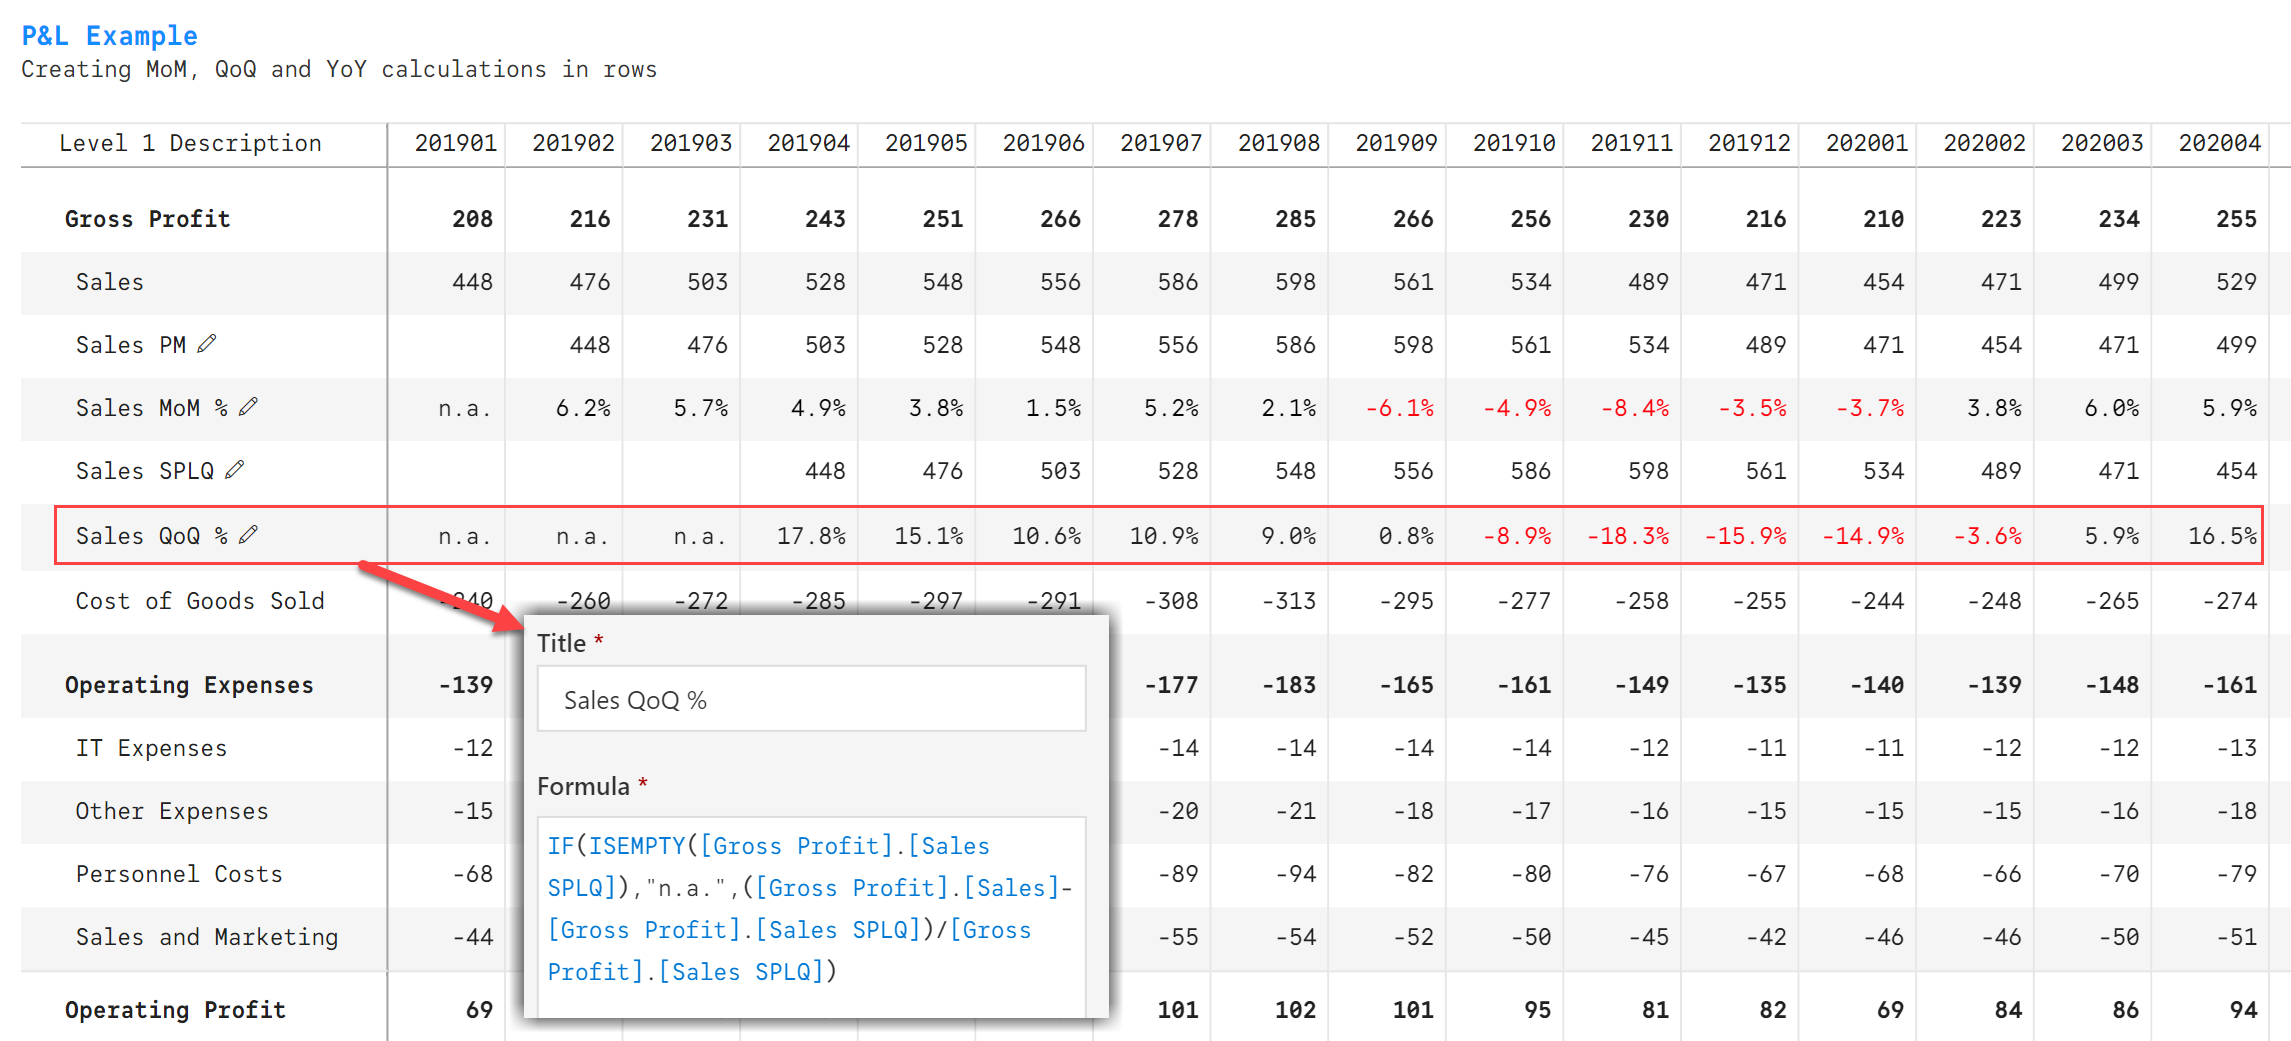
Once we calculate the above, the MoM % change can be calculated as follows. You can format the negative values in red by using the formatting options in the toolbar.
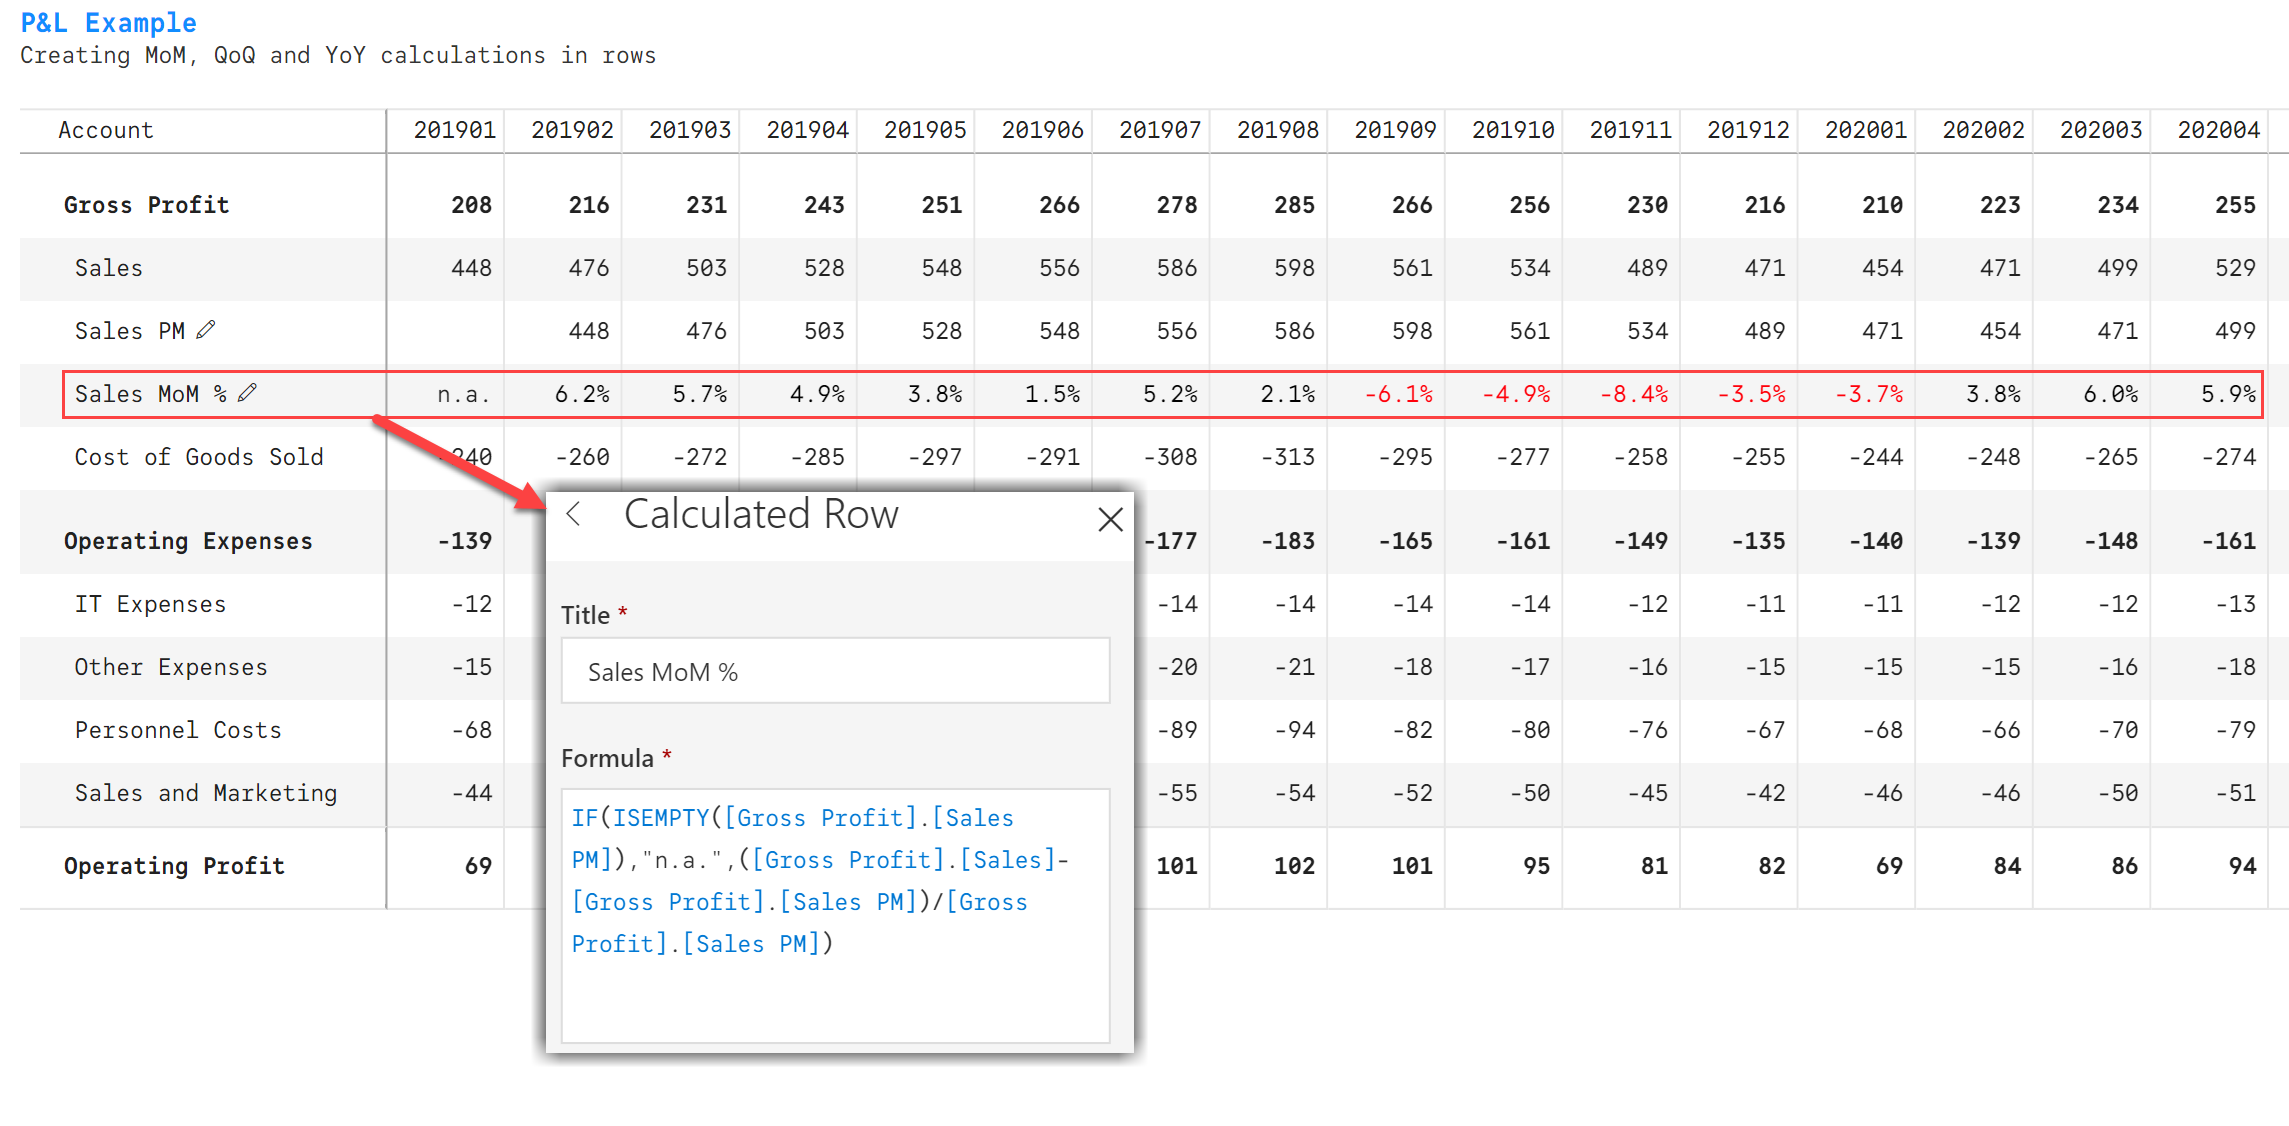
Note that the IF condition is used to ensure that the Jan 2019 value does not throw an error due to division by Sales PM when it is empty.
Calculating Quarter over Quarter sales is very similar, except that we need to shift time period by three (3) months. You can observe that the Jan sales value of 448 is now populated in April.
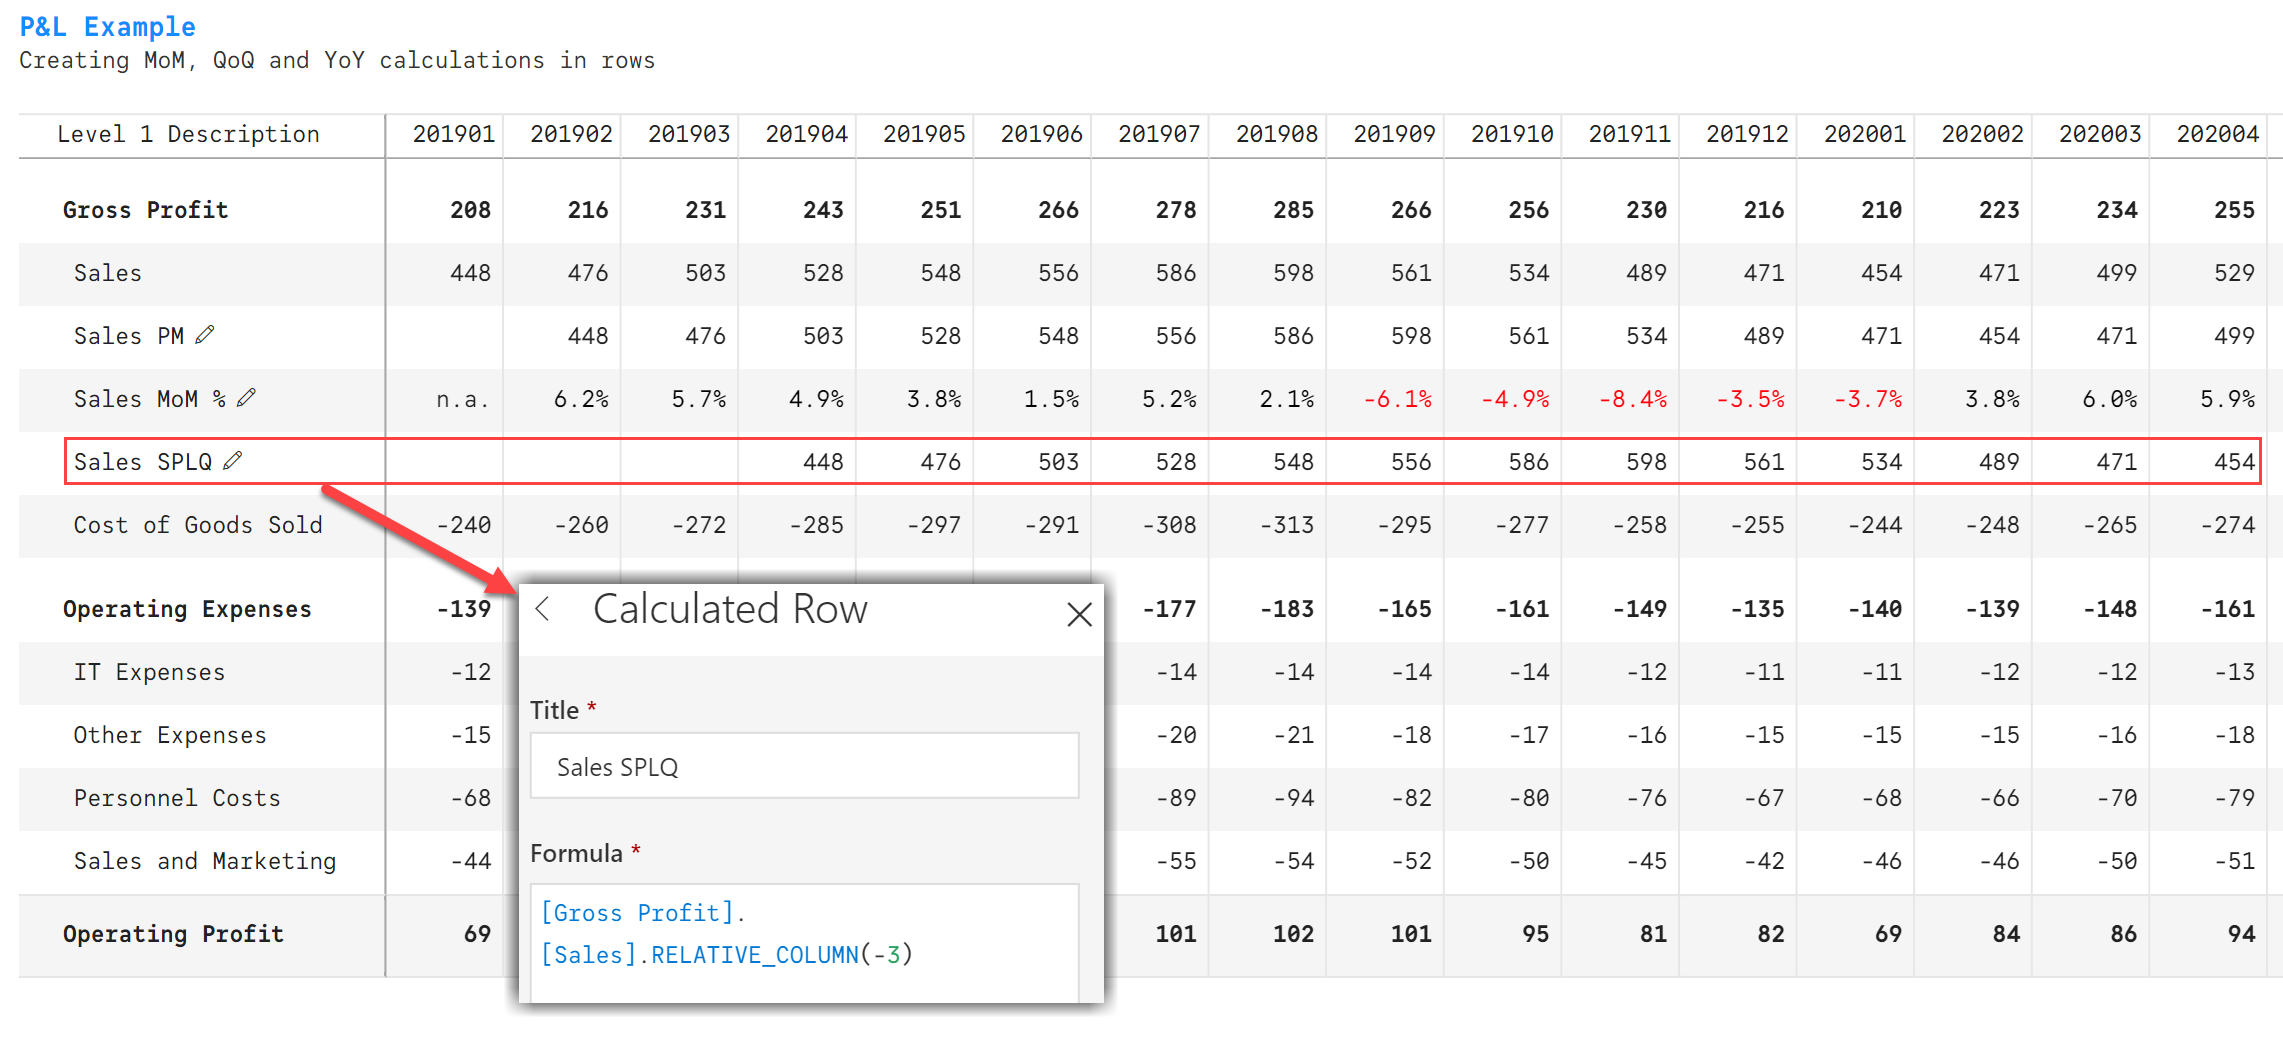
The QoQ % can be calculated easily now.
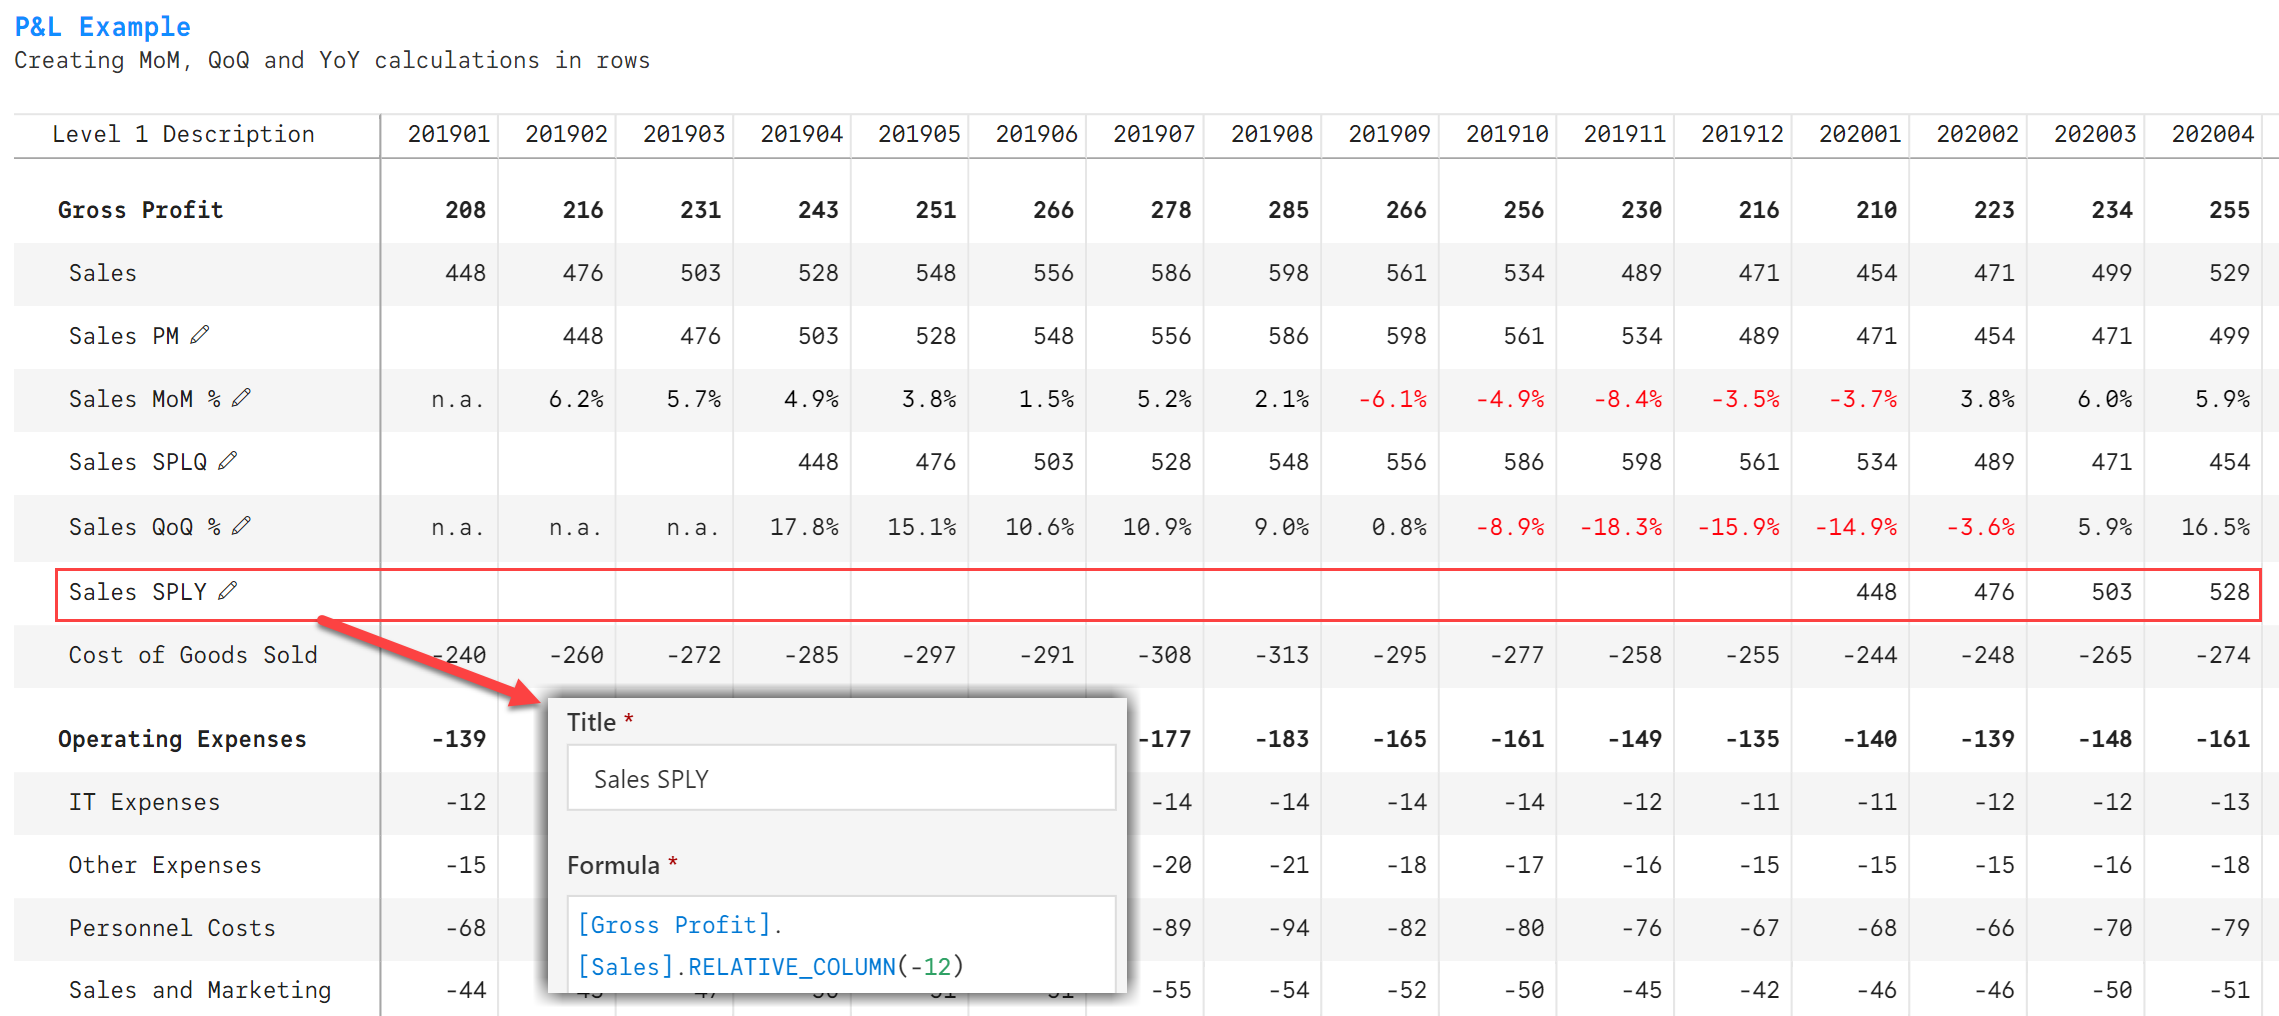
For YoY calculations, we first shift the time period by 12 months into the past. You can notice that the Jan 2019 sales value is now listed against Jan 2020 sales in the Sales SPLY row.
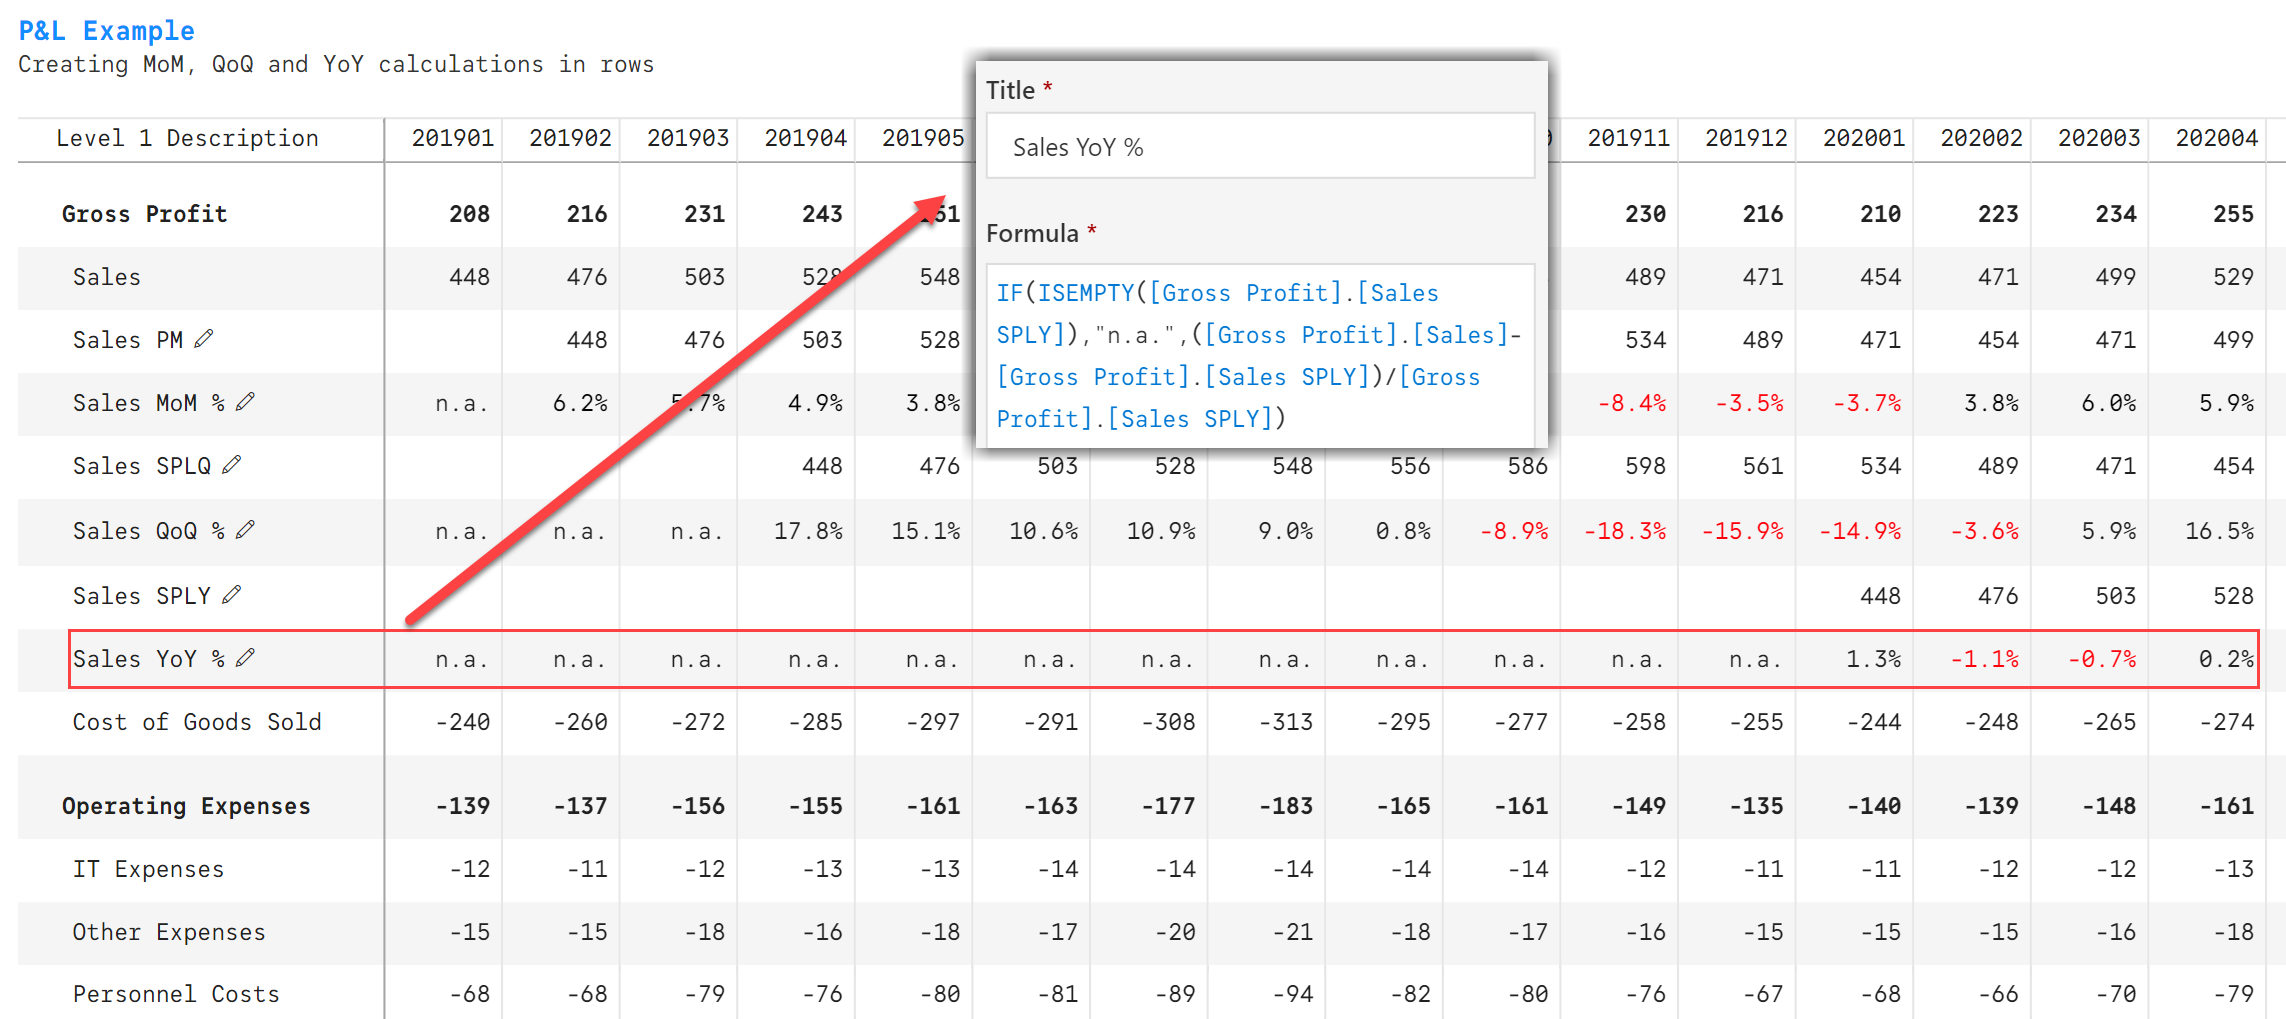
The YoY Sales growth in percentage can be now calculated easily.
***
In case you want only the YoY, QoQ and MoM rows, you can just hide Sales PM, Sales SPLQ and Sales SPLY rows as you do with Excel.
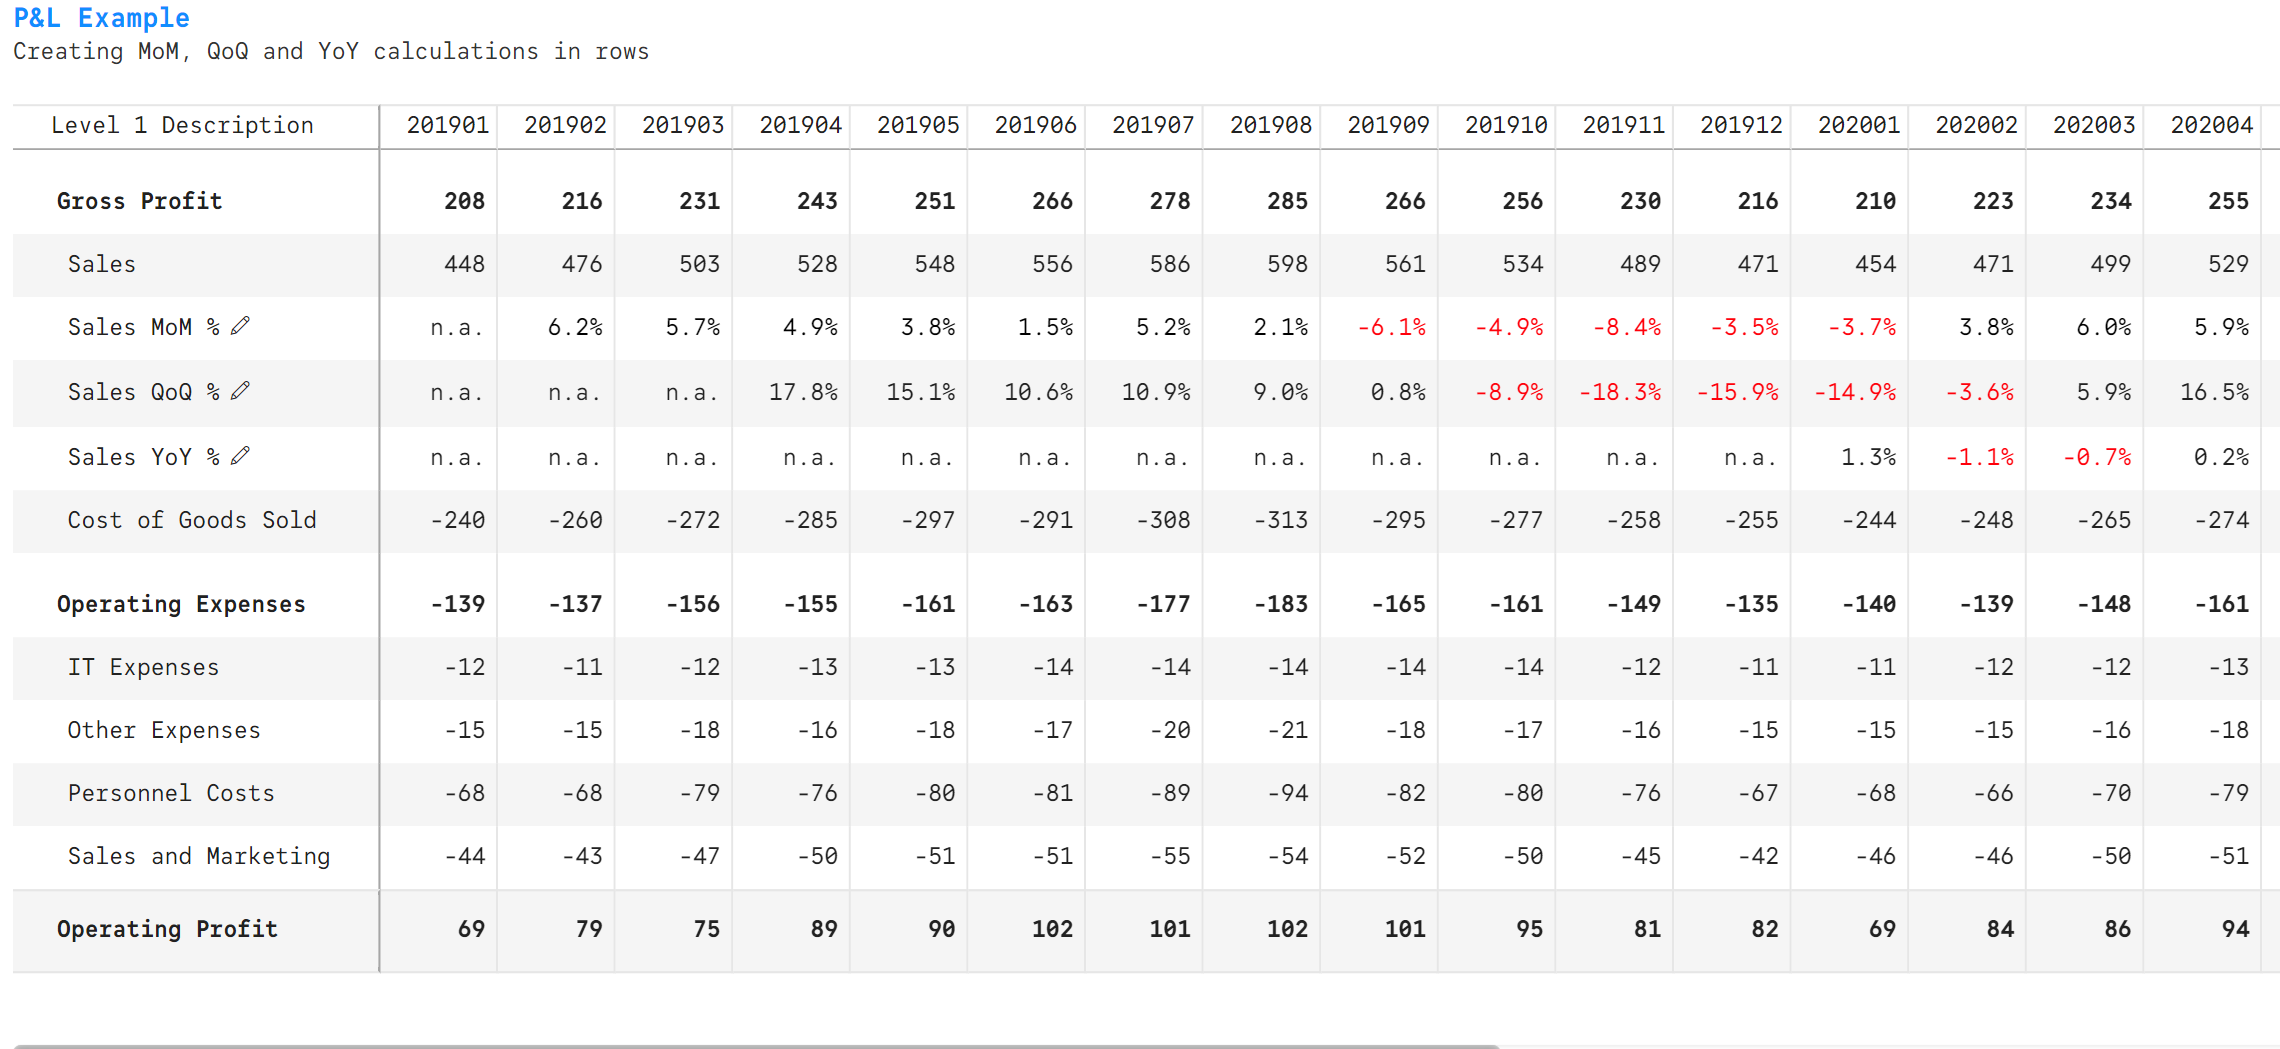
You can even minimize the emphasis and reformat the report.

***
Overall, the ability to perform time shifting calculations in rows opens big possibilities in Power BI, especially for Excel fans. Check out the Twenty (20) Excel features that Inforiver delivers in Power BI.
Inforiver Matrix can be purchased directly from Microsoft AppSource.
Learn more about visual calculations in Inforiver here.

Inforiver helps enterprises consolidate planning, reporting & analytics on a single platform (Power BI). The no-code, self-service award-winning platform has been recognized as the industry’s best and is adopted by many Fortune 100 firms.
Inforiver is a product of Lumel, the #1 Power BI AppSource Partner. The firm serves over 3,000 customers worldwide through its portfolio of products offered under the brands Inforiver, EDITable, ValQ, and xViz.


