
Upcoming webinar on 'Inforiver Charts : The fastest way to deliver stories in Power BI', Aug 29th , Monday, 10.30 AM CST. Register Now
Upcoming webinar on 'Inforiver Charts : The fastest way to deliver stories in Power BI', Aug 29th , Monday, 10.30 AM CST. Register Now
Power BI currently has a limitation in dynamically updating column header names based on a filter. For example, I prefer to show values for a specific year (say, 2020), where the column name shows 2020 Sales. When I change the year filter to 2019, the column name must show 2019 Sales.
There are several traditional methods to change column headers dynamically in Power BI, such as the following:
This can be done easily in Inforiver Matrix for Power BI. Let us take the example where we have sales amounts by product category for 3 years. We would like to display the year selected in the slicer in the column header. This will require the following steps:
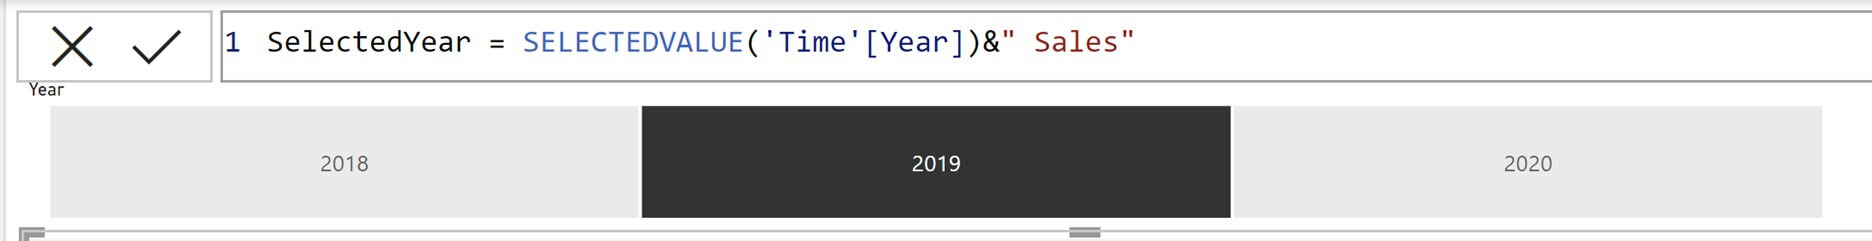
1. Create a DAX measure using the SELECTEDVALUE function to display the selected value of the slicer/filter. You can also append a text to the time period (if required) as shown below.
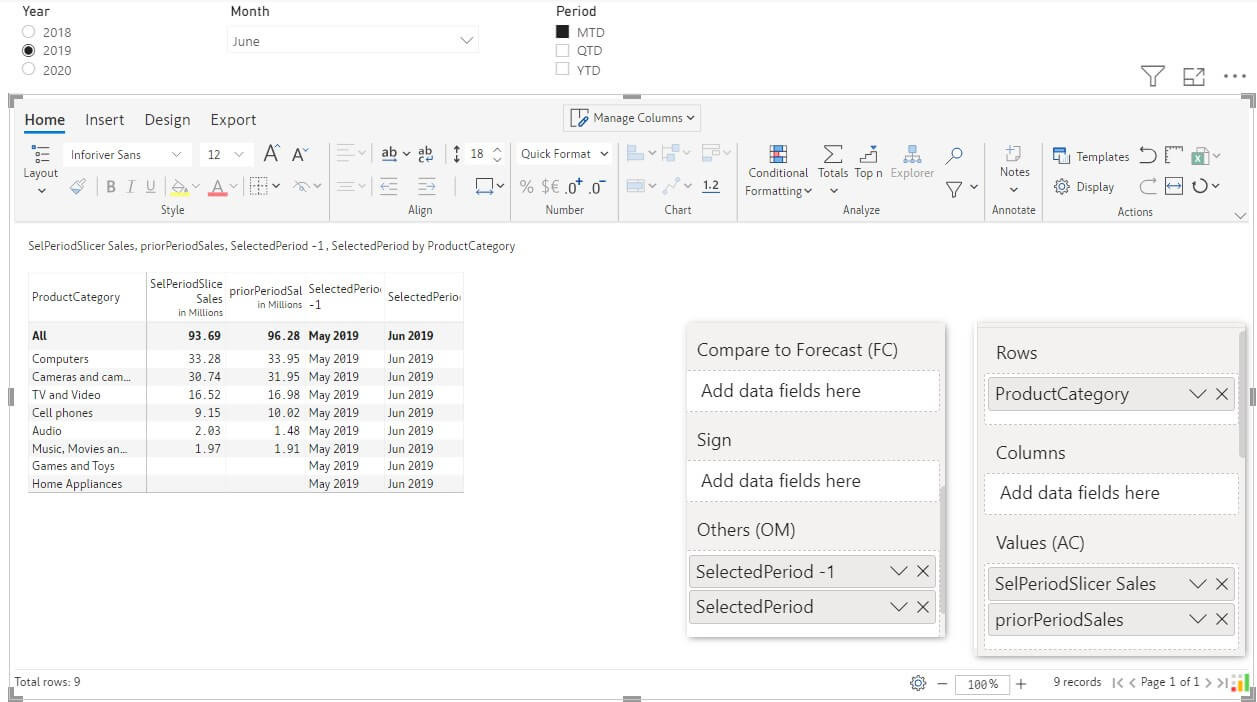
2. Add the required fields (ProductCategory and SalesAmount) to the Inforiver Matrix visual and add the DAX measure to the “Others (OM)” field. The data mapping is shown in the below image.
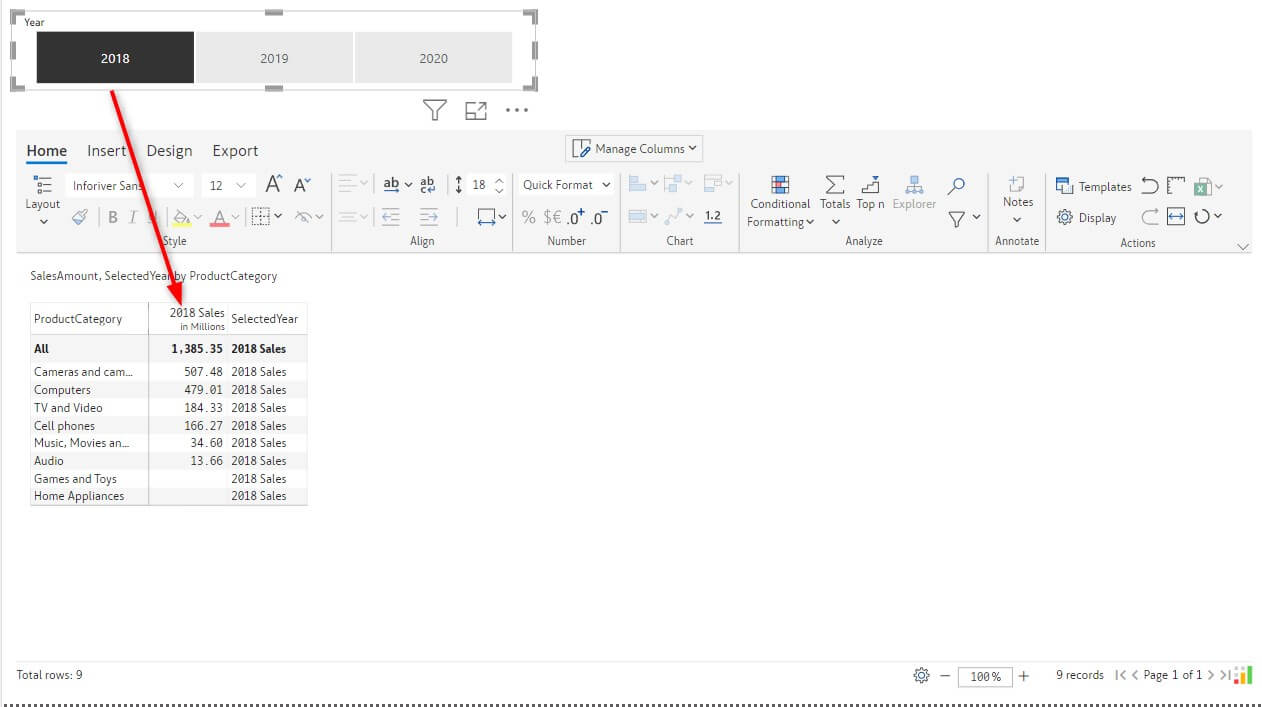
3. Double -click on the measure header name and reference the Grand Row Total cell of the SelectedYear(DAX Measure) to change the column name dynamically.
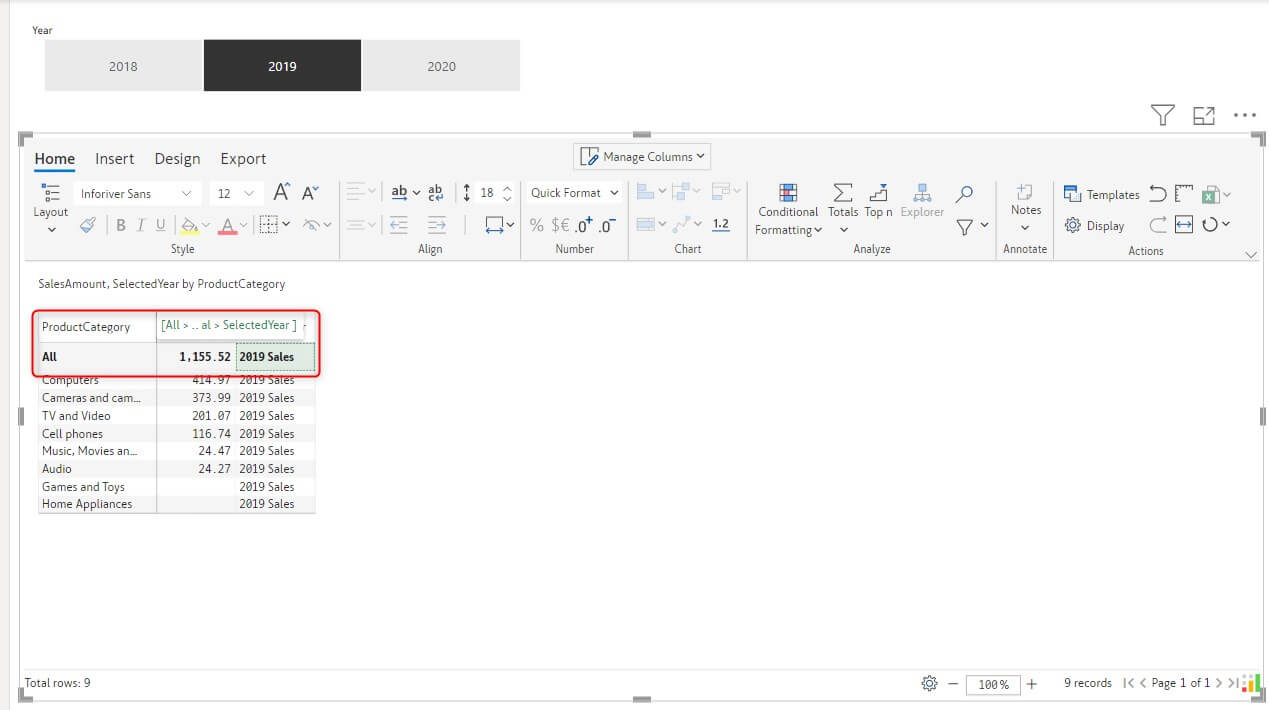
On changing the year, the column name will change dynamically as well:
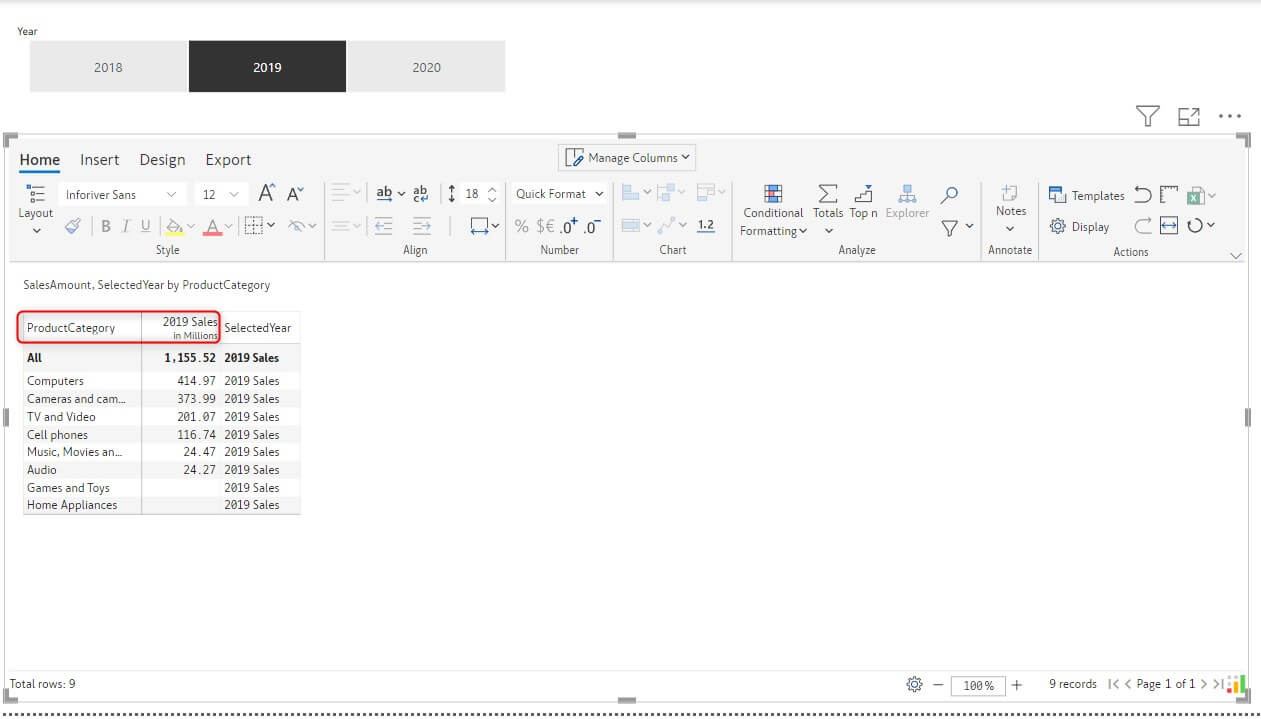
4. Using the Manage Columns in the center of the Inforiver Toolbar, hide the SelectedYear Column.
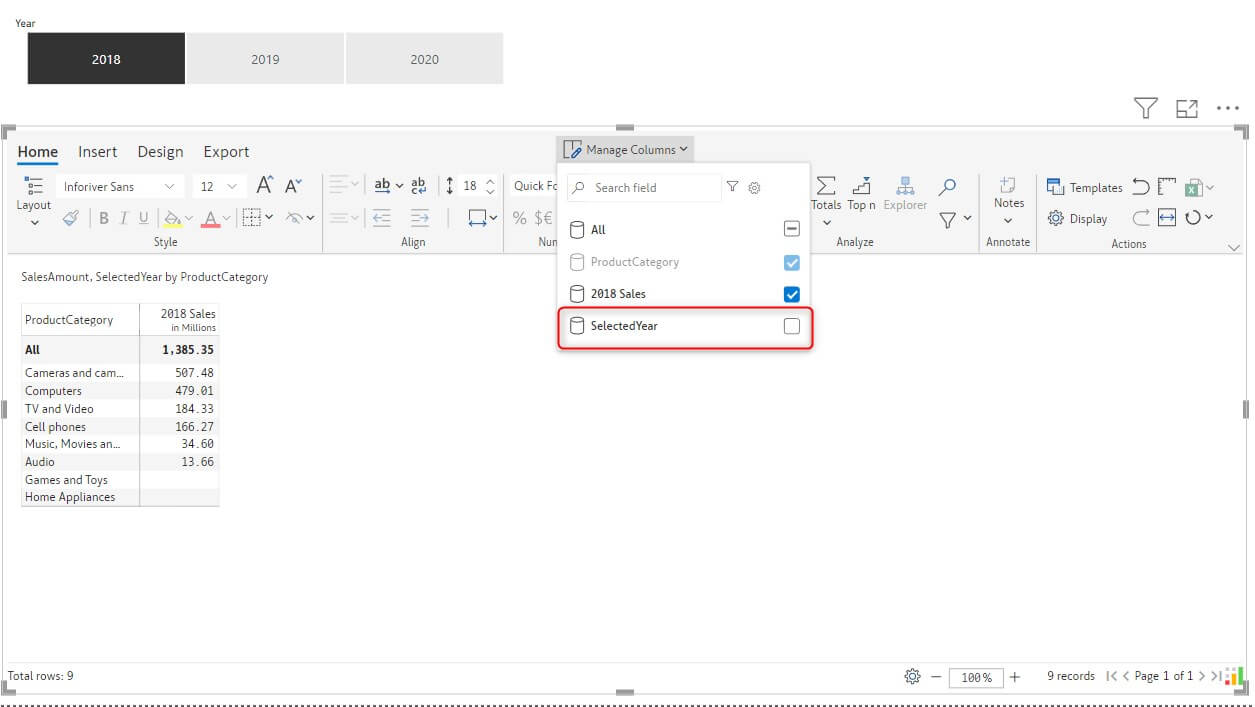
You have now created a table with dynamic column header based on a measure filter.
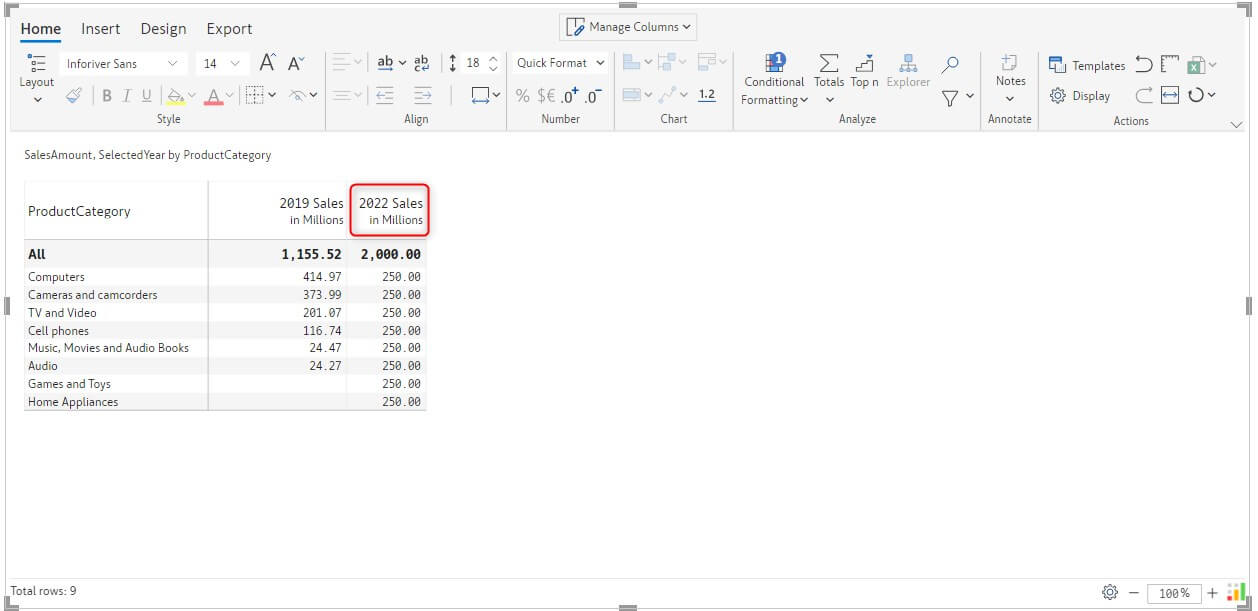
You can also use the time functions provided by Inforiver to change the column name dynamically according to the current period.
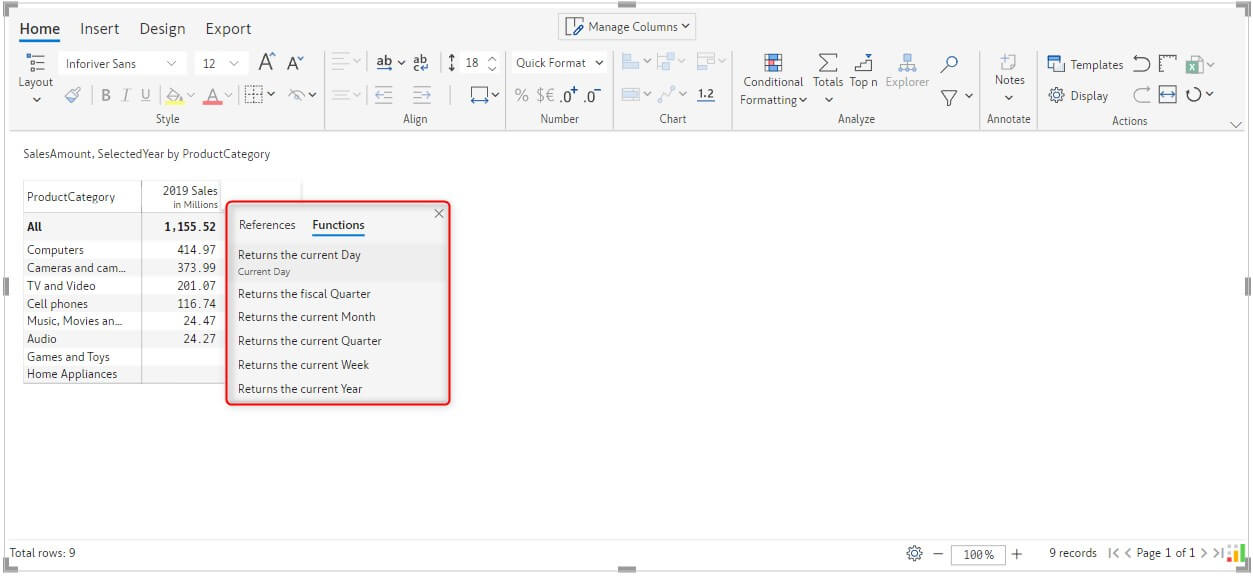
The functions can be used to show previous period or next period as well:

Complex scenarios can also be achieved in Inforiver using a bit of DAX. Let’s look at another scenario where we have year and month filters. We also have another filter which the user uses to indicate whether the report must show MTD/QTD/YTD values based on the month & year. Based on the selections, we want to display the selected period and prior period in the header.
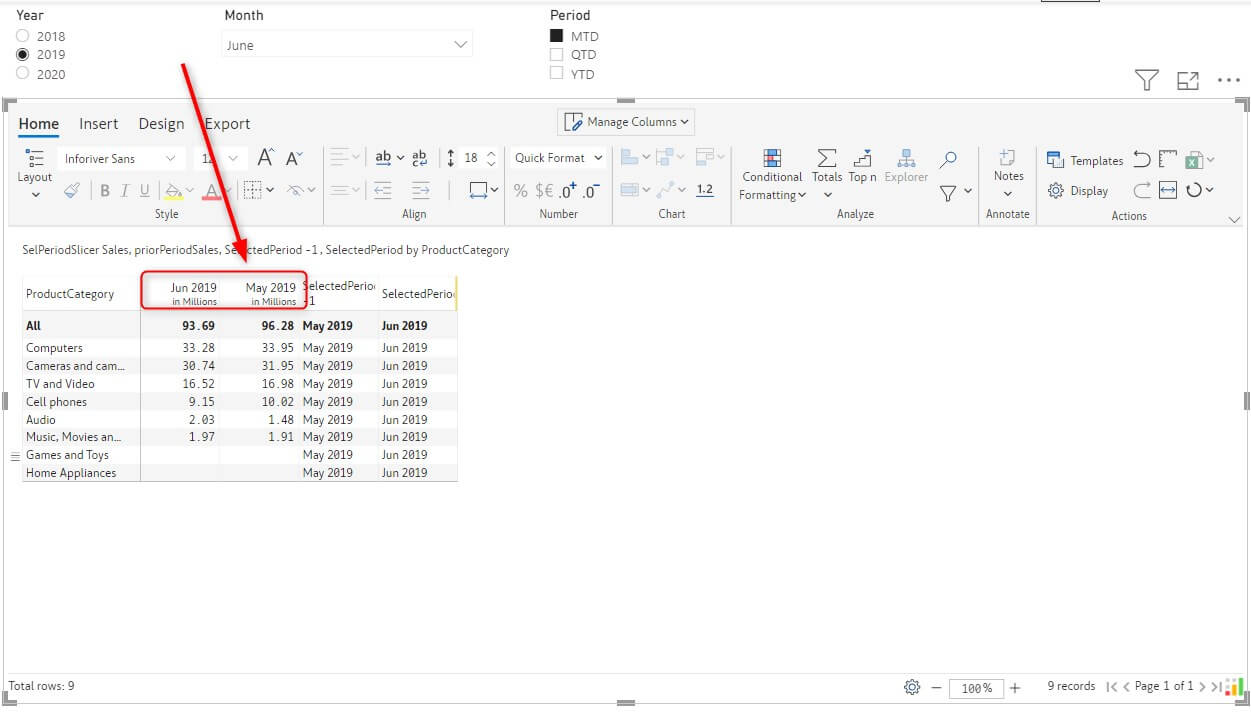
We need to use four DAX measures to achieve this scenario – 2 measures for the current period sales and prior period sales and 2 measures for the selected period and prior period.
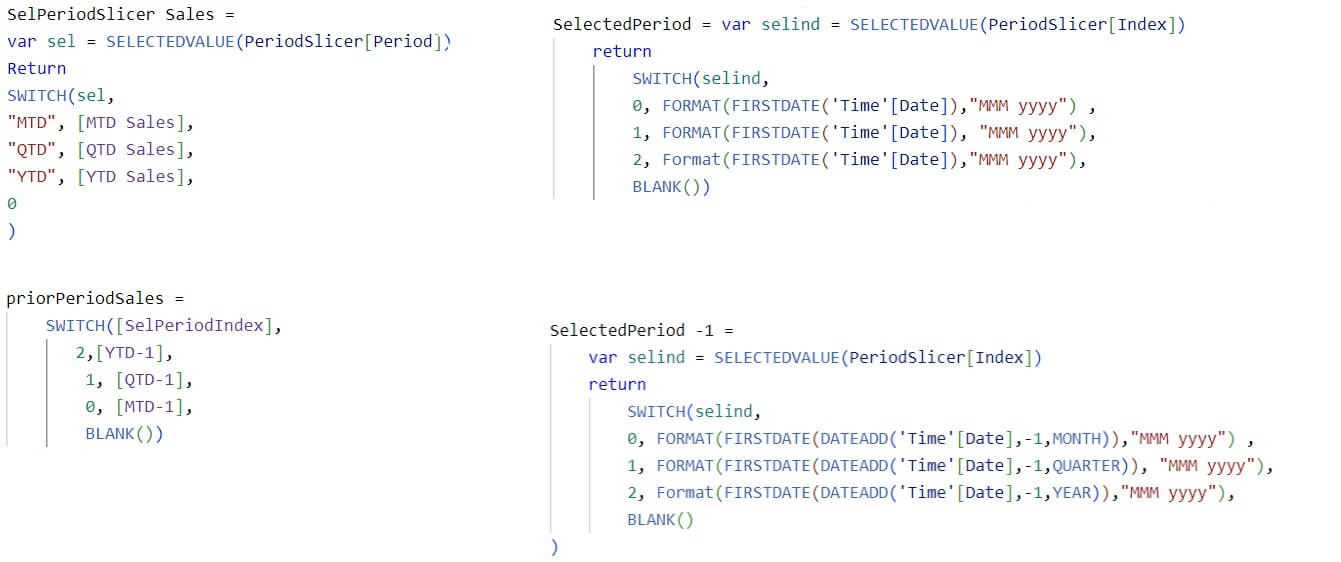
SelPeriodSlicer Sales uses the Switch function to display Sales based on the MTD/QTD/YTD Slicer Selection for the selected Month/Year. Similarly, the prior period sales are calculated.
SelectedPeriod shows the selected month/year. SelectedPeriod-1 shows the Prior Period based on MTD/QTD/YTD Slicer Selection for the selected Month/Year.
The measures used are shown in the below image.
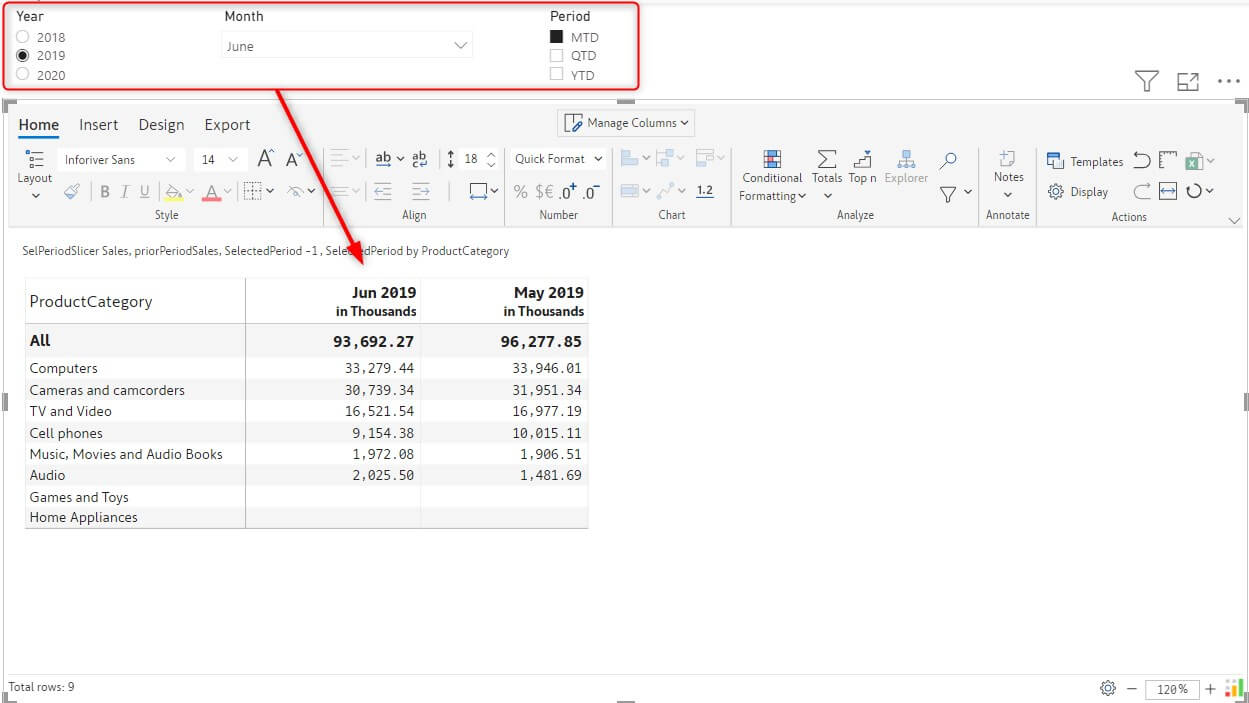
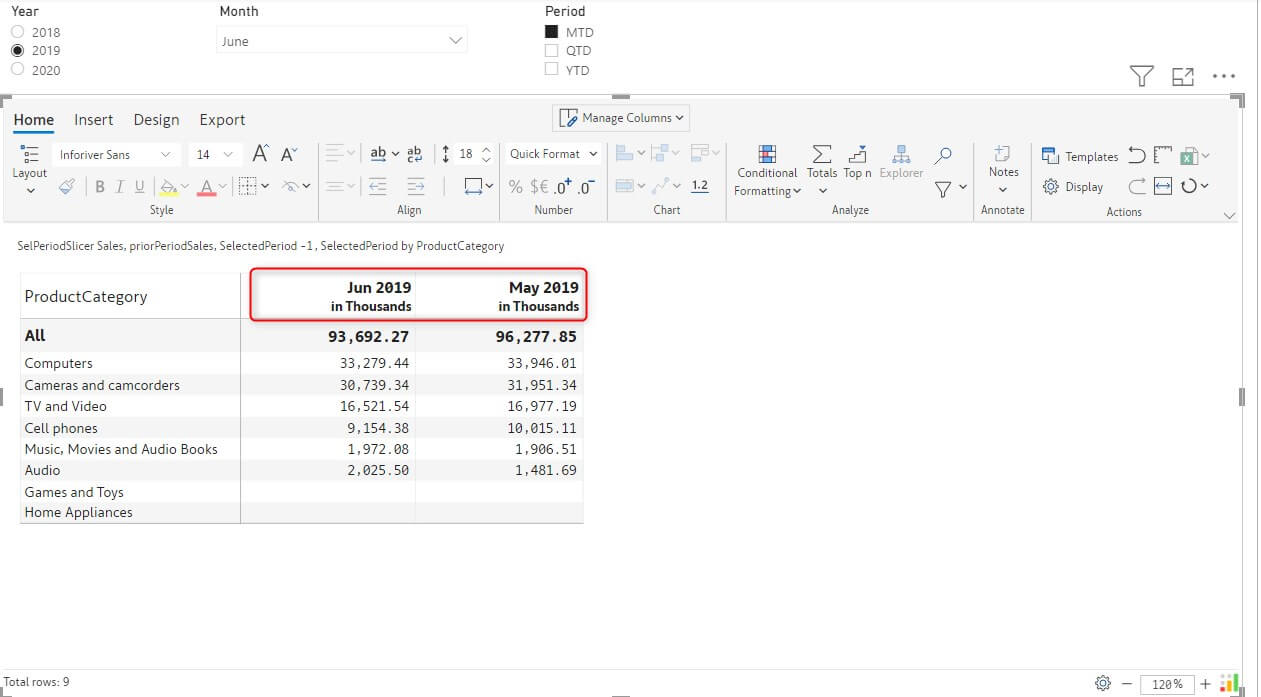
You have now created dynamic column headers using DAX measures in Inforiver.
***
Download a free edition of Inforiver Matrix and get started today!
We'd love to hear your ideas for Inforiver – be it a cool new feature or an improvement on existing features. Visit the Inforiver Community to share your ideas, vote on other submissions, and interact with other users.


About Inforiver!
Inforiver is the fastest way to do everything in Power BI. It enables citizen developer productivity and unleashes true self-service with our intuitive and interactive no-code data app suite for Microsoft Power BI. The product is developed by Lumel Technologies Inc, who are #1 Power BI Visuals AppSource Partner serving over 3,000+ customers worldwide with their xViz, Inforiver, and ValQ offerings.


 Join this webinar to explore the significant upgrades in Inforiver Enterprise 2.9, highlighting new capabilities such as enhanced writeback options, dynamic data inputs, and advanced forecasting controls.