
Upcoming webinar on 'Inforiver Charts : The fastest way to deliver stories in Power BI', Aug 29th , Monday, 10.30 AM CST. Register Now
Upcoming webinar on 'Inforiver Charts : The fastest way to deliver stories in Power BI', Aug 29th , Monday, 10.30 AM CST. Register Now
We often hear about budgets, plans and forecasts, and may have wondered – how are they different? Well, let’s take a quick look.
A budget is a goal (or an expectation) set by a business for an upcoming financial cycle. For example, ACME Corp finalized its annual budget for the upcoming financial year Jan to Dec 2024 in Oct 2023.
A forecast is a business projection that tells the business what they are likely to achieve.
The relationship between forecast & budget can be defined as follows: A forecast tells whether the company is likely to achieve the budgeted target.
Although some companies and industries use the term "plan" instead of "budget," they essentially mean the same thing.
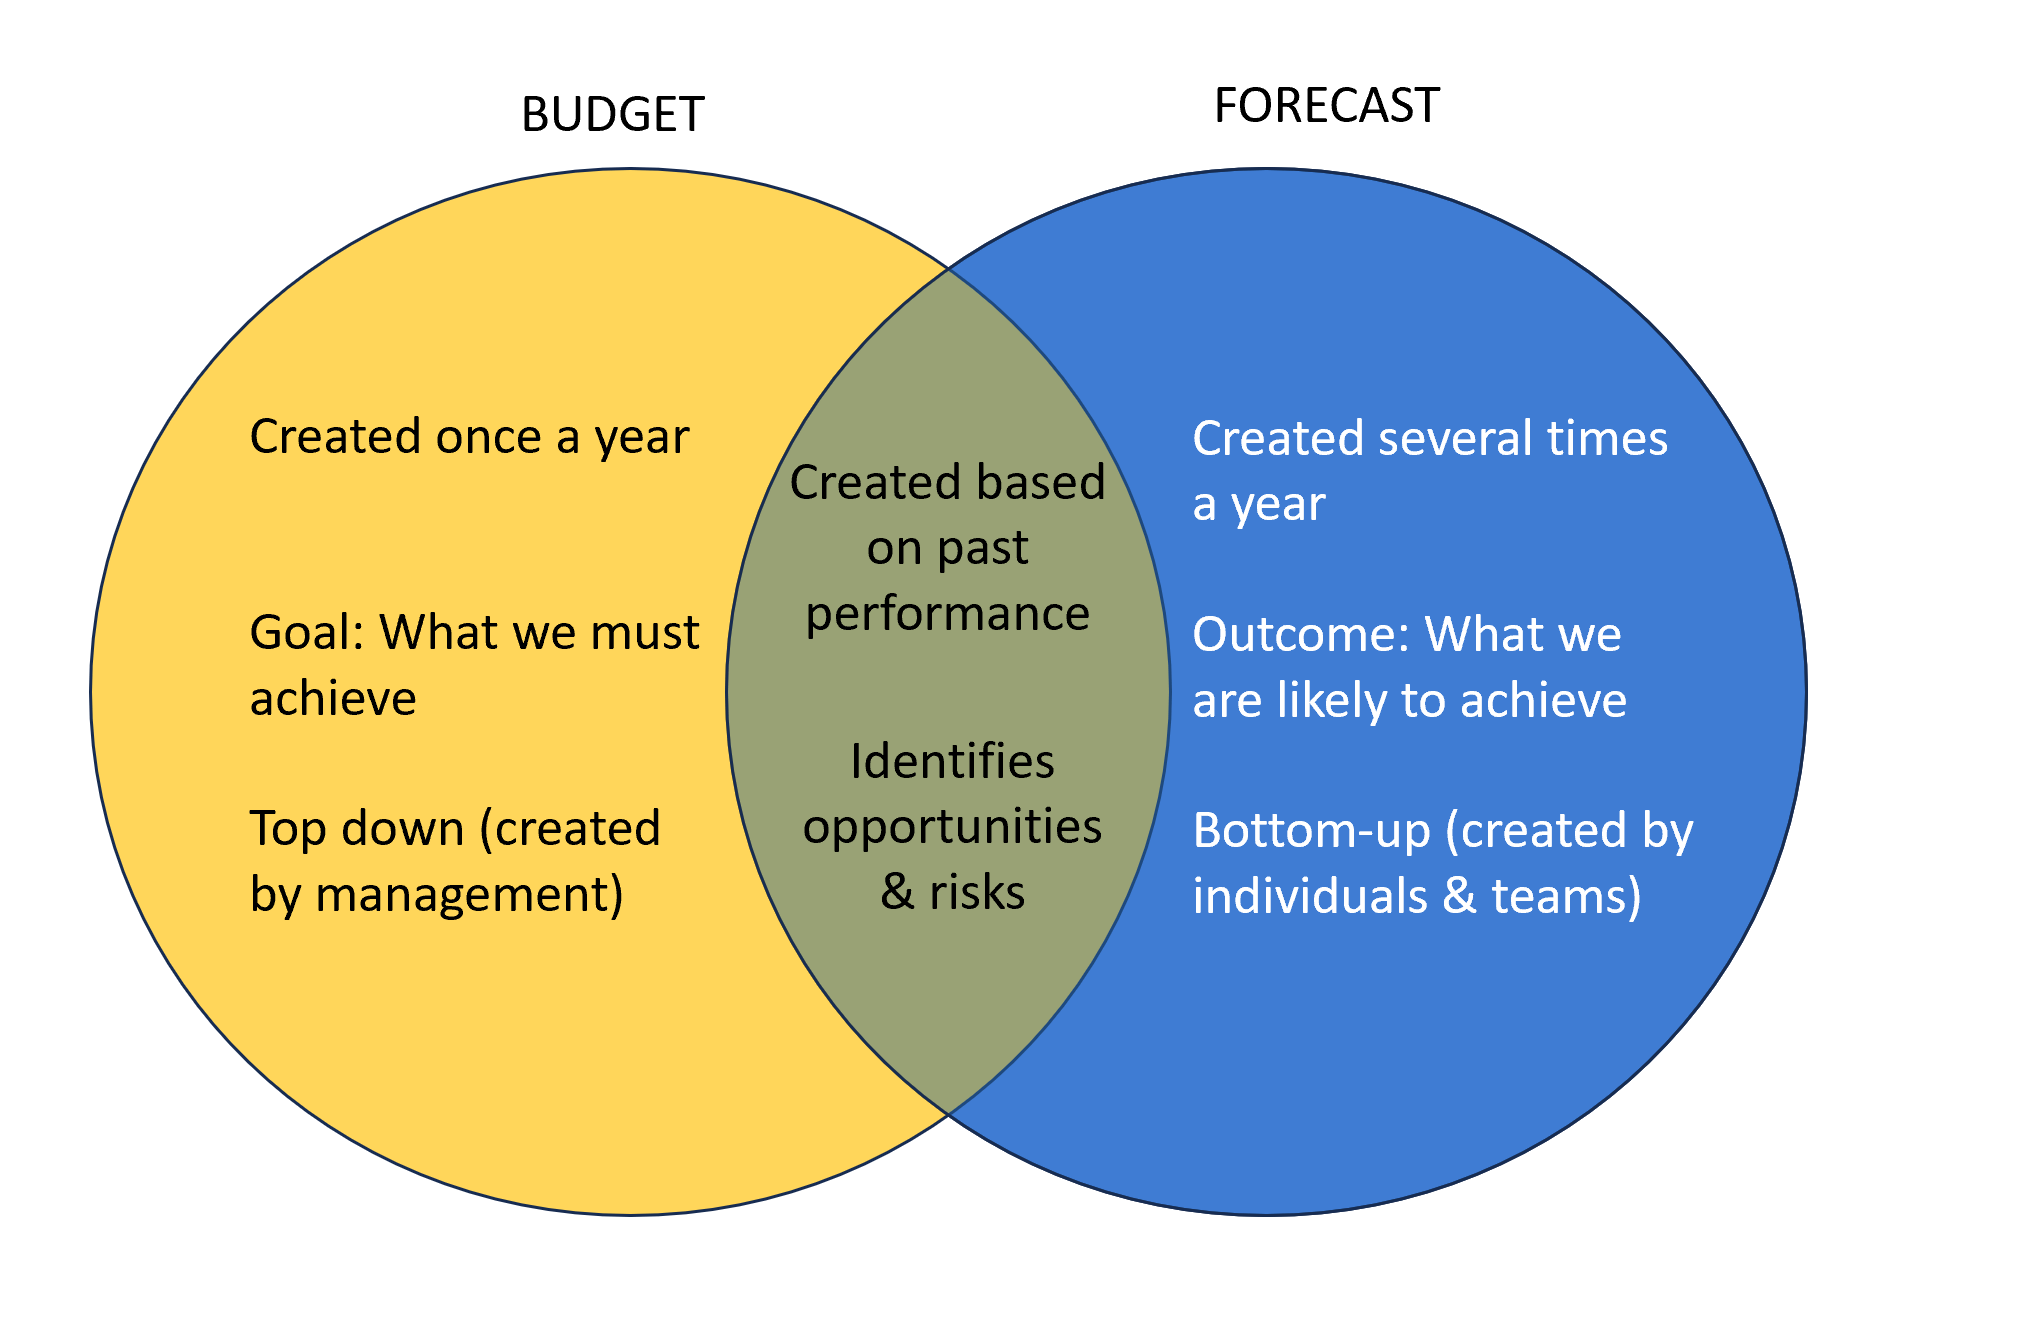
There is a major difference between a budget and a forecast with respect to frequency
Budgets are usually done once a year (annual budget). A budget typically represents the plan for the upcoming financial year. Businesses ‘freeze’ budgets once they are finalized. These numbers do not change during the course of the subsequent year. However, firms are known to update budgets (on an exceptional basis) in the middle of the year if market conditions or business objectives change drastically. This is also called rebudgeting, or in simpler terms, budget revision.
Forecasts are created several times in a year. A forecast is usually created for a shorter period as compared to a budget, say, for the upcoming 12-weeks or 4 months.
Let us take one line item - contractor expenses from ACME Inc. – to illustrate an example.
The firm creates a budget before the fiscal year covering 12 months. This budget includes a line item for contractor expenses. This is indicated in the first line below.
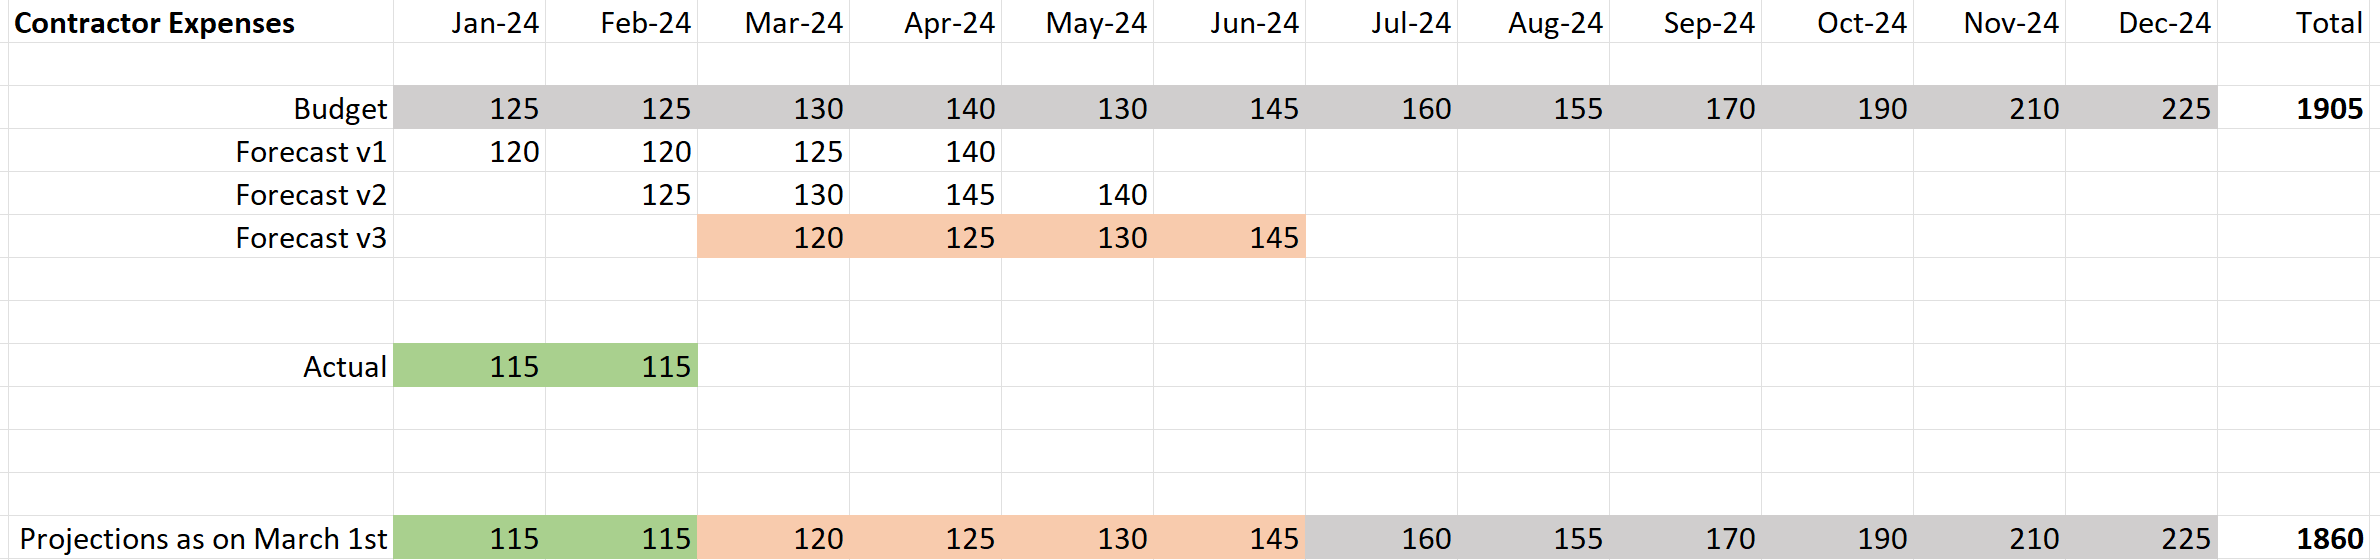
On Jan 1st, the firm creates a forecast for Contractor expenses for the upcoming four-month period from Jan to Apr (Forecast v1). The amounts are different from the budget as market & business conditions have changed since then.
On Feb 1st, the firm creates an updated forecast, covering projections for Feb to May (Forecast v2).
On Mar 1st, it has a third version of the forecast projecting expenses from Mar through Jun (Forecast v3).
This method continues for the rest of the year. This method of forecasting is called Rolling forecasting.
At any point in time, the annual forecast is calculated by adding the actual expenditure for elapsed periods + forecast for future periods (refer last line in the image above). In case forecast is not available for some of the future periods, the original budget amounts are used (or sometimes the forecast is extrapolated by a simple formula such as trailing 3-month average, adjusted for seasonality)
In this case, the forecast for 2024 as on March 1st is calculated as follows:
2024 Projected Expenditure = Actuals for elapsed period (Jan + Feb) + latest Forecast (Mar through Jun) + Budget amounts for missing forecast period (Jul to Dec).
This is explained in the image above.
Budgets are typically created by management to drive organizational alignment, where all departments and business units operate in cohesion. You would not want to manufacture more widgets when your sales and customer service are understaffed. While budgets are assigned to departments and business units, they are also used to set high-level expectations on quarterly and annual performance goals with external stakeholders such as analysts and investors. In a lot of organizations, management prepares a budget and assigns it to specific departments by the management. In this way, budgets follow a top-down approach.
Forecasts are created by specific departments and teams, and usually by people on the field. For example, sales reps may submit a 3-month forecast to their sales manager each week. This may contain details on what the rep is likely to achieve for designated products in a designated territory. This data is intended for the management to understand where the business is headed. In essence, forecasts follow a bottom-up approach.
Inforiver offers great flexibility in creating budgets (from blank templates or from prior year data) and forecasts (manually entered forecasts, forecasts projected using formulae, rolling forecasts, and more).
Visit our budgeting and forecasting page to learn more.

Inforiver helps enterprises consolidate planning, reporting & analytics on a single platform (Power BI). The no-code, self-service award-winning platform has been recognized as the industry’s best and is adopted by many Fortune 100 firms.
Inforiver is a product of Lumel, the #1 Power BI AppSource Partner. The firm serves over 3,000 customers worldwide through its portfolio of products offered under the brands Inforiver, EDITable, ValQ, and xViz.


