Upcoming webinar on 'Inforiver Charts : The fastest way to deliver stories in Power BI', Aug 29th , Monday, 10.30 AM CST. Register Now
Upcoming webinar on 'Inforiver Charts : The fastest way to deliver stories in Power BI', Aug 29th , Monday, 10.30 AM CST. Register Now
Allocating budgets is a common technique that simplifies the approach to strategic and financial planning. Allocations help organizations plan at a macro level and distribute available budgets and resources across departments, locations, plants, products, teams, and even time.
Let us explore this with an example.
You have a budget of $2M for hiring in 2024. Your company, ACME Inc., operates in four regions. How will you allocate this across regions?
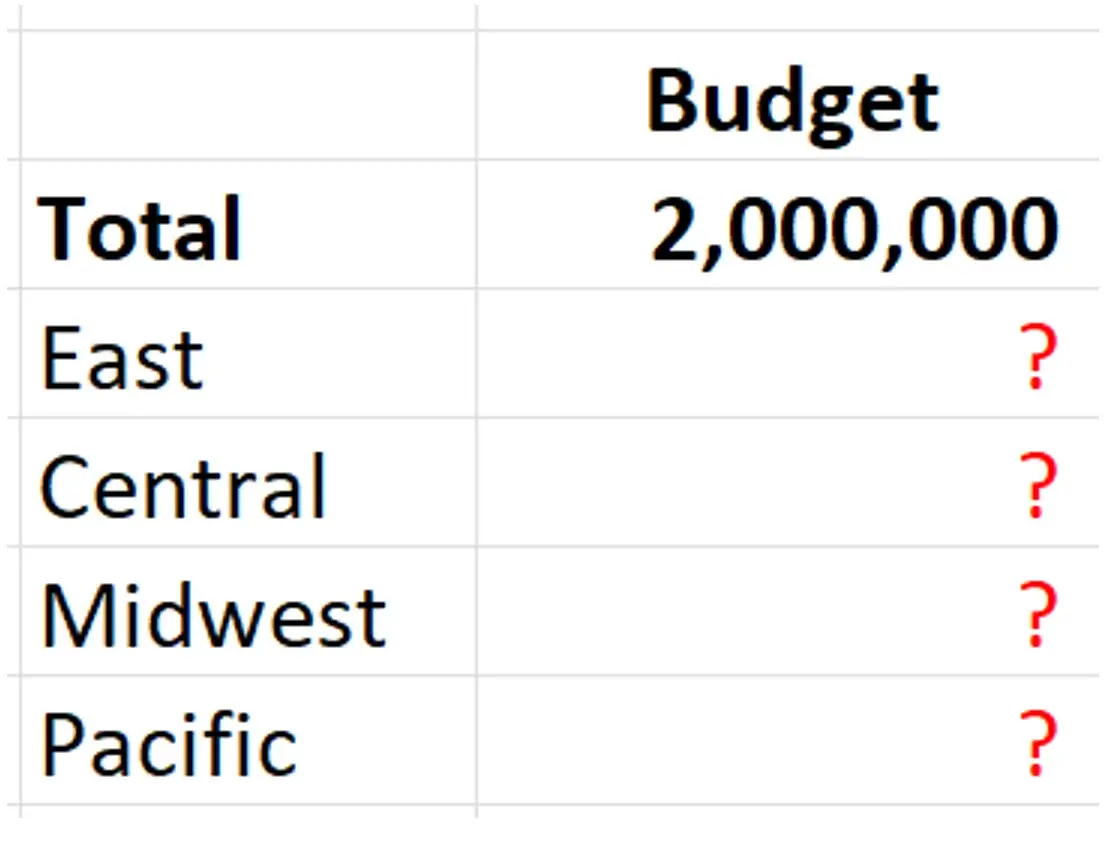
One option will be to allocate the budget equally across regions. However, this is not a practical and effective use of resources.
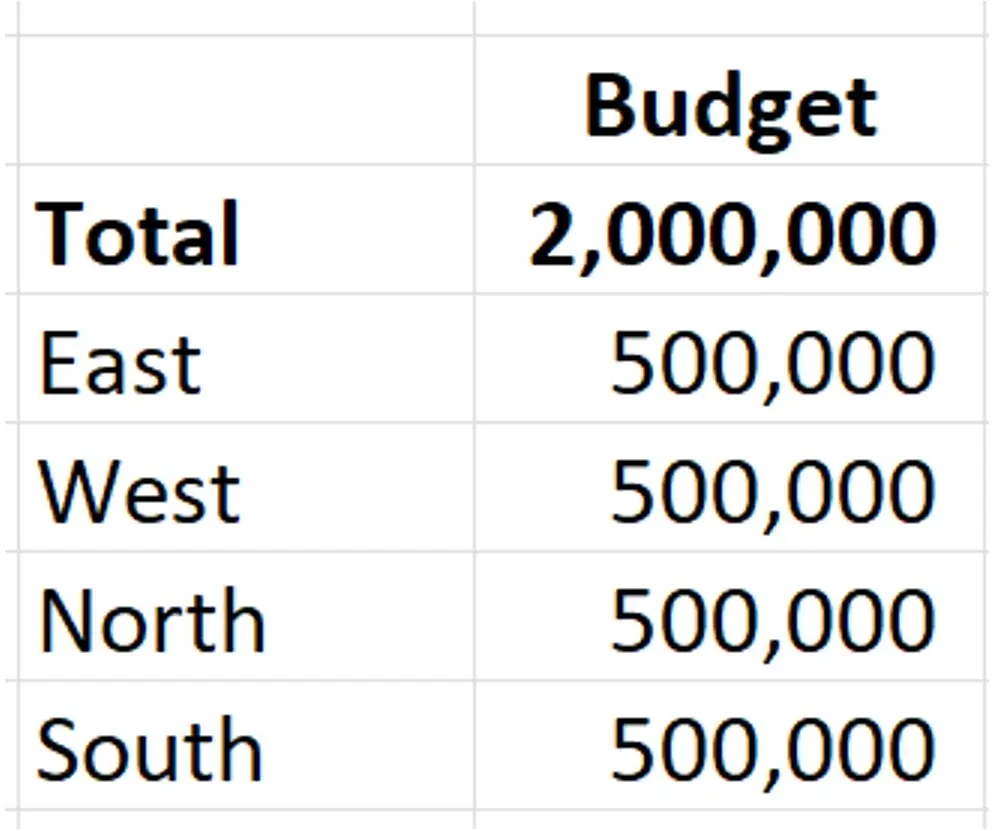
A better way would be to allocate higher budget amounts to regions that bring in more revenue. In this example, we need to allocate a higher amount for East and Central regions than the rest.
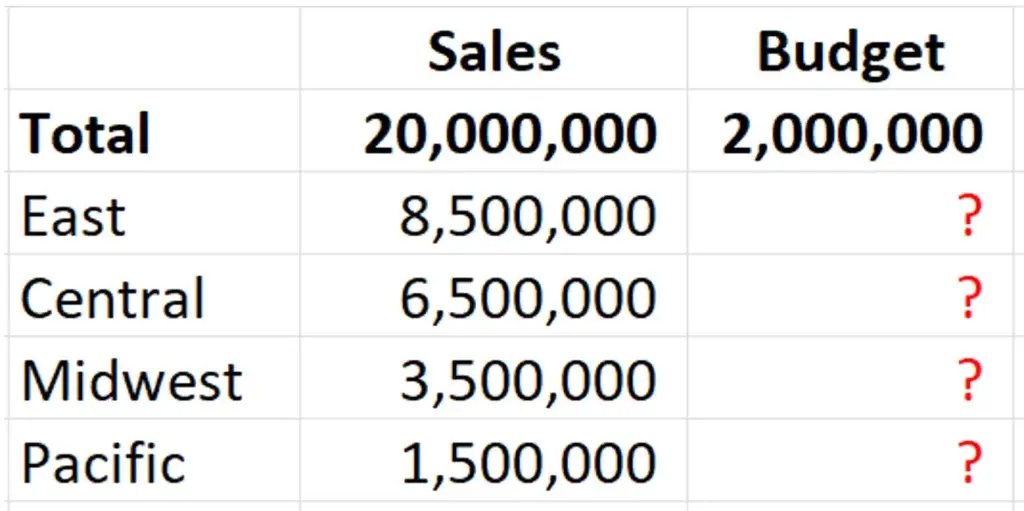
To do this, calculate the total contribution to sales by region. Then, use the weights to allocate targets.
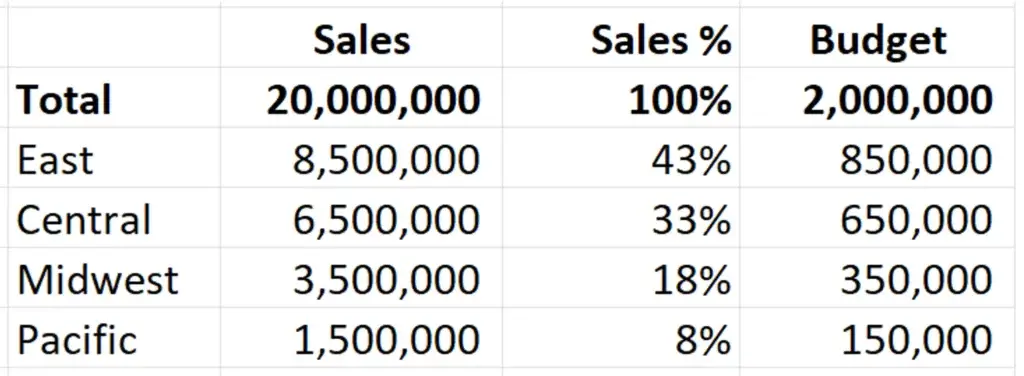
This example is quite straightforward as there are fewer items. A consumer goods firm can manage several dozen brands, each with hundreds of products and over several thousand SKUs. Allocating resources across these categories, regions, and even over time (month, quarter, etc.,) becomes very challenging even in Excel.
Only advanced planning tools such as SAP Analytics Cloud, Hyperion, and Oracle EPM provide allocation functionality. You can get the same powerful allocation capabilities with a much better interface and ease of experience right inside Power BI.
Inforiver helps you deliver advanced allocation techniques in Power BI. Here are a few examples.
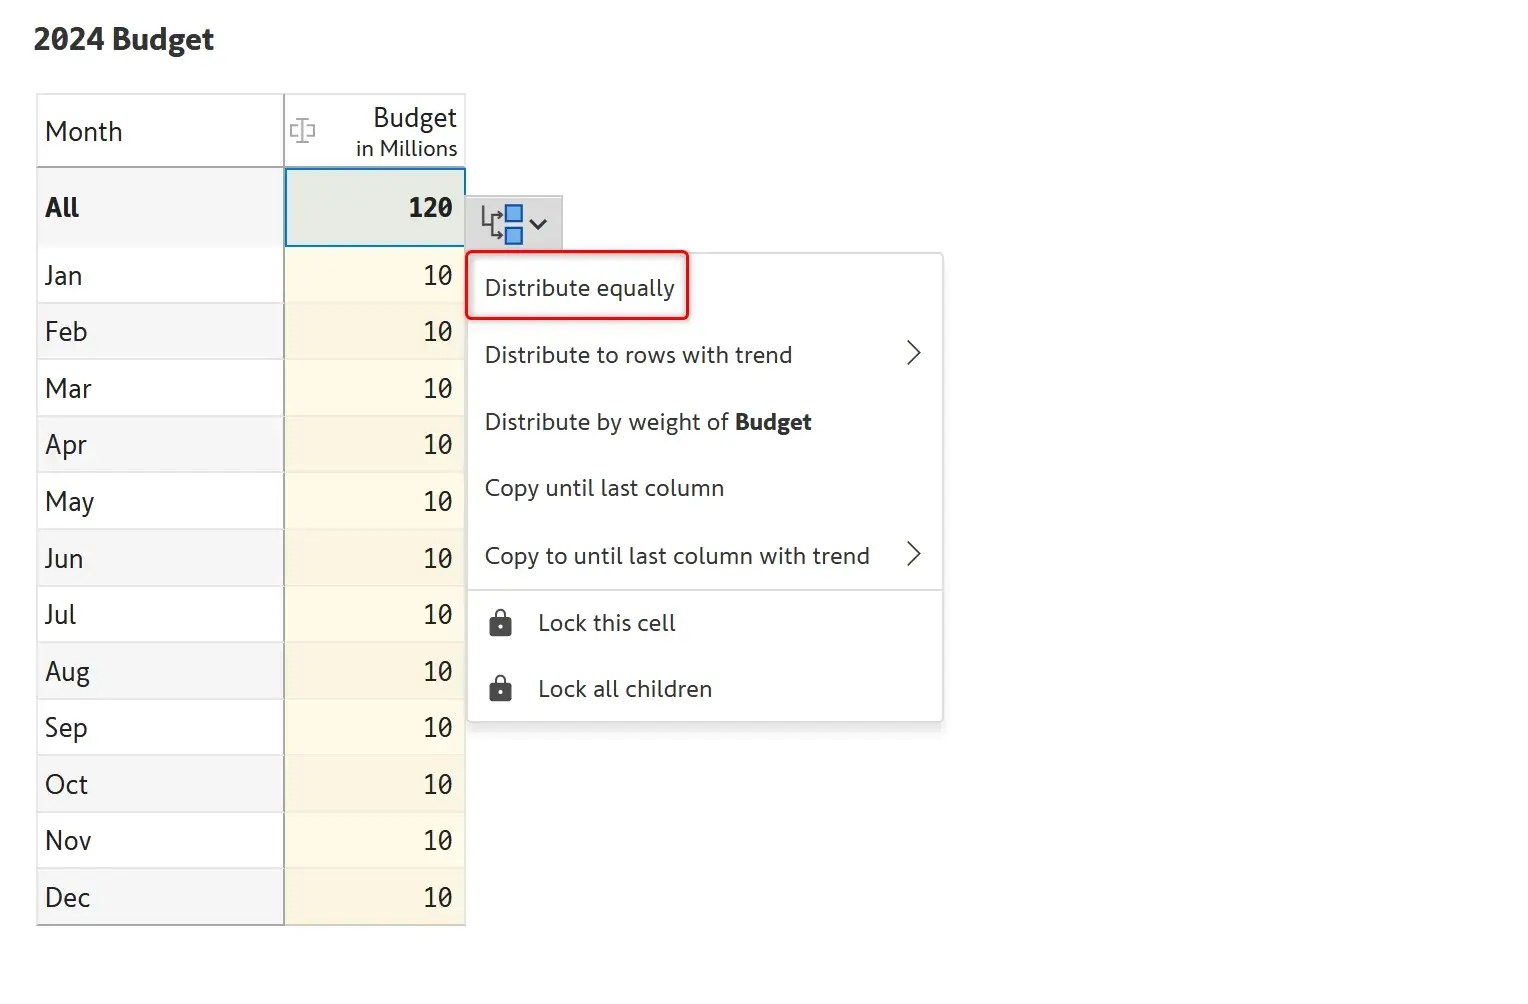
In this example, we are entering 120M for 2024, which gets automatically allocated equally across all months.
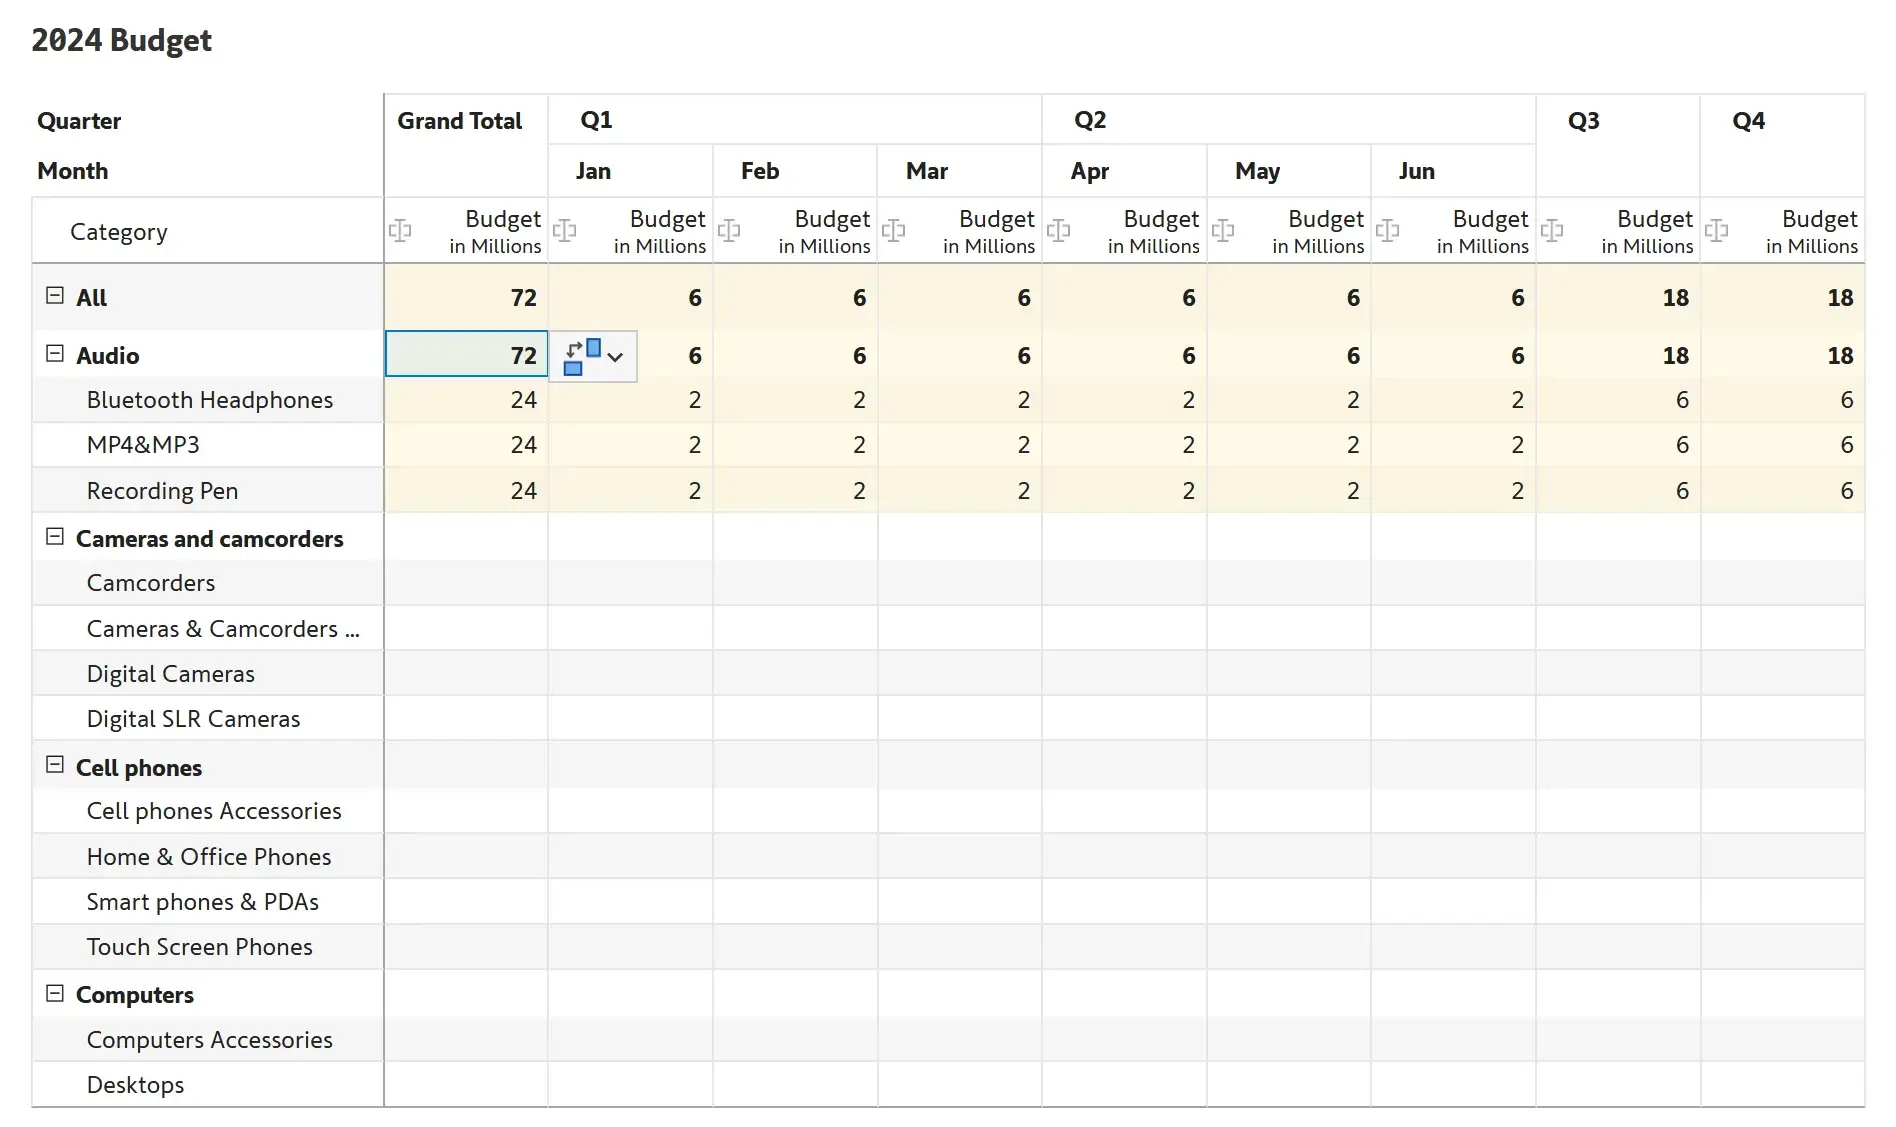
In this example, we are budgeting a target of 72m for the audio category, which (a) gets distributed equally across three subcategories, and (b) gets distributed equally across months.
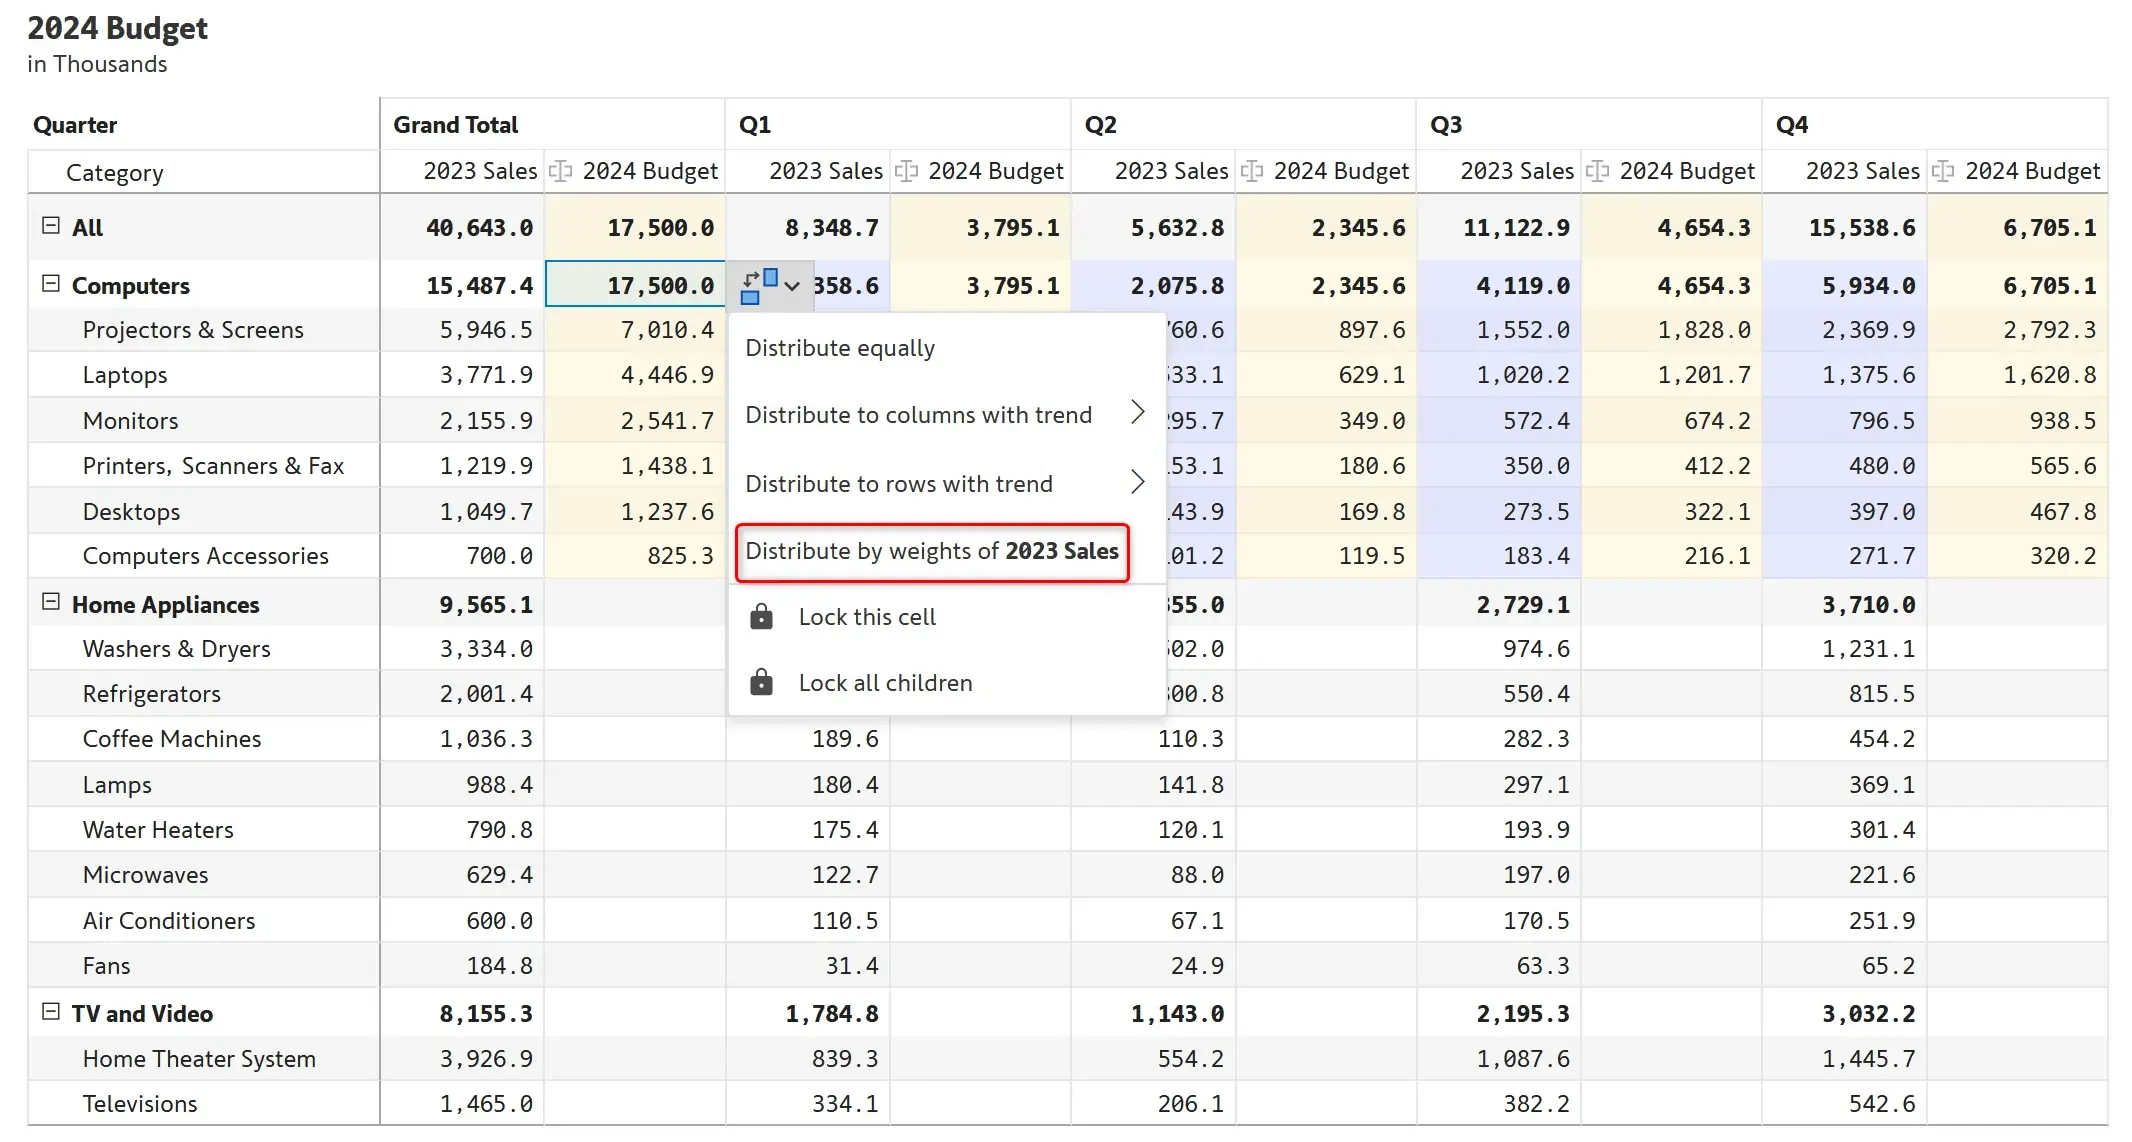
In this example, we are creating a budget of 17.5m for computers and performing a weighted allocation across subcategories and quarters based on past performance (2023 sales). This method helps you allocate resources effectively for items that are seasonal.
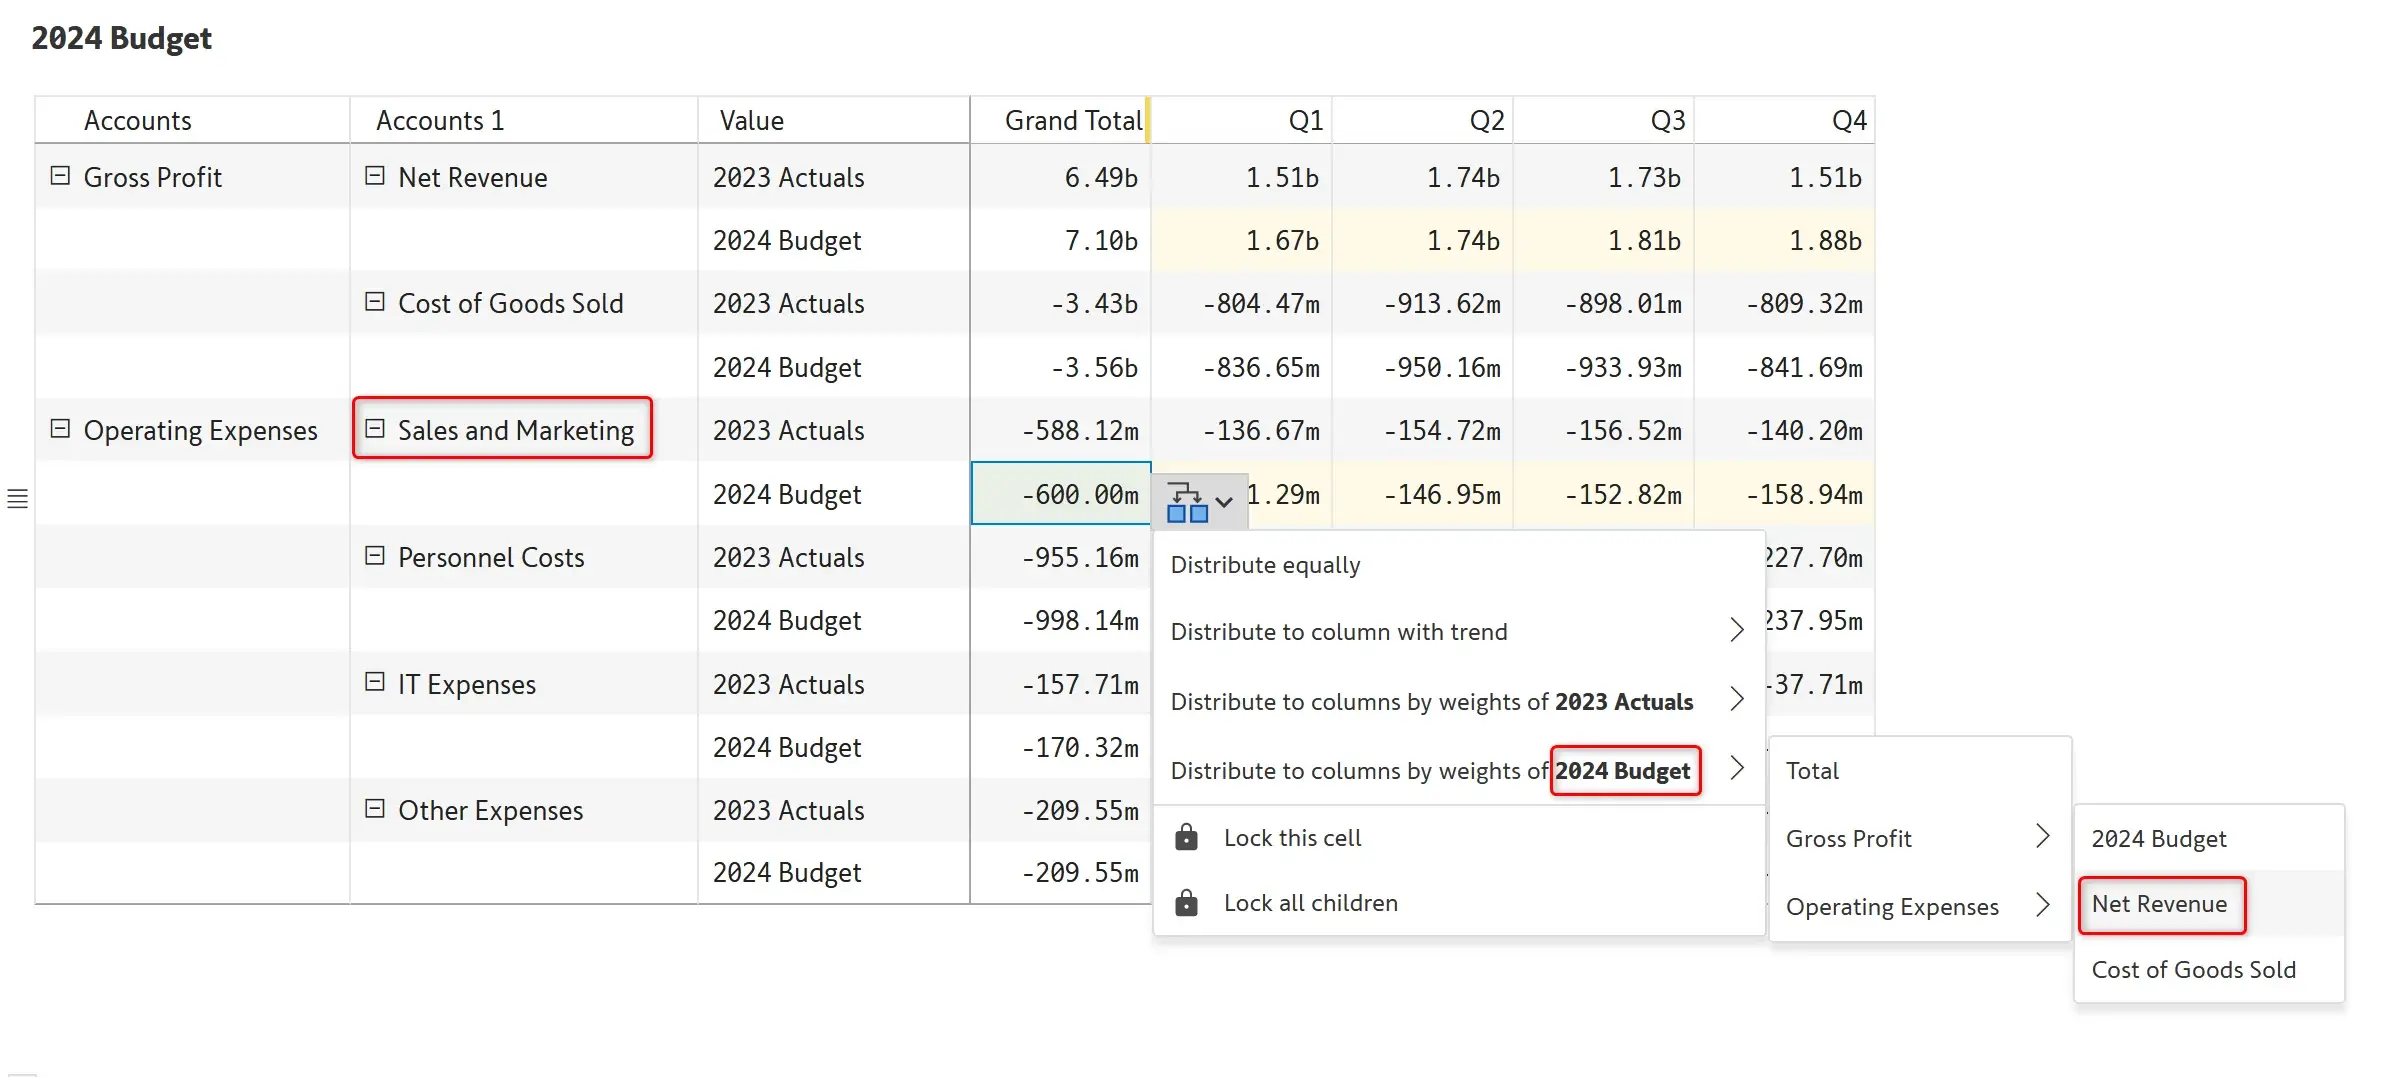
A common use case for this is allocating indirect costs based on sales, headcount, etc. In this example, sales and marketing budgets are reallocated across quarters based on net revenue.
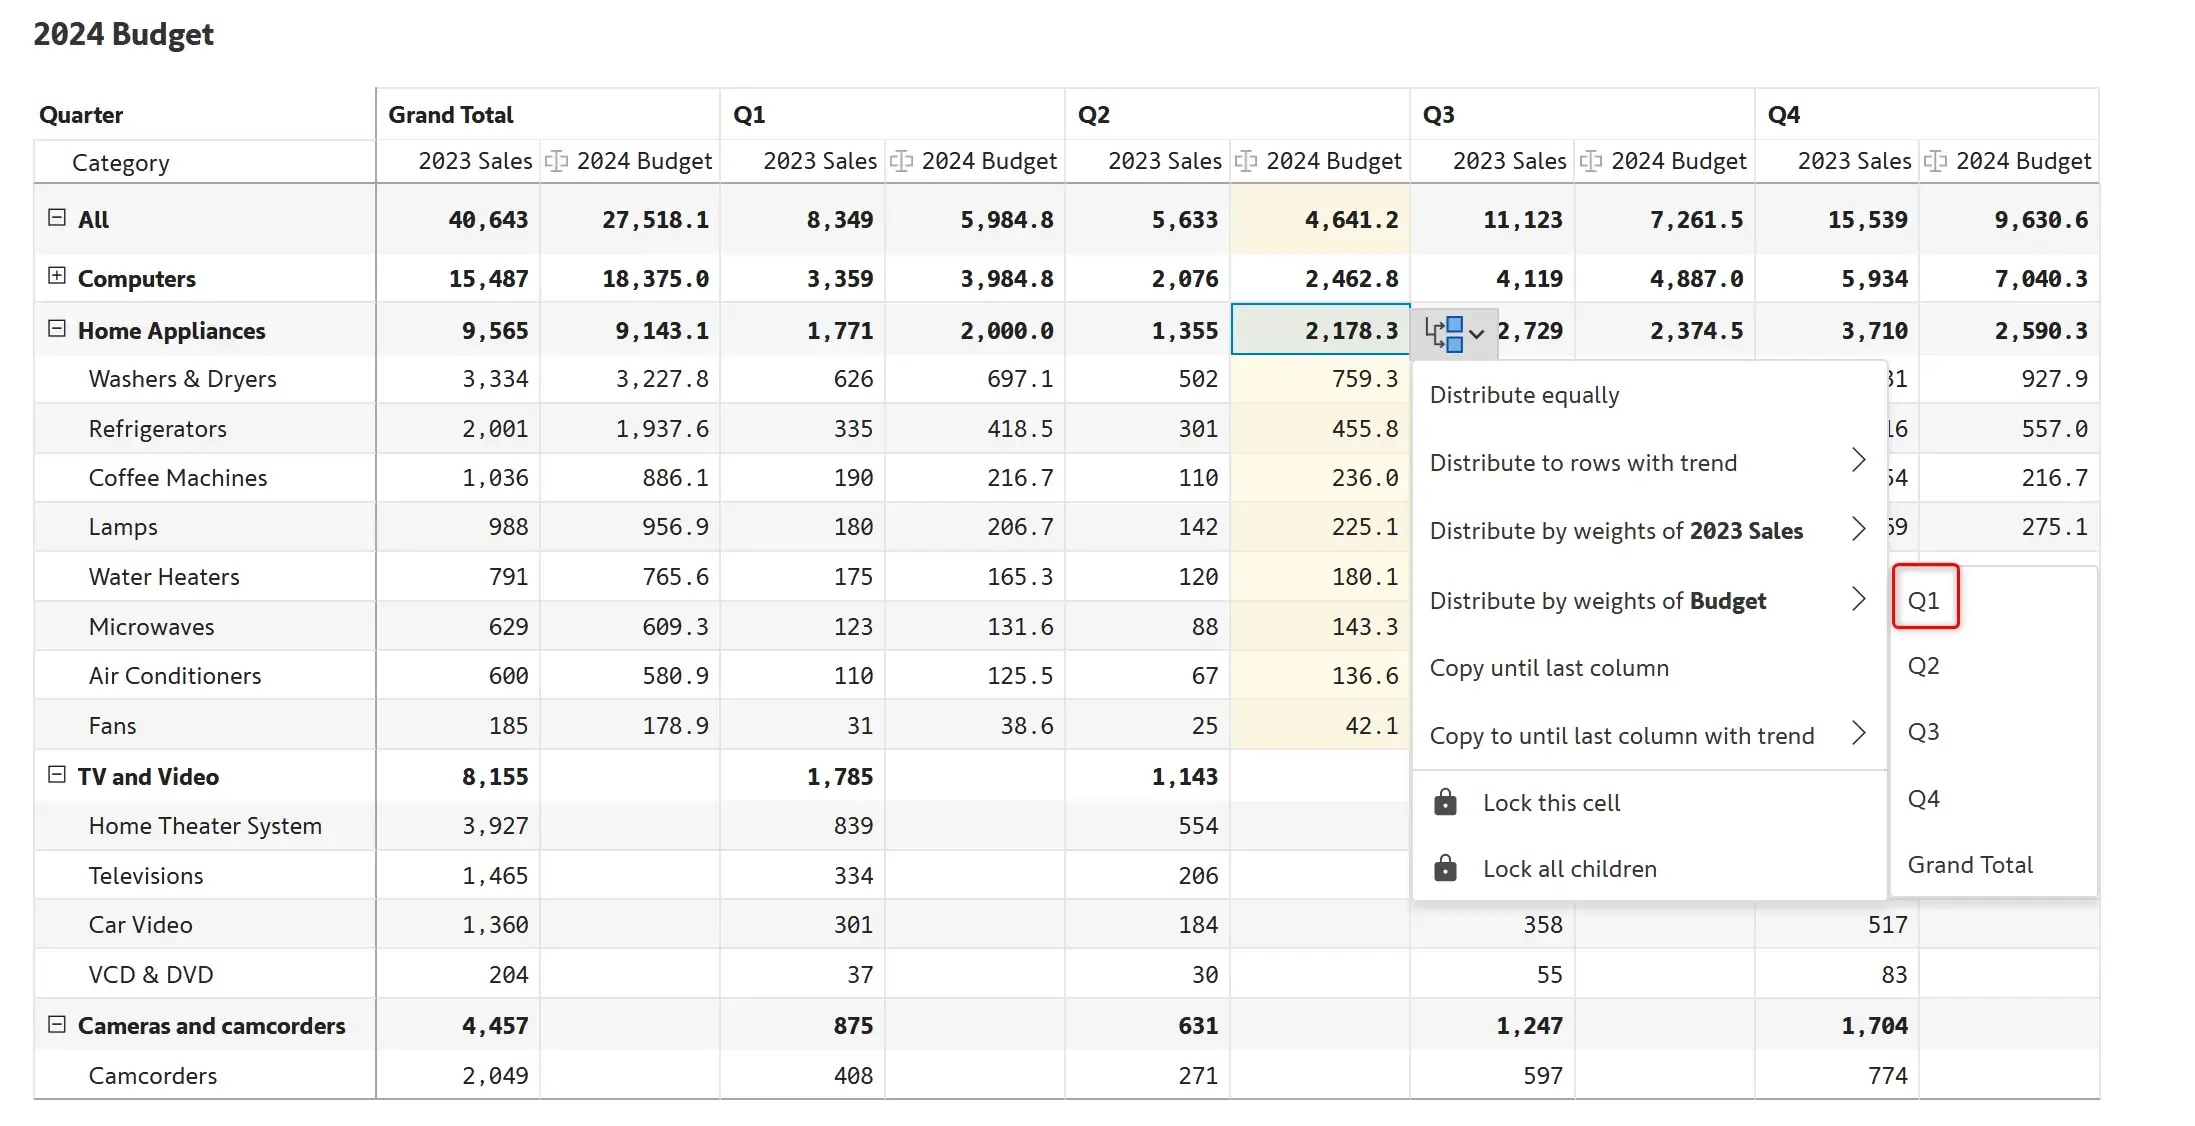
In this case, we are allocating values for Q2 based on weights from Q1.
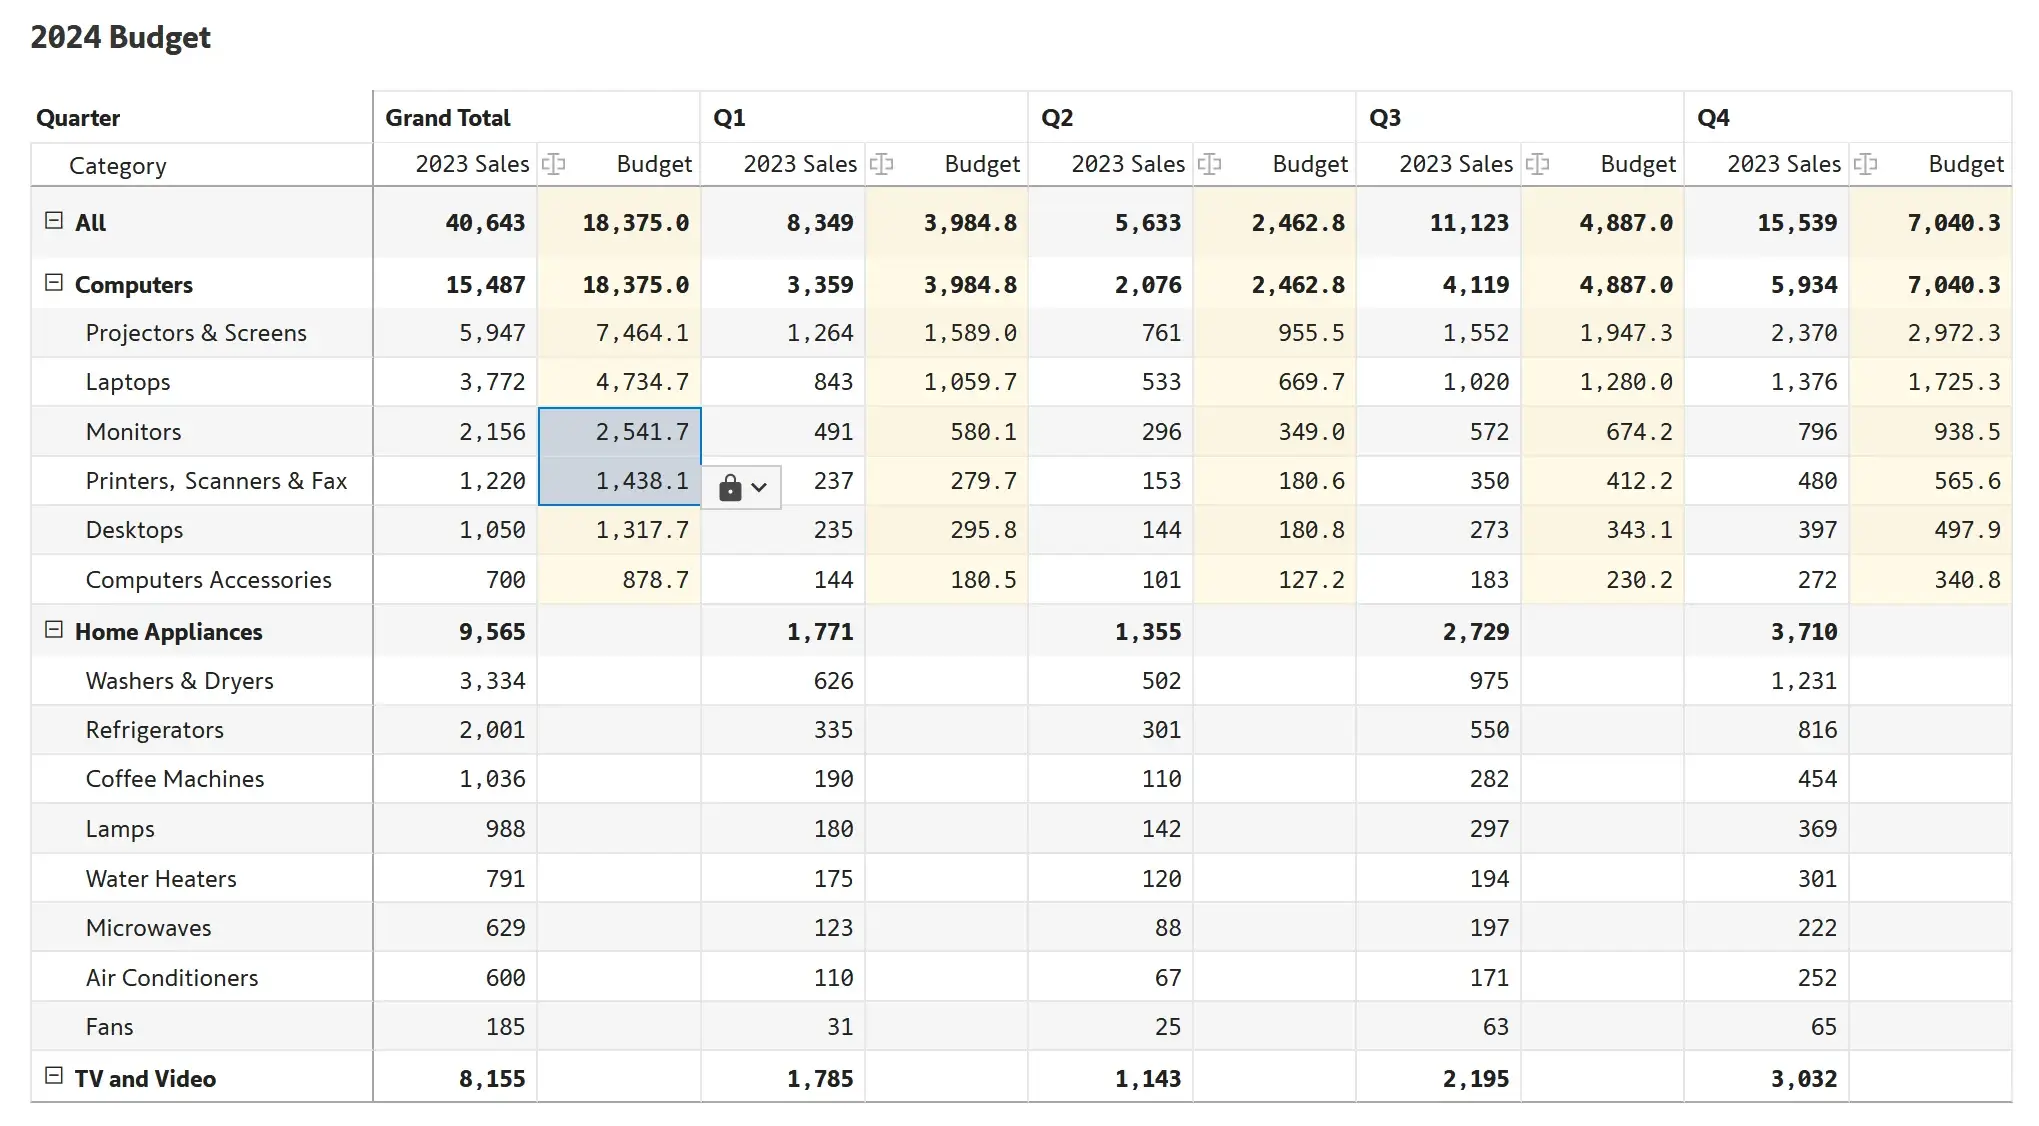
Any changes made to computers, or the overall budget will not affect monitors and printers.
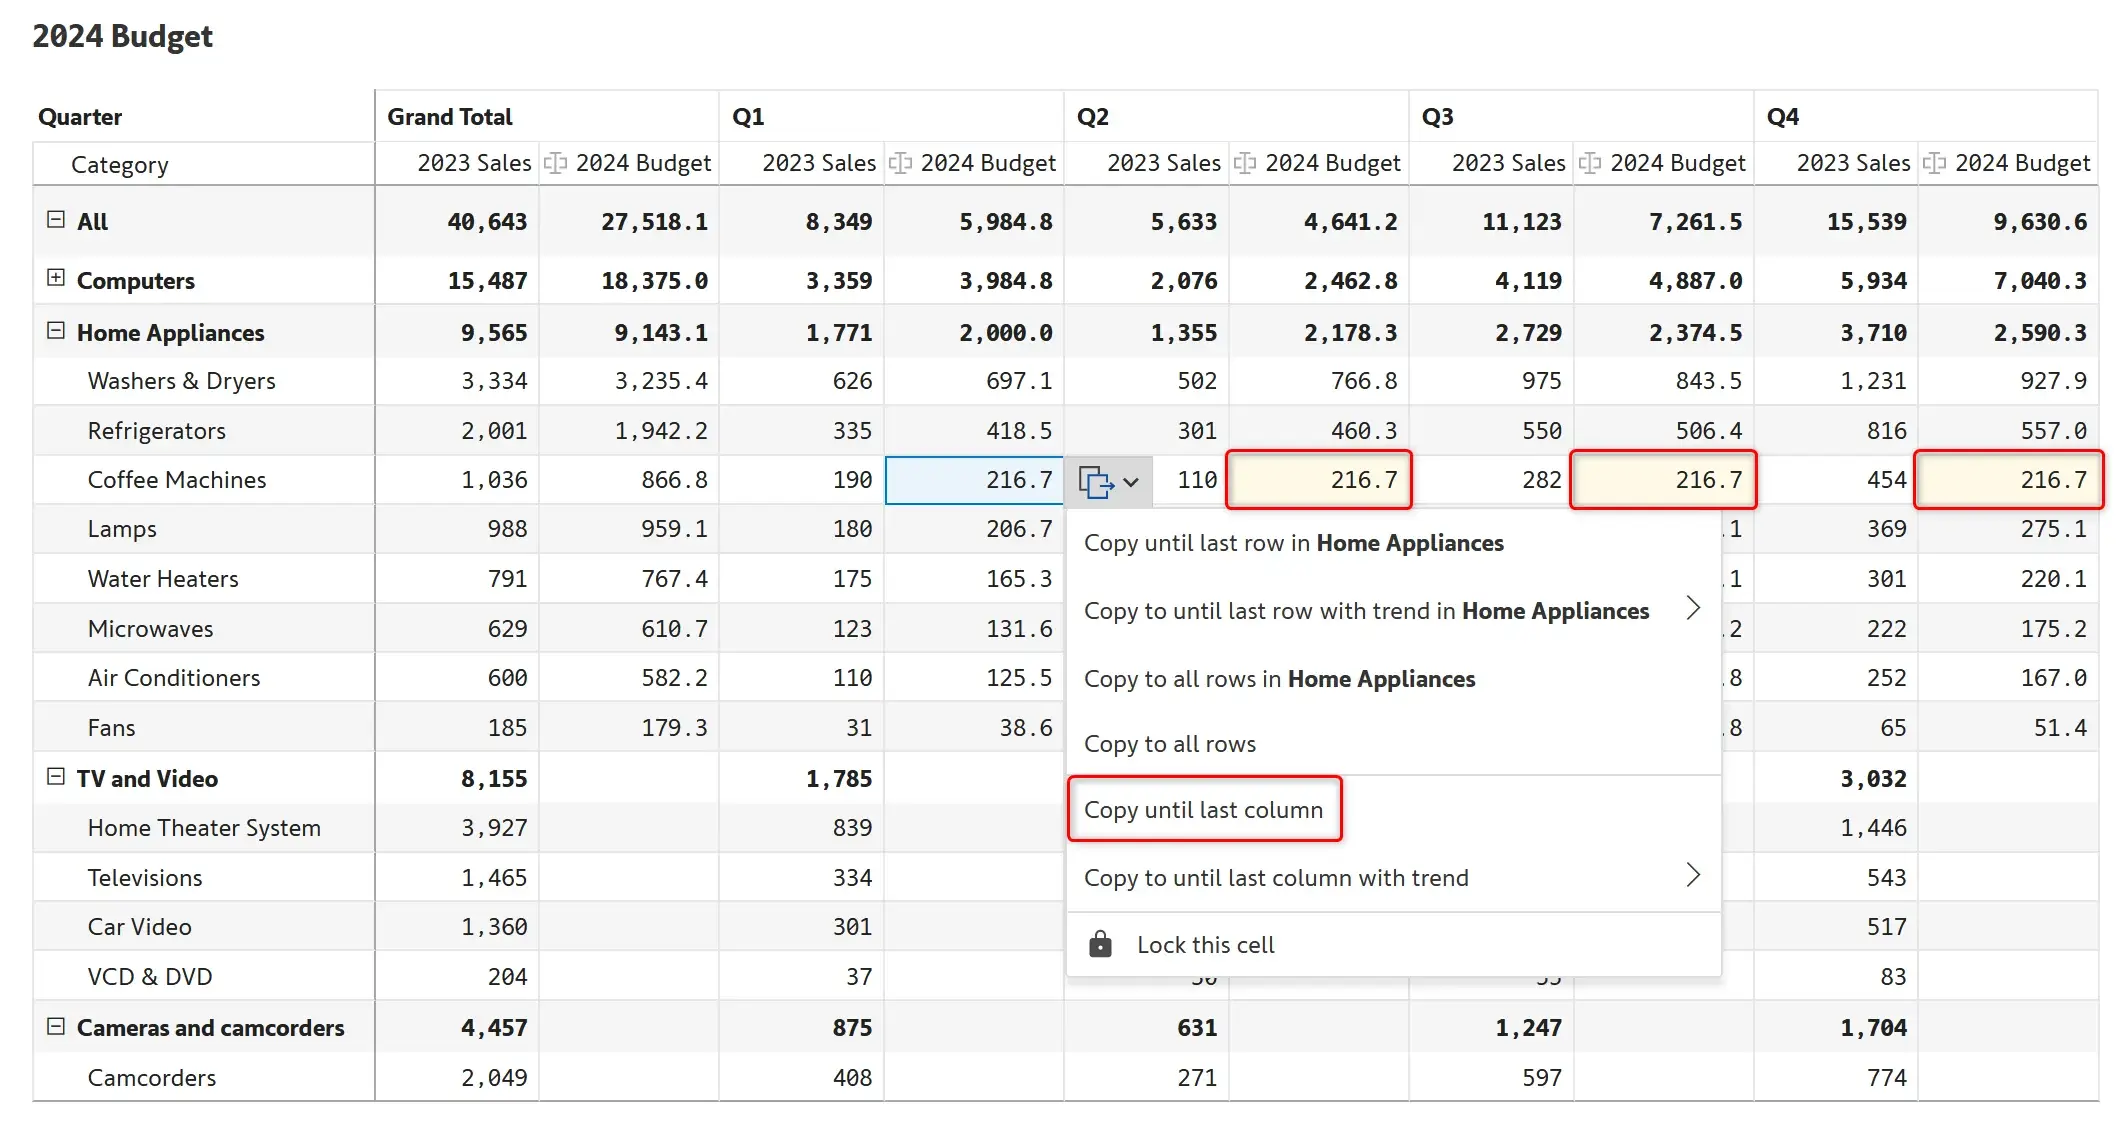
In this example, Q1 value for Coffee Machines is copied till the last quarter.
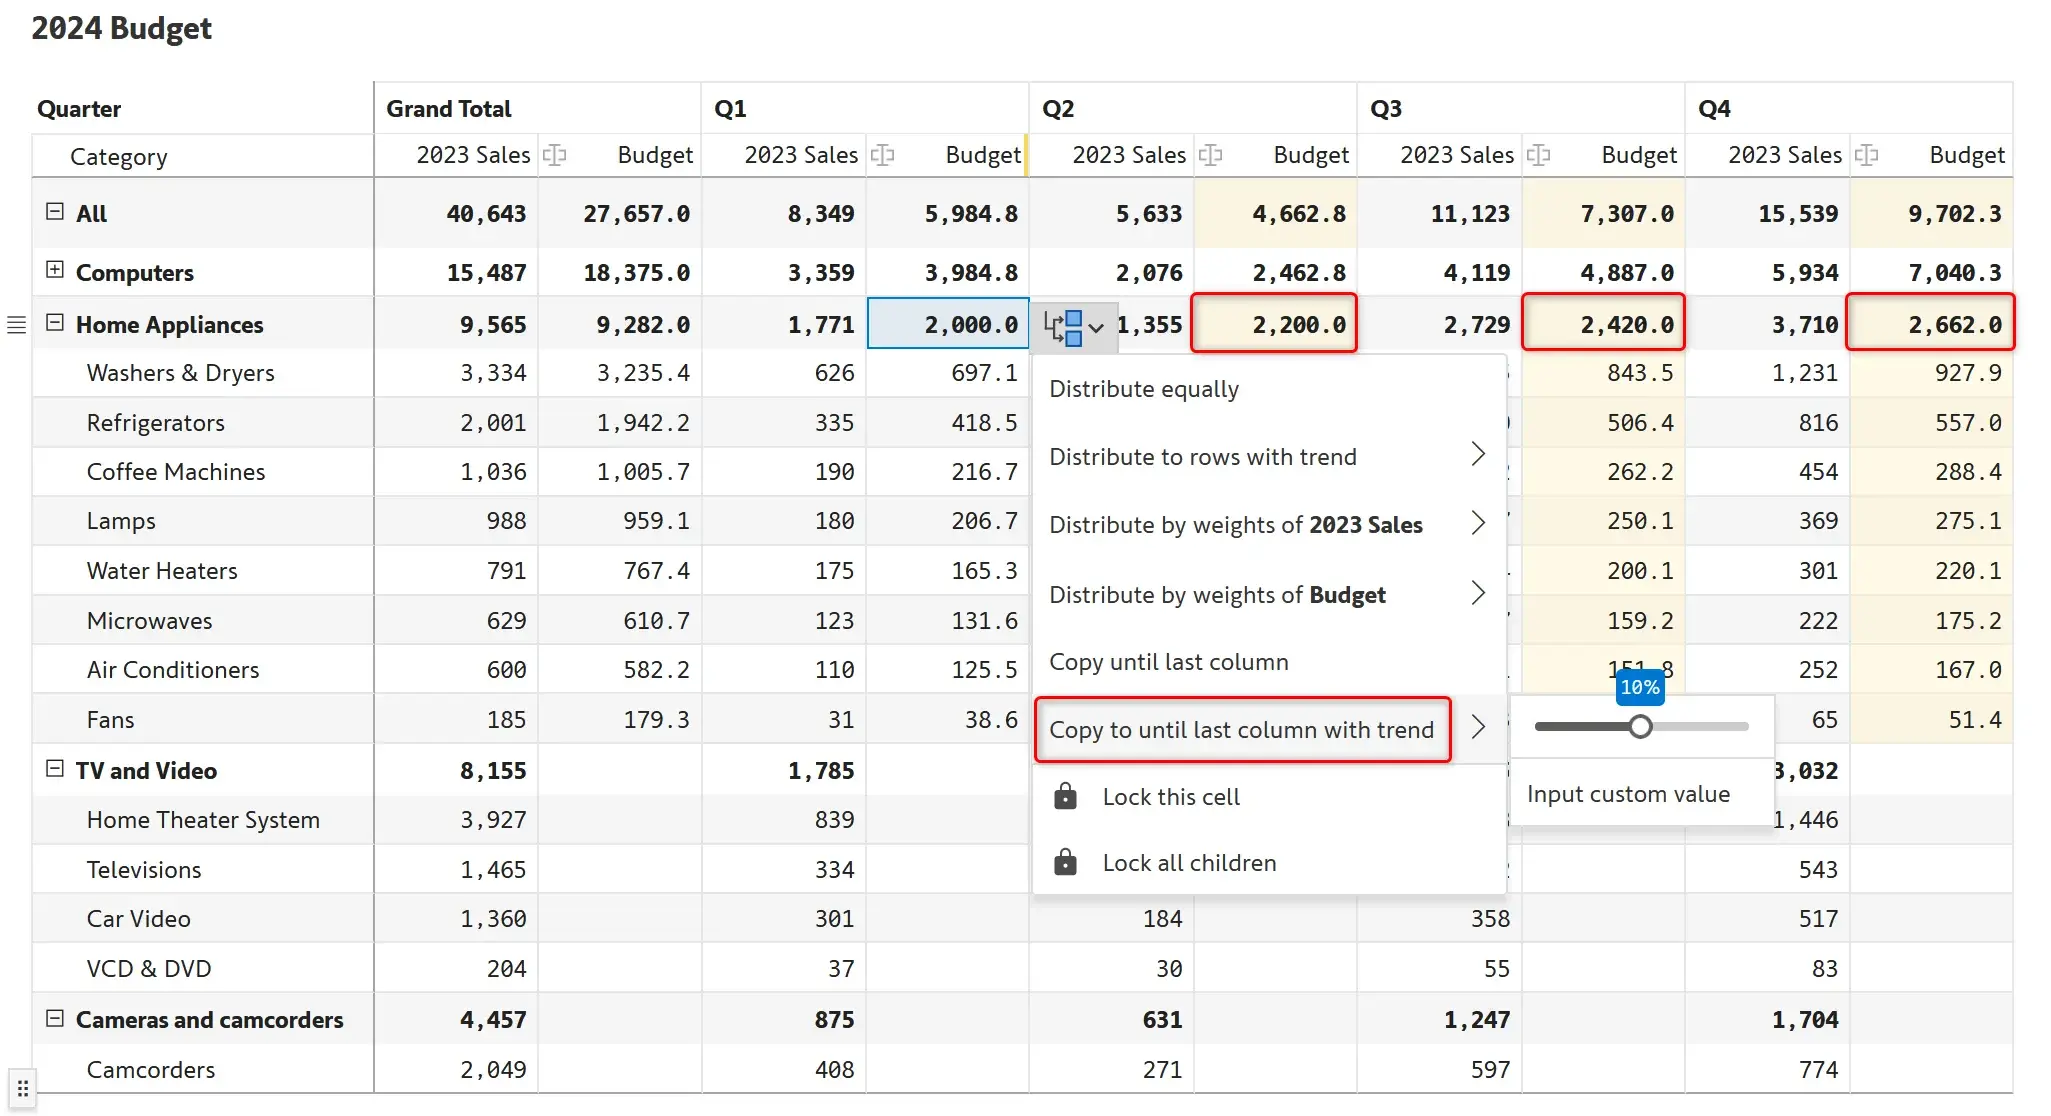
A 10% QoQ growth rate for home appliances is applied in the below example.
***
Learn how you can visually allocate budgets from category to subcategory level using Inforiver's in-built functions without writing complex DAX scripts.
Using Inforiver, you can create and adjust budgets much faster in Power BI than in Excel. In addition, Inforiver ensures that you can create budgets without writing any code and with minimal dependency on your IT department.
Learn more about Budgeting in Power BI here.
Inforiver helps enterprises consolidate planning, reporting & analytics on a single platform (Power BI). The no-code, self-service award-winning platform has been recognized as the industry’s best and is adopted by many Fortune 100 firms.
Inforiver is a product of Lumel, the #1 Power BI AppSource Partner. The firm serves over 3,000 customers worldwide through its portfolio of products offered under the brands Inforiver, EDITable, ValQ, and xViz.