
Upcoming webinar on 'Inforiver Charts : The fastest way to deliver stories in Power BI', Aug 29th , Monday, 10.30 AM CST. Register Now
Upcoming webinar on 'Inforiver Charts : The fastest way to deliver stories in Power BI', Aug 29th , Monday, 10.30 AM CST. Register Now
It takes 5 hours for a typical Power BI expert to build a moderately-complex P&L statement in Power BI. For an average user with basic to intermediate understanding of DAX, it may take anywhere from 3 to 5 days. However, Inforiver can help you deliver financial statements 10x to 30x faster, and often in as much as 5 minutes. I know it sounds too good to be true – but let me show you five reasons why it is so easy to build P&L statements in Inforiver.
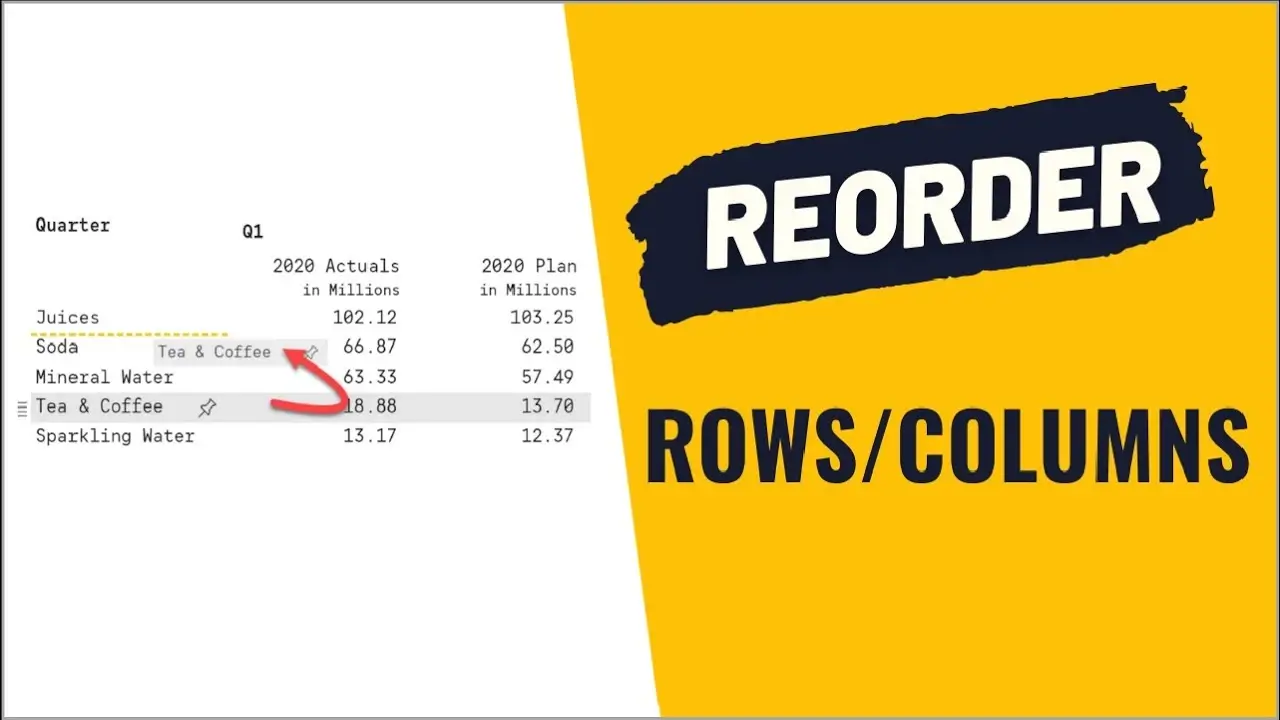
Many users who create P&L statements often run into this obstacle first – sorting their General Ledger (GL) or Chart of Accounts in the desired order. One common prescribed solution is to create a sort column in your data model – but it takes time and also has some limitations. With Inforiver, you can click-and-drag rows to create your desired custom sort order in seconds.
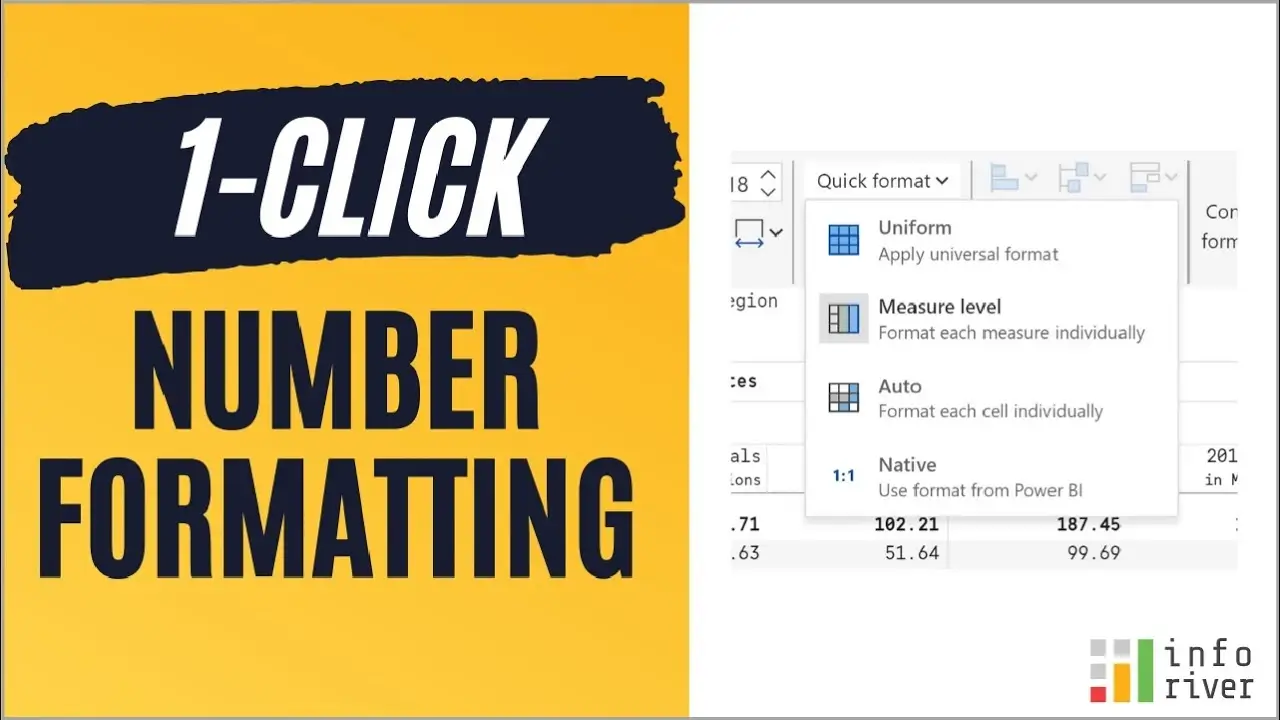
In financial statements we often see values of different scales in a single column (e.g. Revenue 1.3B, interest expense 275k). Sometimes even percentage formats need to be included (e.g. Margin 7.3%). To accommodate these in Power BI native matrix/ table, you will have to use DAX. In Inforiver, you can achieve this formatting by simply selecting the cell and then clicking on the options in the formatting toolbar. In addition, Inforiver also supports many formatting functions that will enable you to create financial reports quickly.
Financial statements usually have account classifications or hierarchies indented for clarity. You may need to create a calculated column using DAX to achieve this, as shown in this example. With Inforiver, you can simply multi-select the rows that need to be indented and select the Indent icon from the toolbar. There are additional options to format fonts, styles and borders as well.

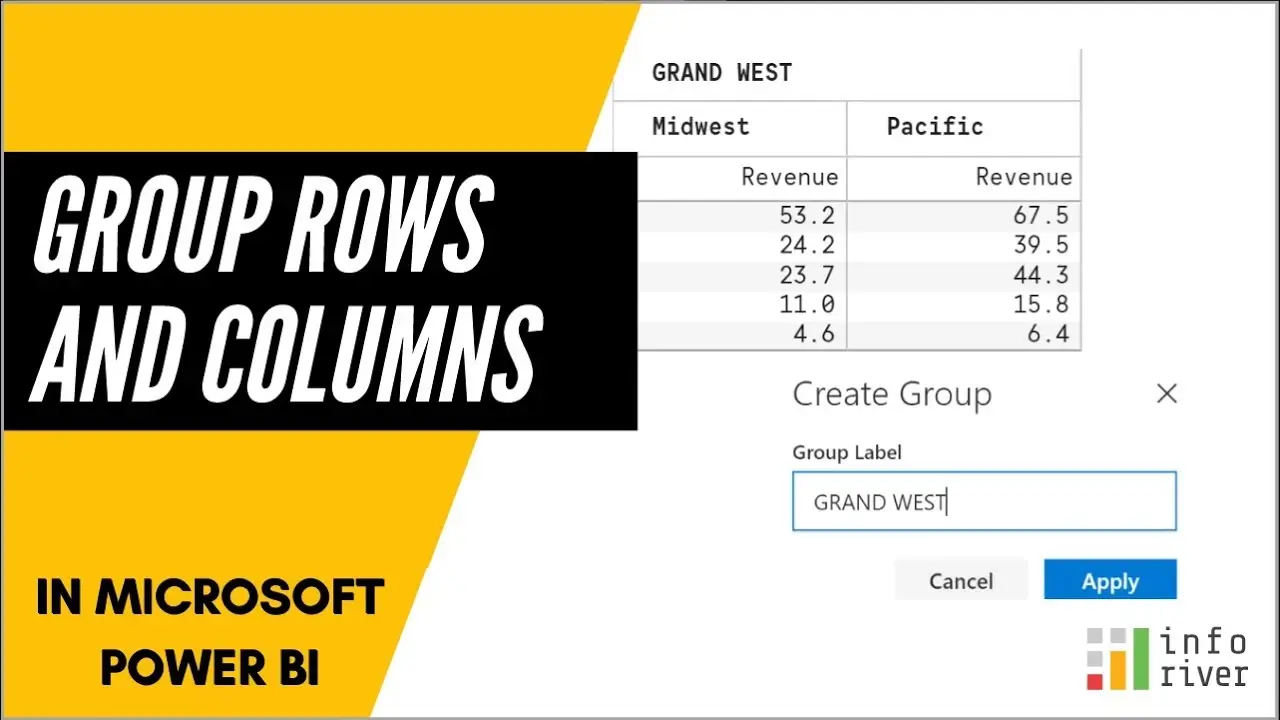
Usually, several lines of DAX scripts are necessary to create logical column header groups as explained in this blog. With Inforiver, you can achieve the same result in seconds by using the Group icon from the toolbar.
Another common feature in the P&L statements is to show all income/expenses as a % of Sales. We know that in Power BI matrix/ table we must write DAX to create a column with percentage values. And it gets more complicated when there are blank accounts. However, with Inforiver, you can perform vertical analysis in a single click. To accomplish this, select the 'Sales' row, and go to the Advanced tab and select Smart Analysis -- Contribution.
There are more challenges that you may encounter while building financial statements – some of which are outlined in this blog.
While we have highlighted only a few items above, there are many more capabilities that make Inforiver 20x faster for building P&L statements. Reports created using Inforiver can also be maintained easily for changes and updates.

Inforiver helps enterprises consolidate planning, reporting & analytics on a single platform (Power BI). The no-code, self-service award-winning platform has been recognized as the industry’s best and is adopted by many Fortune 100 firms.
Inforiver is a product of Lumel, the #1 Power BI AppSource Partner. The firm serves over 3,000 customers worldwide through its portfolio of products offered under the brands Inforiver, EDITable, ValQ, and xViz.


