Upcoming webinar on 'Inforiver Charts : The fastest way to deliver stories in Power BI', Aug 29th , Monday, 10.30 AM CST. Register Now
Upcoming webinar on 'Inforiver Charts : The fastest way to deliver stories in Power BI', Aug 29th , Monday, 10.30 AM CST. Register Now
Anyone who has attempted building P&L / income / financial reporting statements in Power BI knows how time-consuming the task can be. The reason is that the table or matrix visuals are designed to perform slice & dice analysis on the data, and not to deliver formatted statements. (This is not only the case with Power BI but also other software like Tableau or Qlik)
With that in mind, let us take a look at some of the challenges in building P&L statements using Microsoft Power BI.
Financial statements typically follow a specific order of accounts. When we utilize a Power BI table or matrix visual, it is very hard to achieve a desired sort order without workarounds such as having adding sort keys in the underlying table.
There is no support for ragged hierarchies in the native matrix visual. This causes empty row headers to show up in account statements.
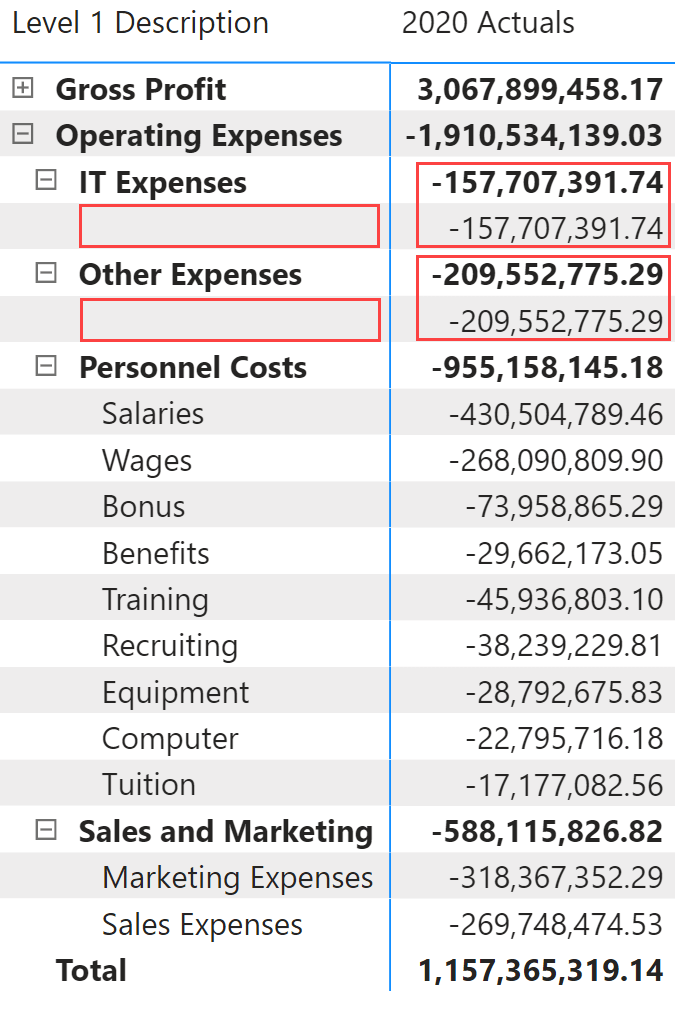
Note how ‘IT Expenses’ and ‘Other Expenses’ have a redundant record without a header. This is because other accounts like ‘Personnel Costs’ have child accounts, while they do not.
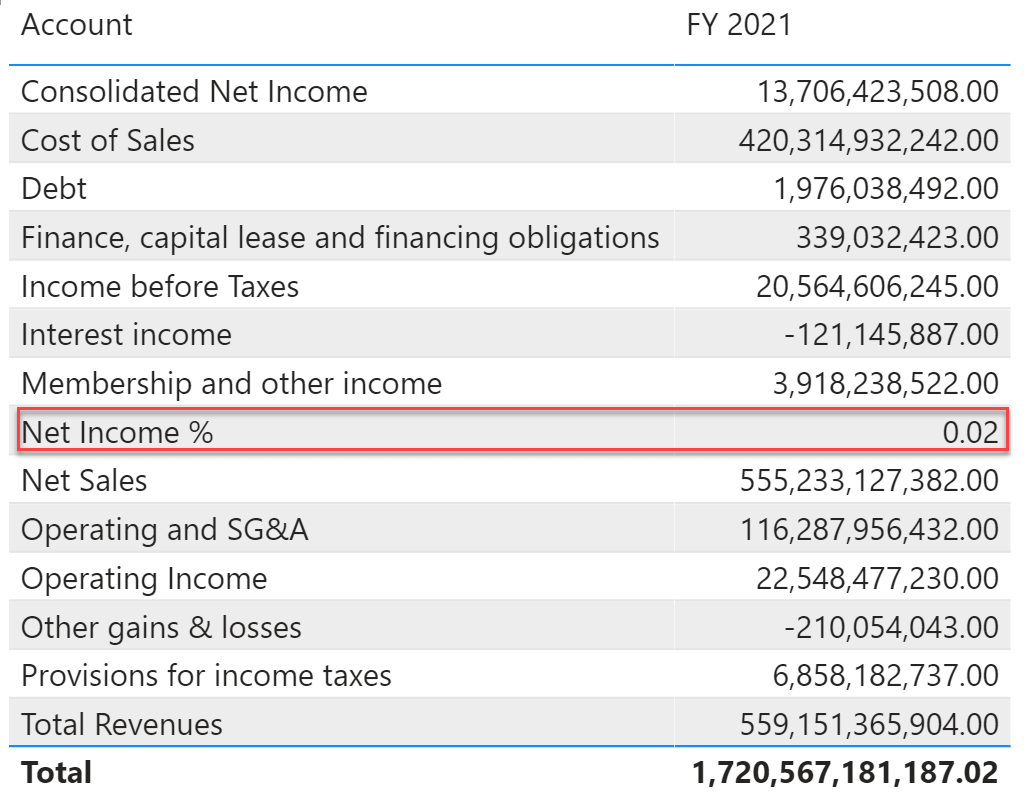
The ability to format key performance indicators of differing granularities or formatting in the same column is a challenge. In this sample income statement below, the Net Income % needs to be displayed in percentage (%) instead of a fraction.
Users often want to insert calculated rows or columns e.g., insert a row containing the total number of shares outstanding to an income statement and calculate earnings per share (EPS). Such operations require workarounds and require report developers to understand DAX.
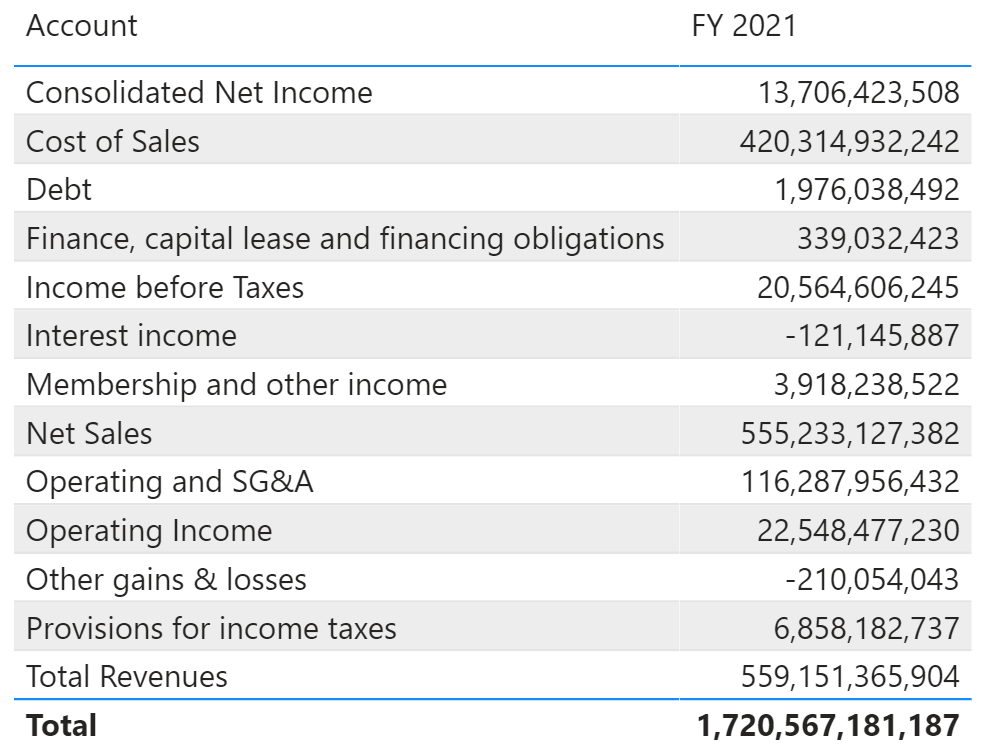
The data for P&L statements may have positive numbers for expense or deduction items, especially when the income and expense values come from different tables. However, updating the report with the negative sign operator serves two main purposes
(a) for performing aggregations, say for naturally aggregating revenue & expense accounts to calculate profit, or
(b) to display +/- signs in the table to indicate which accounts are added vs. deducted.
In the example below, the matrix adds ‘Returns and Adjustments’ and ‘Discounts’ to ‘Gross Sales’, thereby showing incorrect ‘Revenue’. Instead, it must subtract these from 'Gross Sales' as shown in the second column.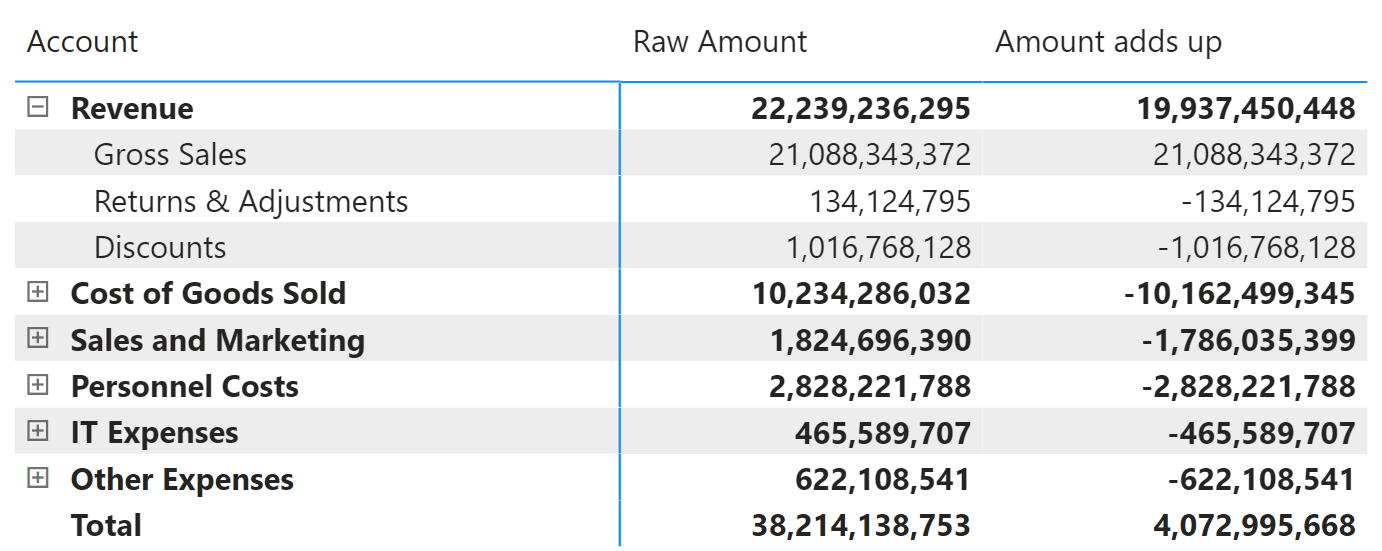
In other cases, finance analysts may want positive values to show up in reports. However, behind the scenes, they still need the negative operator (-) to be used for aggregation calculations. These are not natively supported out-of-the-box by visualization tools including Power BI.
Financial statements often require indentation of account names, and special formatting of account names, values, column headers, totals & subtotals. Such formats may include highlighting, bordering, adding prefix/suffix, number formatting, and more. The native matrix does not support these operations and it needs extensive workarounds.
See a sample formatted statement below – replicating this is a lot of work in Power BI, and even then, a grouping of column headers (e.g. ‘Three Months Ended January 31’) is extremely difficult.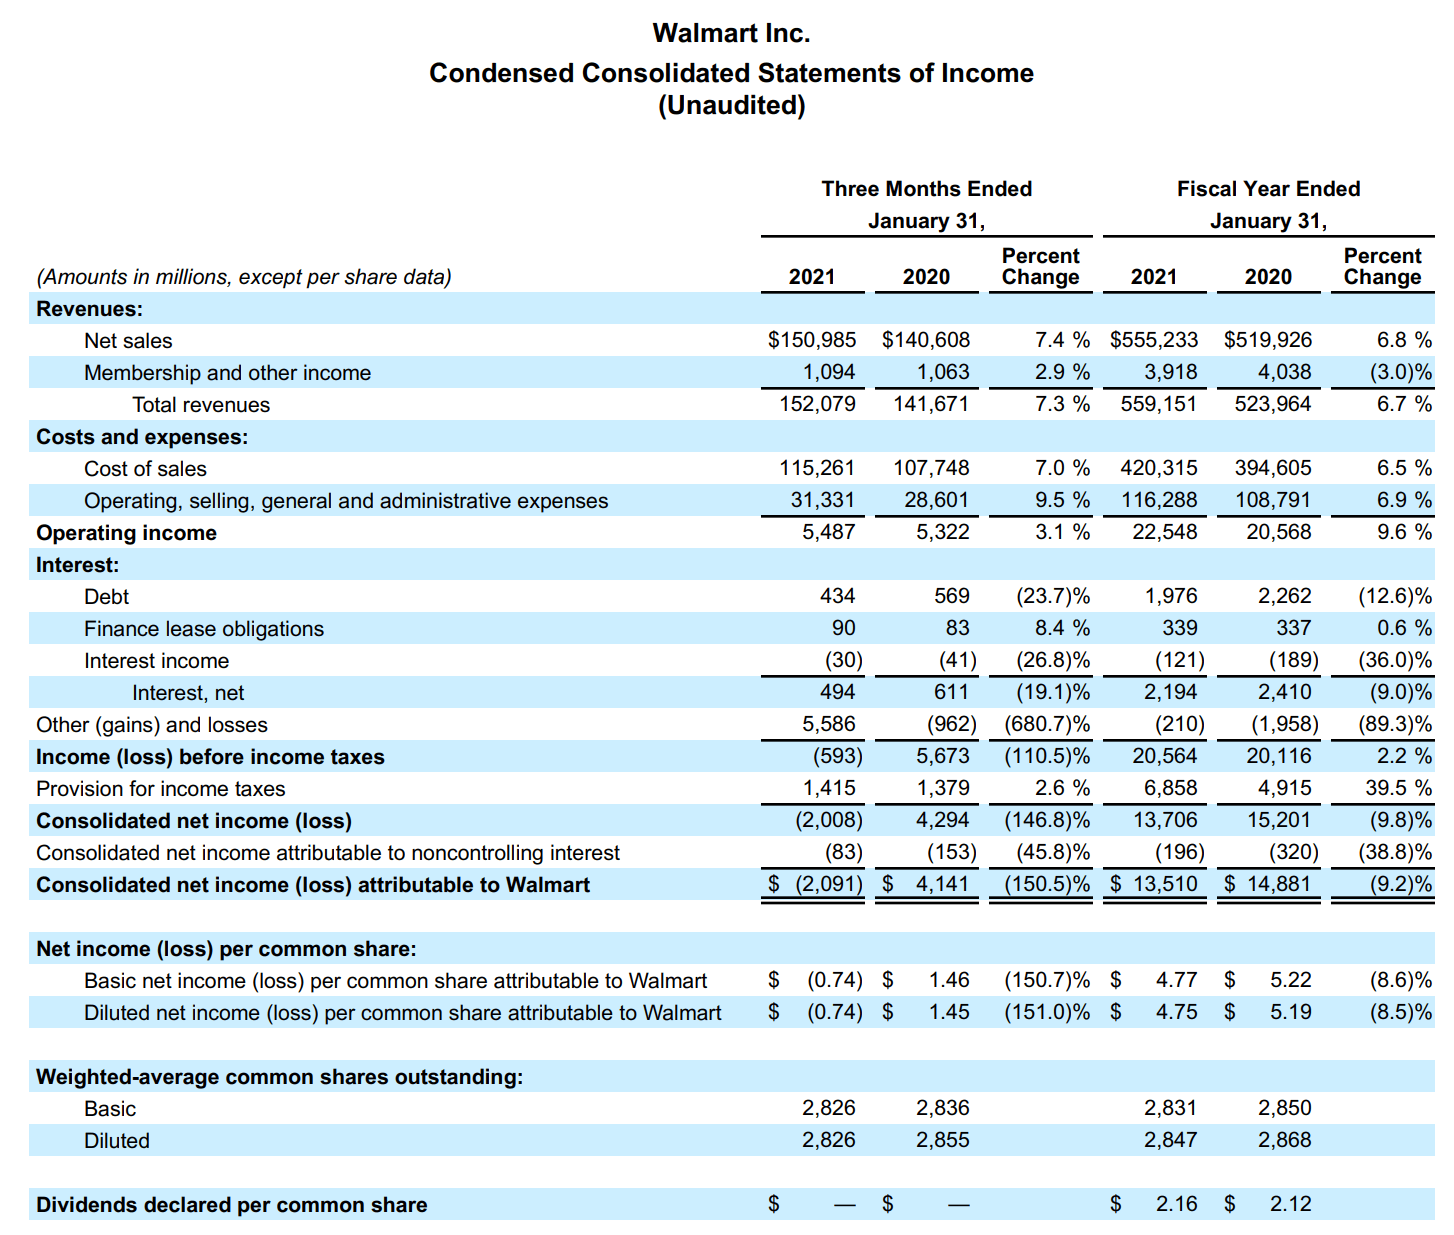
Income statement for Walmart (source: walmart.com)
In an accounting statement, each line-item representing a GL account has its own benchmark. As a result, the conditional formatting must be typically defined at the row-level (i.e., account-level). However conditional formatting provided by Power BI applies to the whole column/measure by default. This too requires workarounds using DAX.
Ability to create subtotal layouts for rows & column hierarchies are also challenging. E.g., while using a lot of hierarchies, it is trickier to trace what the subtotals are for.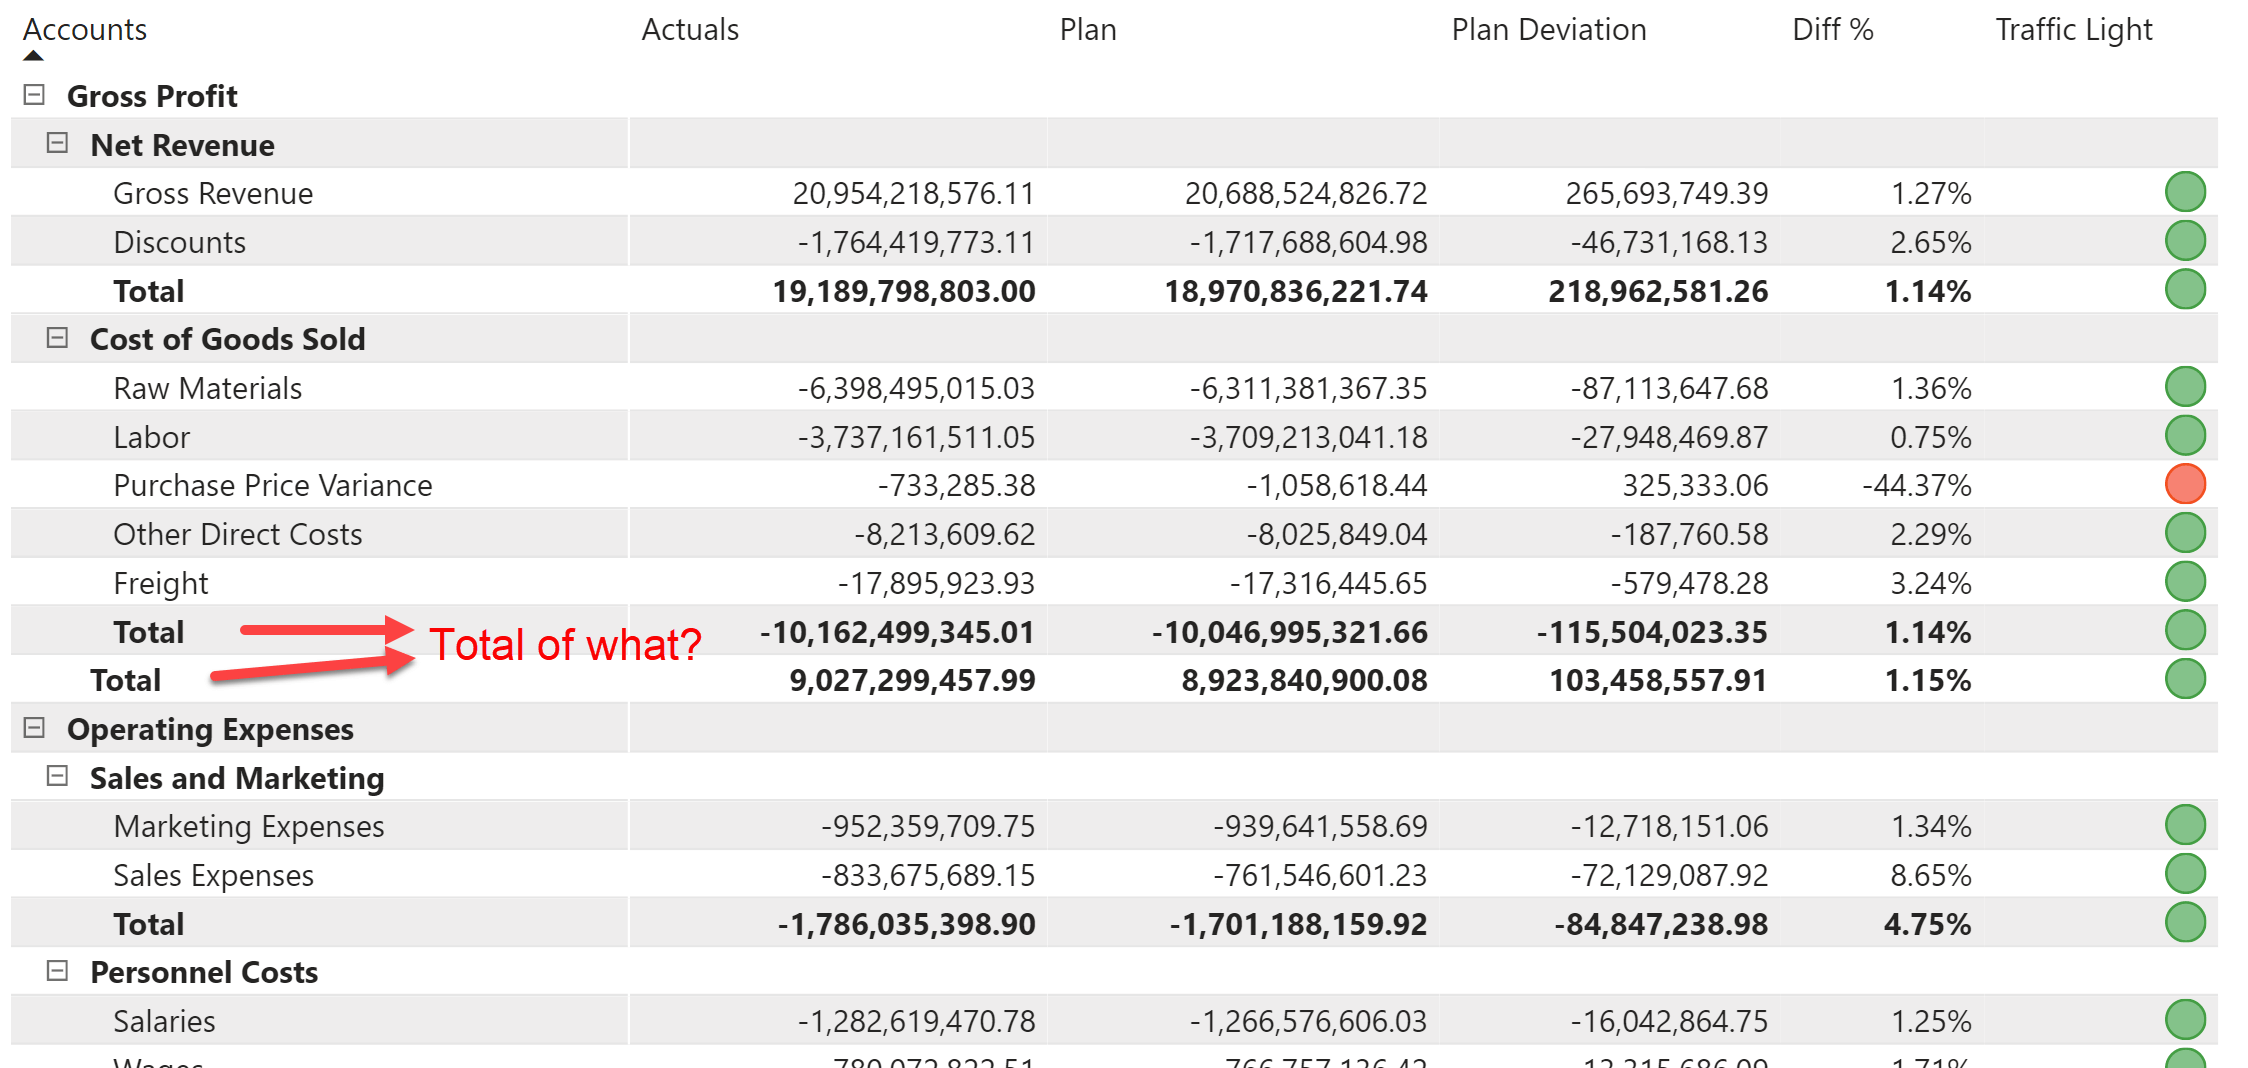
The above are just some of the challenges. Overall, the average user with limited experience in DAX will find building formatted statements in Power BI quite daunting. And despite all the workarounds and tips-and-tricks, the final statement often looks like a compromise and not the perfect solution.
***
Using standard visuals to build financial statements is like fitting a square peg in a round hole. The objectives of the two are different – table & matrix visuals are intended for slice & dice data analysis, while statements need a predetermined sequence of accounts & values with specific formatting & row-level calculations.
Inforiver helps addresses all the above challenges and build formatted financial statements on-the-fly without using DAX. The product allows you to deliver formatted reports in a matter of minutes, instead of days, thereby driving productivity. What’s more – Inforiver is also great in standard slice & dice analysis and can support row & column-centric pivot analysis.
Check out some of the examples of formatted statements delivered by Inforiver.
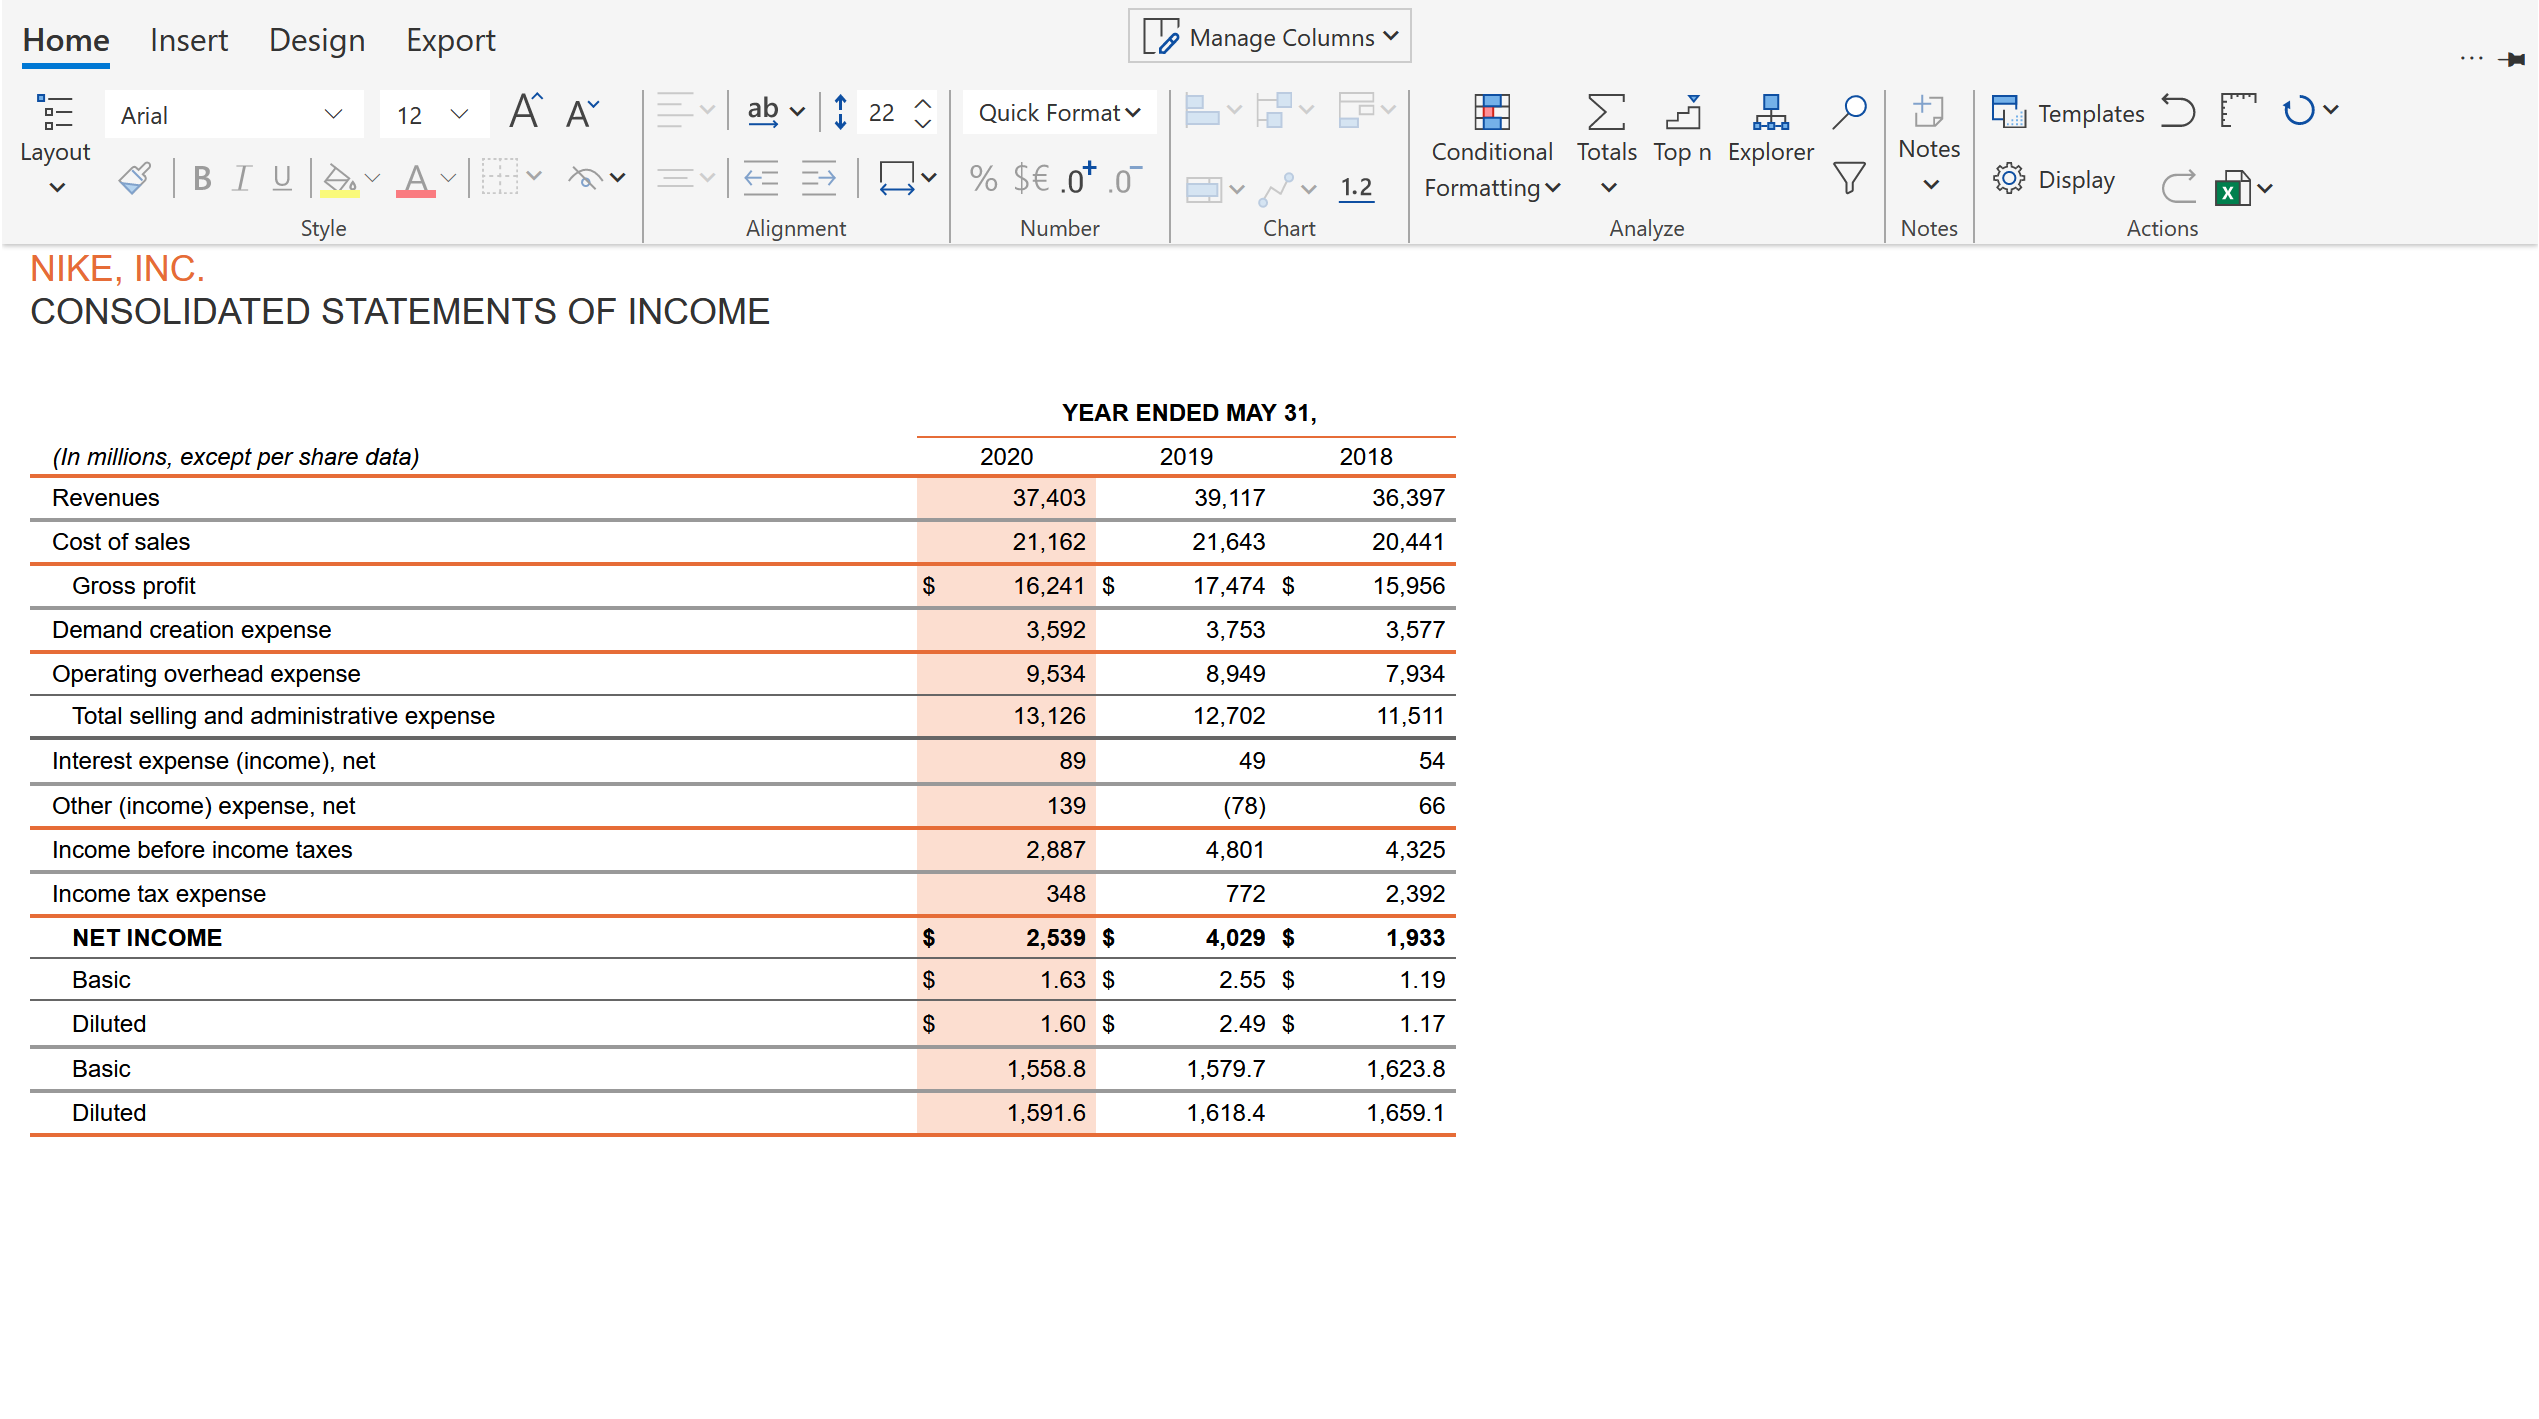
In the first example, we have a multi-line header, with indented and formatted line items.
Below is an example with column formatting and selective line items prefixed with a ‘$’.
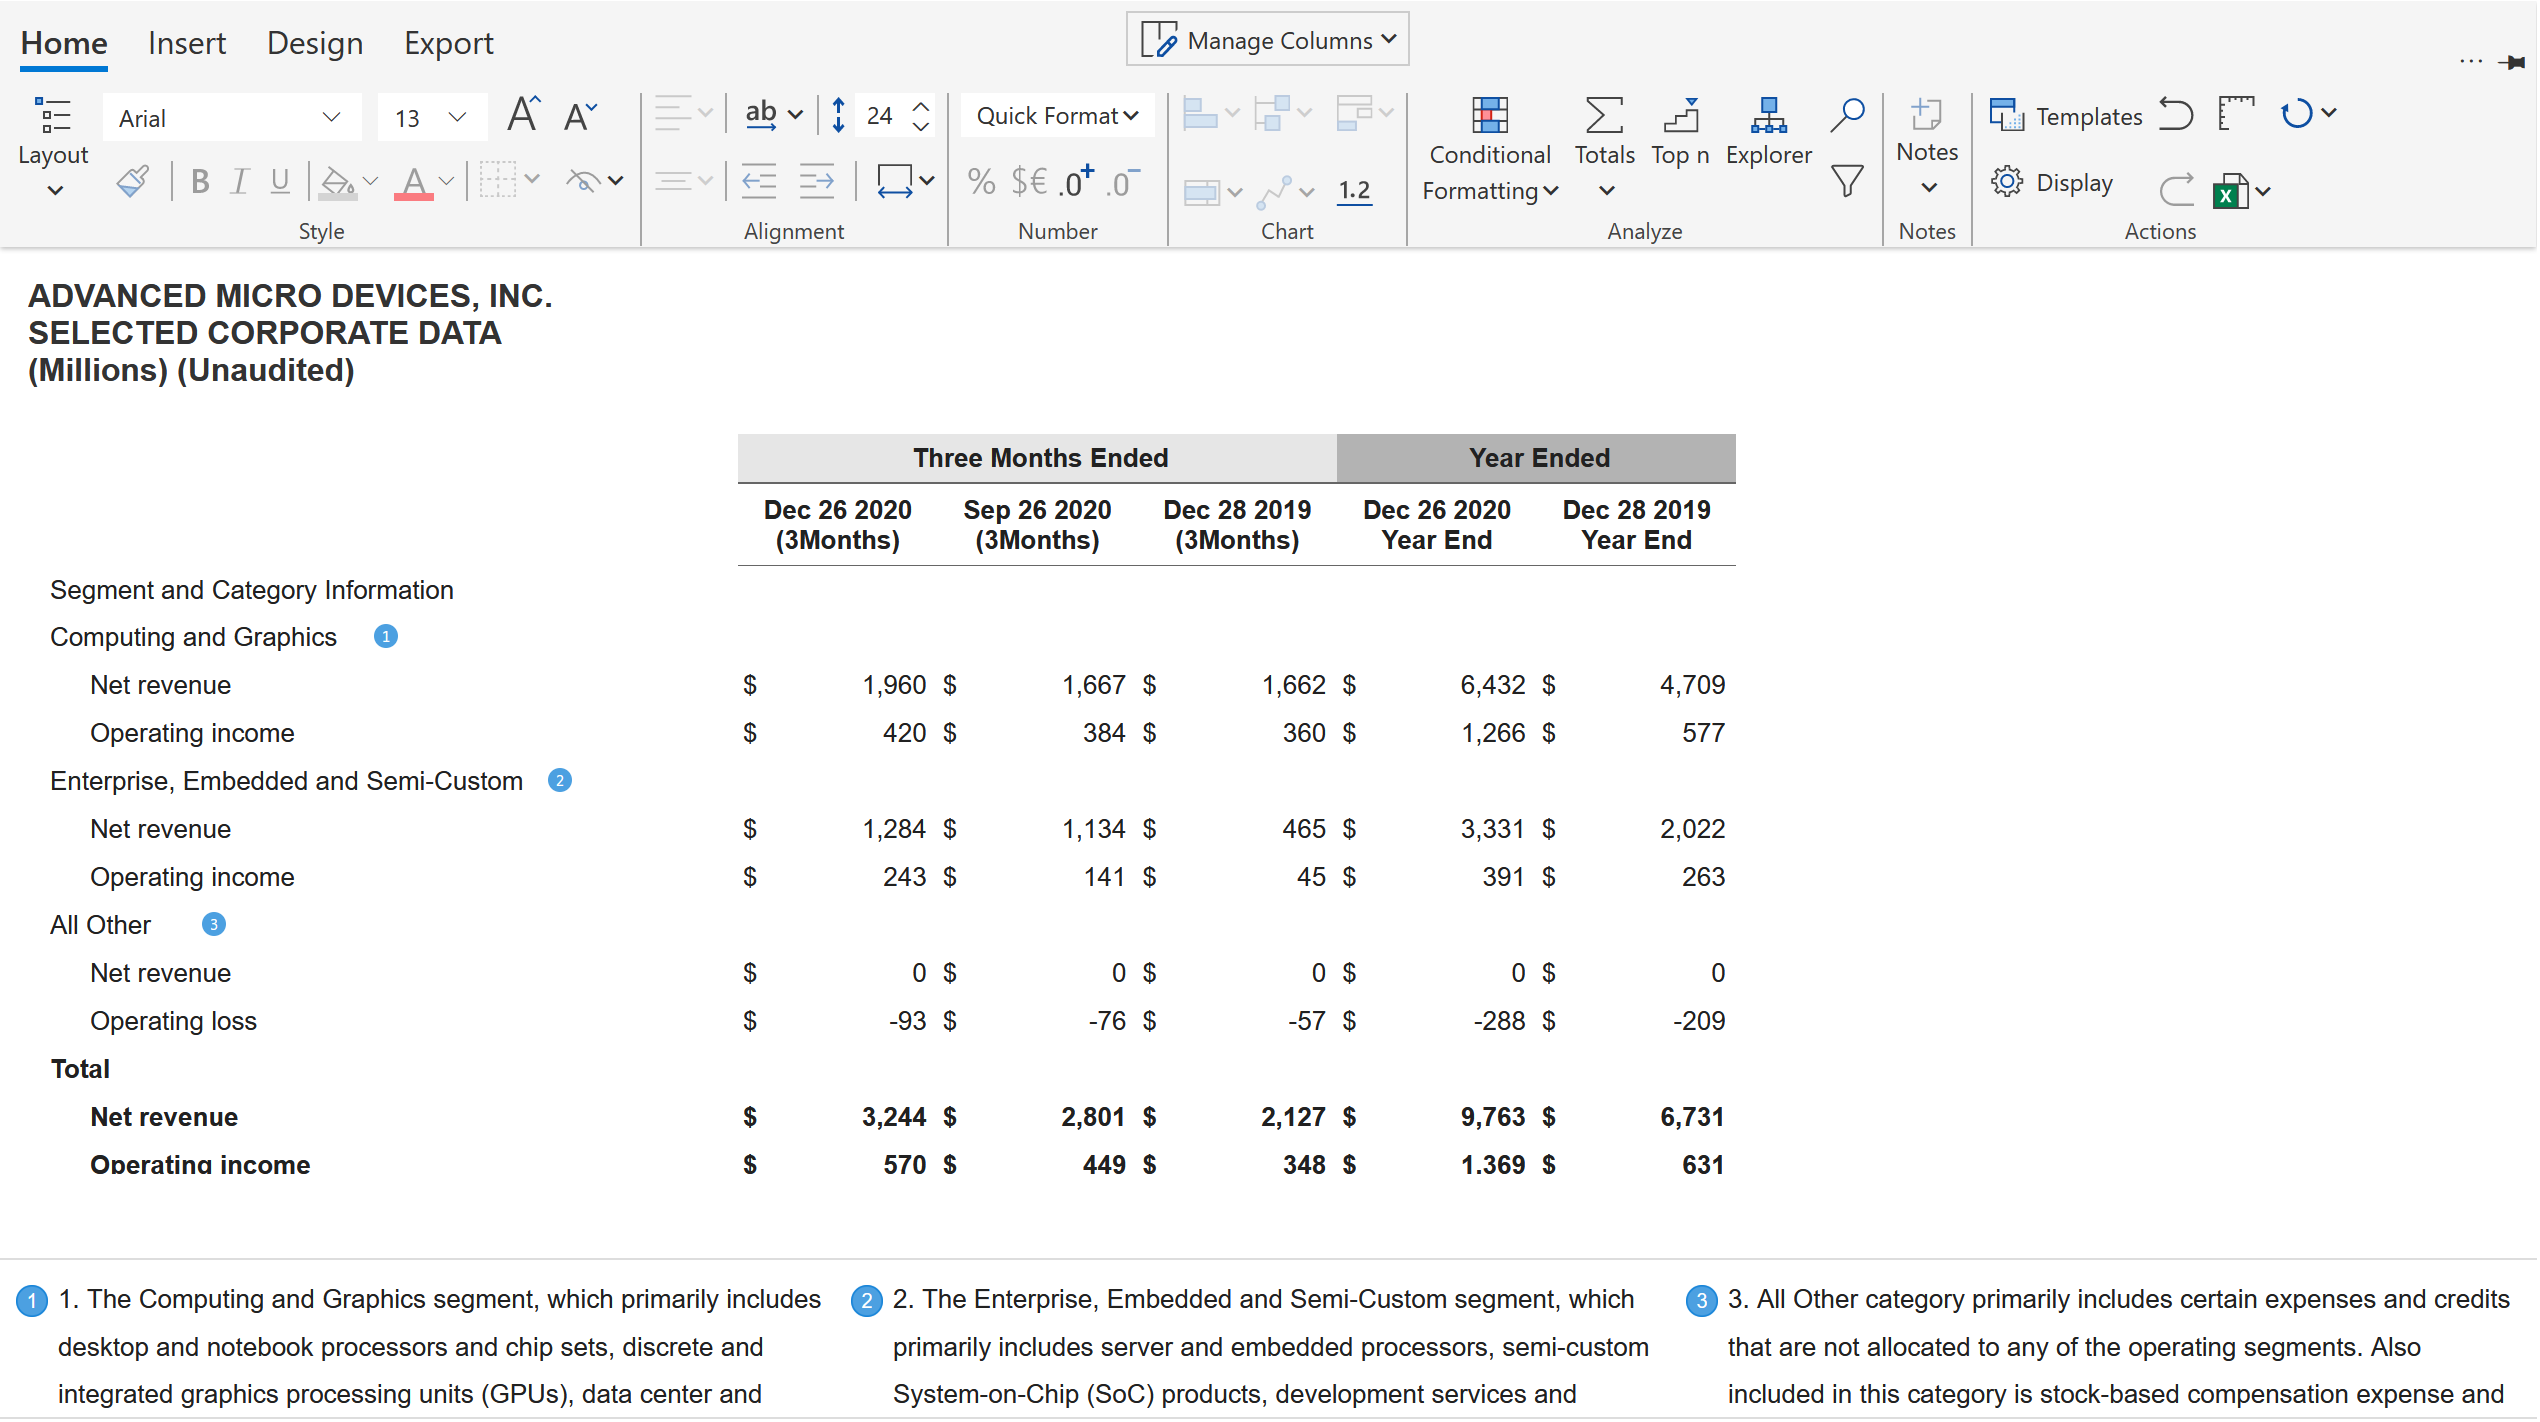
Here is an example of a statement with comments/annotations. Check out the grouped column headers (e.g., ‘Three Months Ended’).
Here is one final example with multi-line column headers.
In the subsequent blog, we will cover how to build P&L statements from scratch in Power BI in less than five minutes.

Inforiver helps enterprises consolidate planning, reporting & analytics on a single platform (Power BI). The no-code, self-service award-winning platform has been recognized as the industry’s best and is adopted by many Fortune 100 firms.
Inforiver is a product of Lumel, the #1 Power BI AppSource Partner. The firm serves over 3,000 customers worldwide through its portfolio of products offered under the brands Inforiver, EDITable, ValQ, and xViz.