Upcoming webinar on 'Inforiver Charts : The fastest way to deliver stories in Power BI', Aug 29th , Monday, 10.30 AM CST. Register Now
Upcoming webinar on 'Inforiver Charts : The fastest way to deliver stories in Power BI', Aug 29th , Monday, 10.30 AM CST. Register Now
Almost every professional working in sales, operations, or finance has used a monthly tracker in Excel with categories in rows and months or weeks across columns. Most times, this template is used to compare actual performance to projections.
We are going to see how you can create such a template in Power BI, with the ability to edit data in cells just as you can do with Excel.
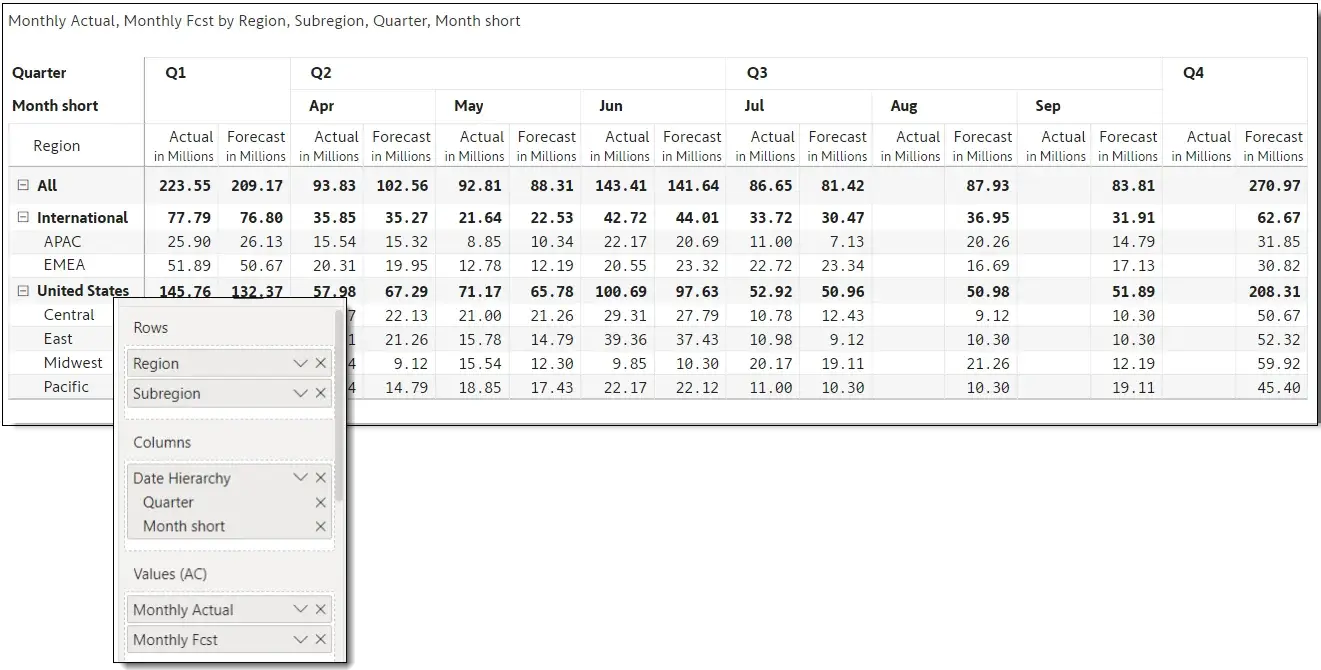
Let us take ACME Inc. for example. It tracks sales forecast & actual data for 2023. We are in July. As a result, actual data is unavailable for future periods starting in August. Note that Q1 is collapsed and Q2 is expanded to facilitate any comparisons with the prior month (June)

Just like in Excel, Inforiver can format columns, rows, and cells based on our needs.
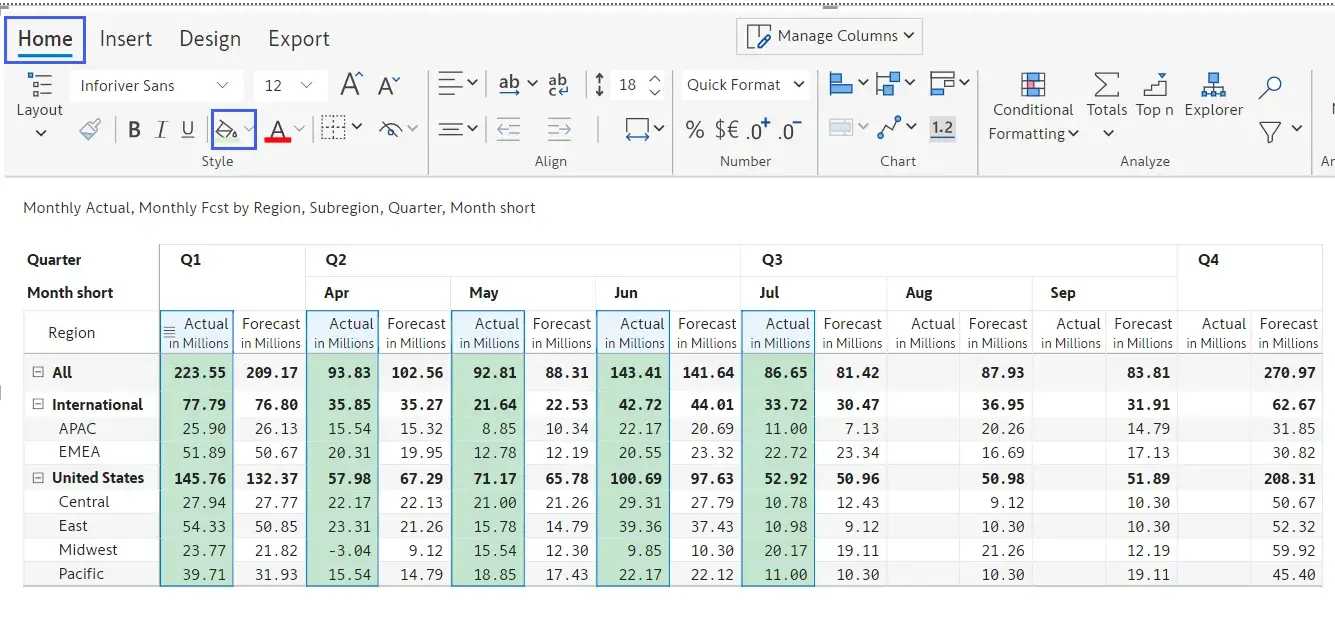
Let us format our monthly tracker. We will highlight actuals for the past months in green.

For the current month July (which is yet to elapse), we can choose a different color, say blue. This will help us identify the active month. Similarly, the forecast columns can be highlighted in grey.

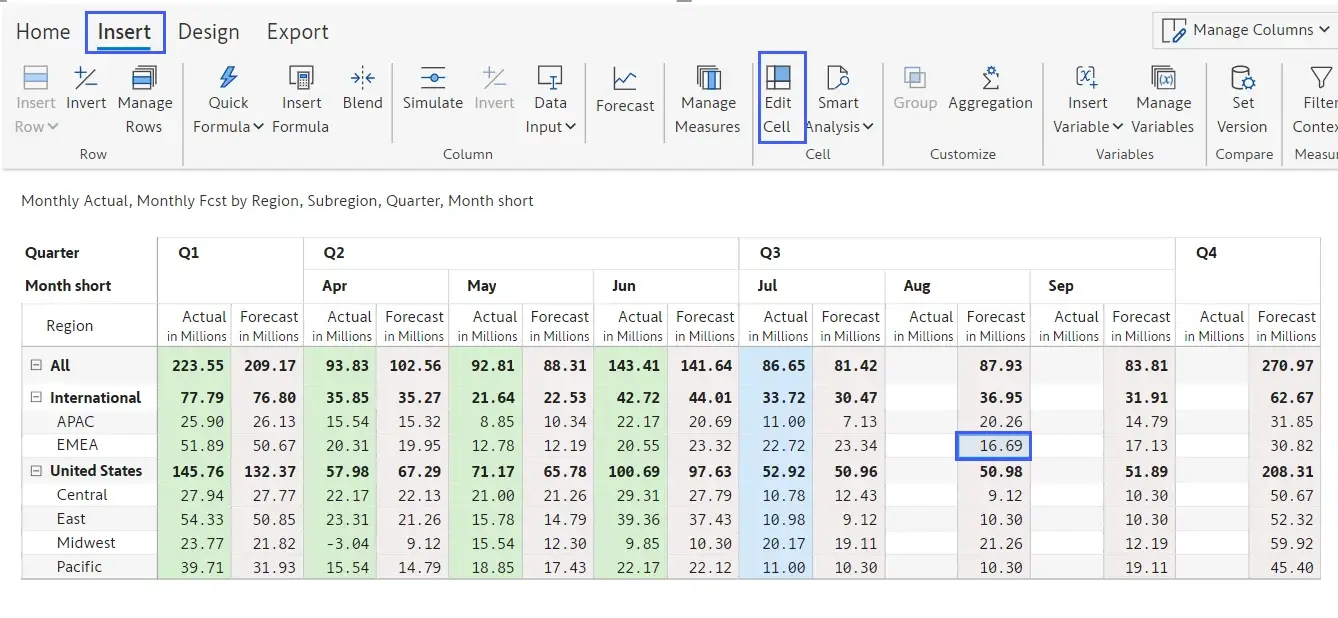
Just as with Excel, you can double-click any cell and start editing it. (The other option to edit is to select the cell and use the ‘Edit cell’ item from the toolbar)

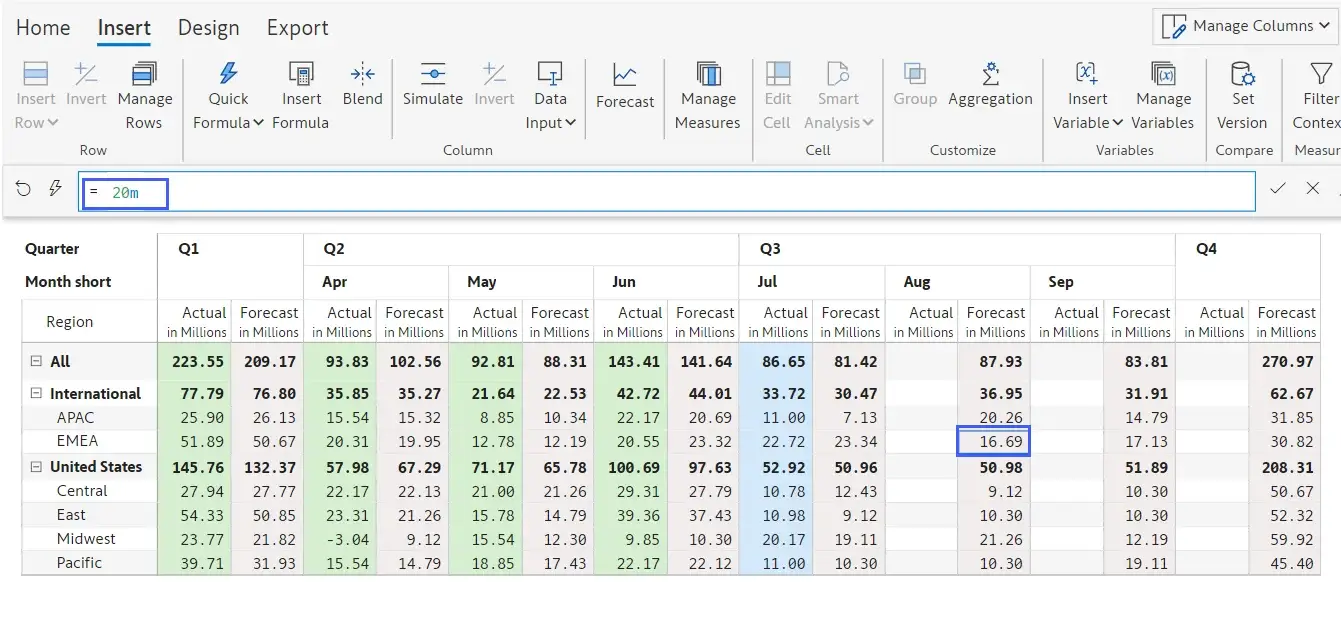
A formula bar opens when we double-click a cell. You can overwrite values directly in the cell, or in the formula bar that appears above the table. Here we are overwriting the existing value (16.69M) with 20M in the formula bar.

Press Enter, and the cell value automatically gets updated. In addition, the change automatically rolls up to the subtotals and grand total.

The flexible formatting and data editing capabilities make maintaining such monthly trackers in Power BI a breeze.
********
In addition to the above, you can perform several actions on the monthly tracker (which we have not covered here). These include:
Learn more about Forecasting in Power BI here.
Inforiver helps enterprises consolidate planning, reporting & analytics on a single platform (Power BI). The no-code, self-service award-winning platform has been recognized as the industry’s best and is adopted by many Fortune 100 firms.
Inforiver is a product of Lumel, the #1 Power BI AppSource Partner. The firm serves over 3,000 customers worldwide through its portfolio of products offered under the brands Inforiver, EDITable, ValQ, and xViz.