Inforiver

Upcoming webinar on 'Inforiver Charts : The fastest way to deliver stories in Power BI', Aug 29th , Monday, 10.30 AM CST.    Register Now
Radar Polar Chart

Inforiver Analytics+ Radar/Polar Chart (also known as Radial, Spider, or Web Chart) is perfect for displaying multivariate data on a common axis. It’s ideal for comparing qualitative data in a visually appealing way. With customization options for small multiples, series customization, scaling, and axis adjustments, you can create high-quality visualizations effortlessly.

Inforiver Analytics+ delivers the best of both worlds – spreadsheets & standardized BI reporting and visualizations – through a low-code / no-code architecture that drives excellent authoring, consumer & collaboration experiences for unrivaled analysis, productivity and ROI.
Download PBIX
iframe preview
View interactive content

Key features

2 in 1 chart with polar chart

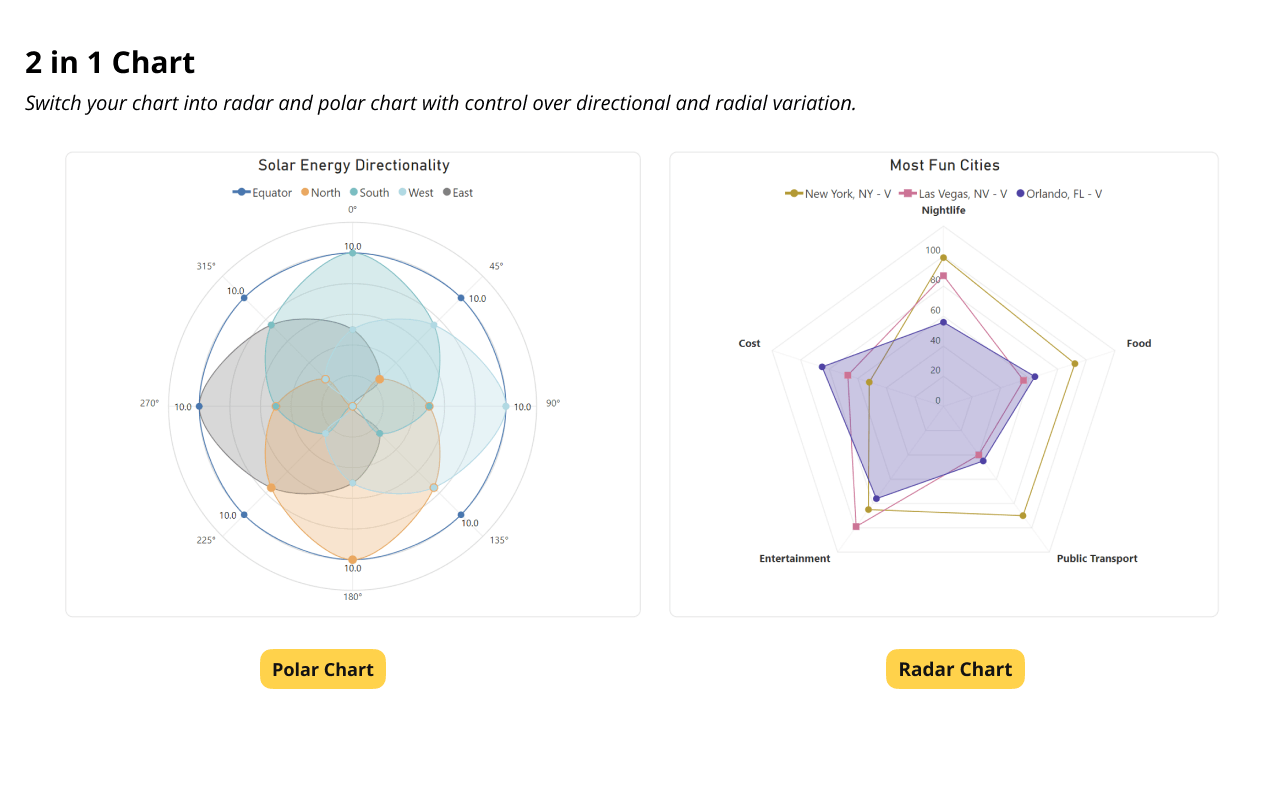
2 in 1 chart with Polar chart

Display data with directional and magnitude variation.
Individual series type

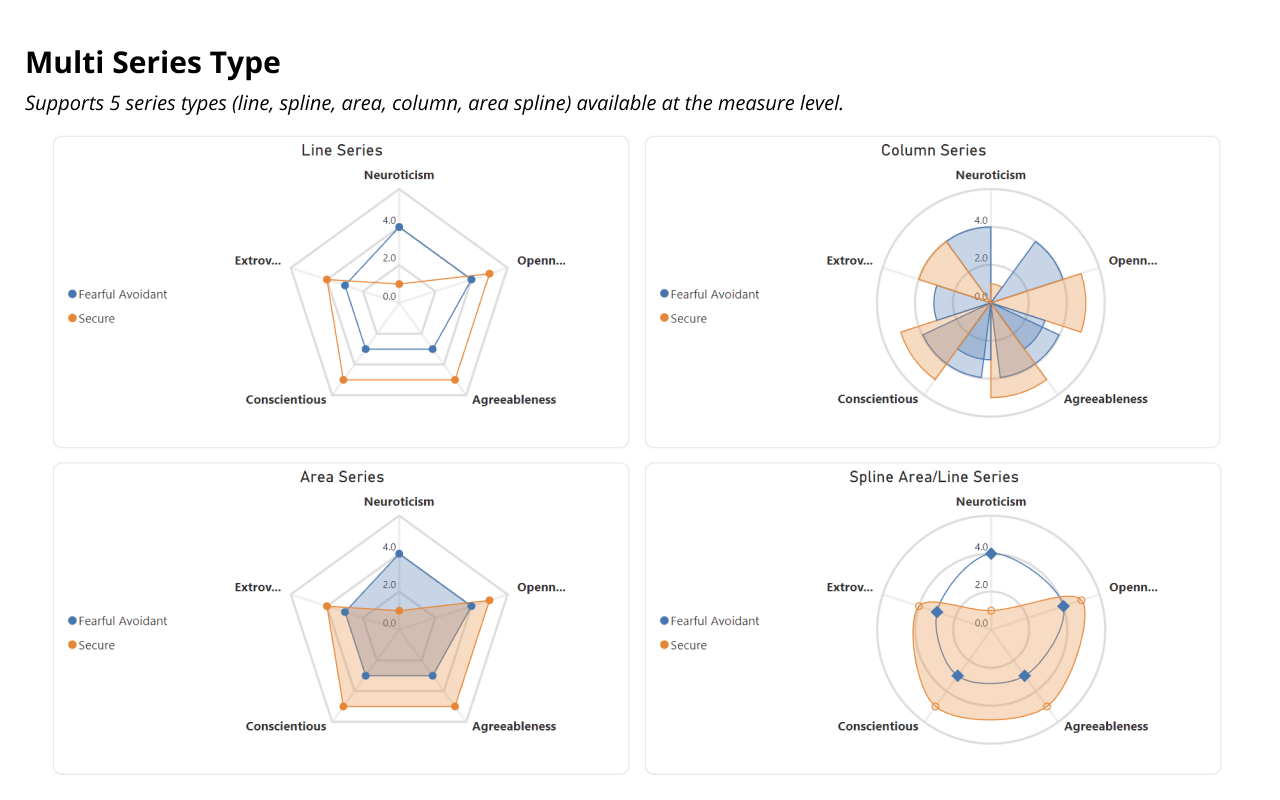
Individual Series Type

Supports 5 series types (line, spline, area, column, area spline) available at the measure level.
Conditional formatting

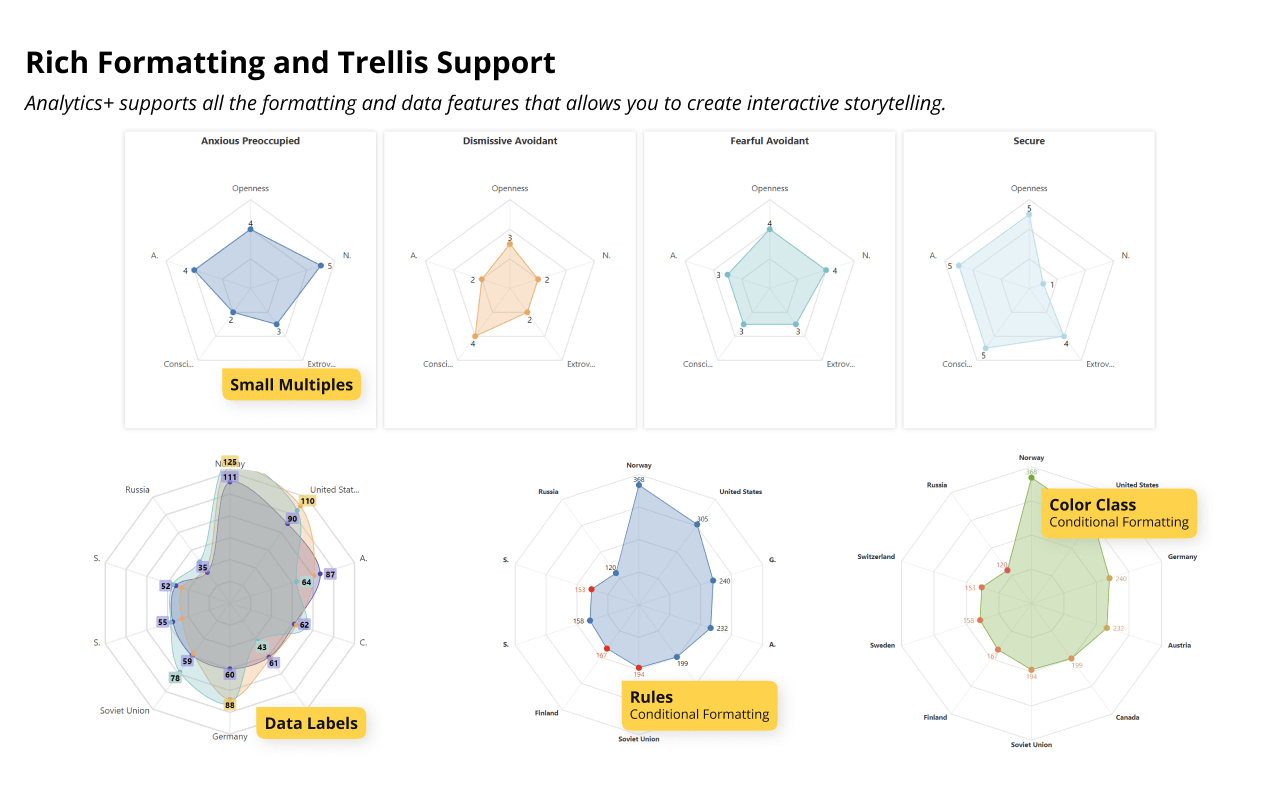
Conditional Formatting

Highlight data points by creating rules or color scale based on custom conditions.
Formatting options

Formatting Option

Analytics+ allows you to customize number formatting, axis scale type and pixel-perfect export to PDF.
Legend enhancement

Legend Enhancement

Customize legend interactions (highlight, include, exclude) and styles with 5 different options covers background, icon and total display.
Small multiples

Small Multiples

Experience advanced trellis charts with multiple hierarchy, grid layouts, axis and more. Spilt categories into measure to perform comparative analysis.
Data labels

Data Labels

Offers all the support to adjust label type, position, padding and formatting for readability.
Annotations

Annotation

Add dynamic annotations for a PowerPoint like storytelling experience.

Gallery

Show More
Show Less

Pricing

Get Radar/Polar chart Family

Billed at

$9,995

/year
Buy radar polar chart family for your entire organization;
Buy now

Get the entire Analytics+ suite

Starts at

$3

/user/month
Buy all the 100+ Charts, KPI cards and Tables (includes bullet charts);
Buy now

Get Inforiver brochure

Maximize your business potential with Inforiver's paginated reporting, data entry, planning & budgeting capabilities
Download now
Inforiver

Inforiver helps enterprises consolidate planning, reporting & analytics on a single platform (Power BI). The no-code, self-service award-winning platform has been recognized as the industry’s best and is adopted by many Fortune 100 firms.

Inforiver is a product of Lumel, the #1 Power BI AppSource Partner. The firm serves over 3,000 customers worldwide through its portfolio of products offered under the brands Inforiver, EDITable, ValQ, and xViz.

linkedin facebook pinterest youtube rss twitter instagram facebook-blank rss-blank linkedin-blank pinterest youtube twitter instagram