
Upcoming webinar on 'Inforiver Charts : The fastest way to deliver stories in Power BI', Aug 29th , Monday, 10.30 AM CST. Register Now
Upcoming webinar on 'Inforiver Charts : The fastest way to deliver stories in Power BI', Aug 29th , Monday, 10.30 AM CST. Register Now
An effective supply chain management system ensures that products are delivered to customers on time and in the right condition. This results in higher customer satisfaction levels, which can lead to increased customer loyalty and repeat business.
A supply chain analysis dashboard can help improve customer satisfaction in several ways:
1. Real-time tracking of shipments: A supply chain analysis dashboard can provide real-time information about the status of shipments. This helps businesses proactively communicate with customers about any delays or issues, which can reduce frustration and increase transparency.
2. Faster order processing: Supply chain analysis can help identify bottlenecks in the order processing system. By addressing these issues, businesses can reduce order processing times, which can lead to faster delivery times and higher customer satisfaction.
3. Improved inventory management: By analyzing supply chain data, businesses can optimize inventory levels to ensure that products are available when customers need them. This can help reduce stockouts and backorders, which can lead to higher customer satisfaction.
4. Better quality control: Supply chain analysis can help identify quality issues in the supply chain. By addressing these issues, businesses can ensure that products meet customer expectations, which can lead to higher customer satisfaction.
Some of the terminologies and key metrics used in the dashboard are explained below.
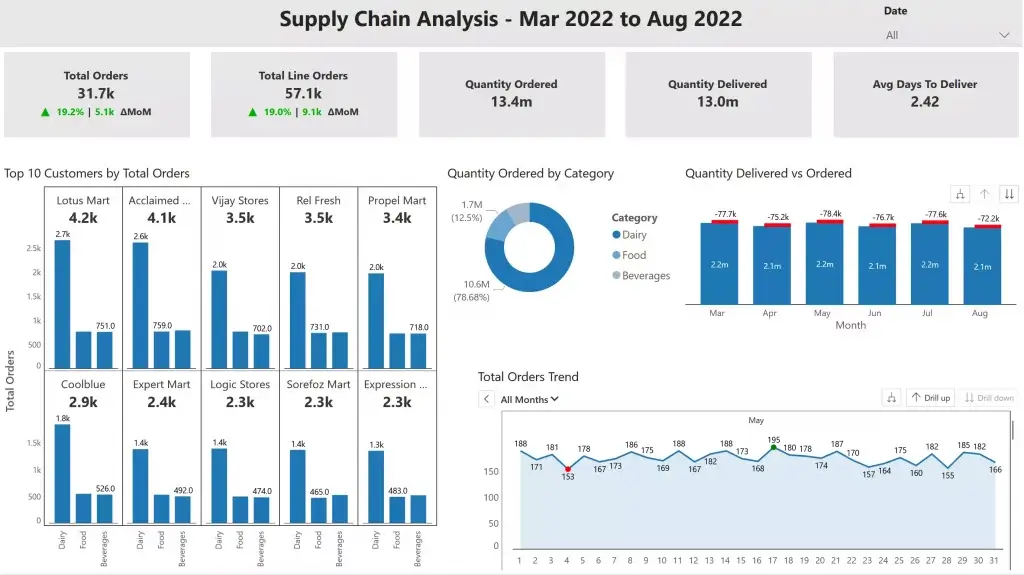
An order typically refers to a request by a customer to purchase a specific product or service from a supplier. A line, on the other hand, refers to a specific item on an order. An order can contain one or more lines, depending on the number of products the customer wants to purchase.
By monitoring orders and lines, businesses can ensure that they are meeting customer demands and managing their inventory effectively. They can also use this information to identify opportunities for cost savings and process improvements.
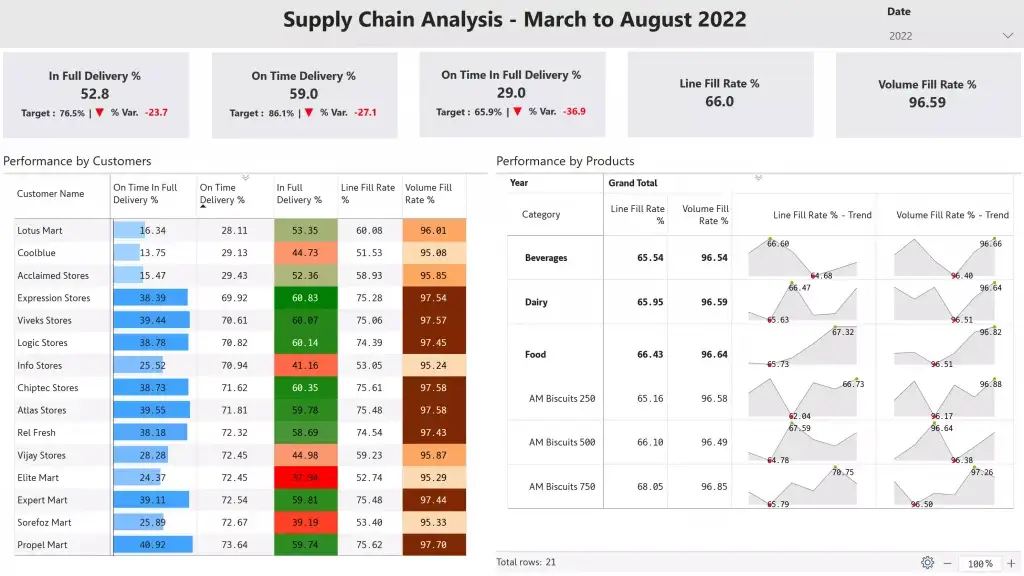
Line fill rate and volume fill rate are two commonly used performance metrics in supply chain management that help measure the efficiency and effectiveness of the order fulfilment process.
Line fill rate is a metric that measures the percentage of customer order lines that are fulfilled completely without any backorders or stockouts.
Volume fill rate, on the other hand, is a metric that measures the percentage of customer order volume that is fulfilled completely without any backorders or stockouts.
On-time delivery % is a measure of the percentage of orders or shipments that are delivered to customers on or before the promised delivery date. A high on-time delivery % indicates that the company is meeting its customers' expectations and delivering products in a timely and efficient manner.
In-full delivery % is a measure of the percentage of orders or shipments that are delivered to customers complete and without any missing items or damage.
A low in-full delivery % can result in customer dissatisfaction, lost sales, and decreased revenue. Therefore, it is crucial for companies to monitor their in-full delivery % and continuously improve their delivery processes to ensure accurate and efficient delivery.
On-time in-full (OTIF) delivery % is used to measure the percentage of orders or shipments that are delivered to customers on or before the promised delivery date and complete without any missing items or damage.
****
Here are some of the key features of Inforiver Analytics+* and Matrix used in the dashboard:
To view the interactive dashboard, visit page.
*Inforiver Charts has been renamed to Inforiver Analytics+, and today it is a 3-in-1 visual for dashboards and storyboards that offers 50+ charts, cards, and tables.

Inforiver helps enterprises consolidate planning, reporting & analytics on a single platform (Power BI). The no-code, self-service award-winning platform has been recognized as the industry’s best and is adopted by many Fortune 100 firms.
Inforiver is a product of Lumel, the #1 Power BI AppSource Partner. The firm serves over 3,000 customers worldwide through its portfolio of products offered under the brands Inforiver, EDITable, ValQ, and xViz.
 Learn how to elevate FP&A with data visualization best practices for planning, budgeting, and forecasting in Power BI.