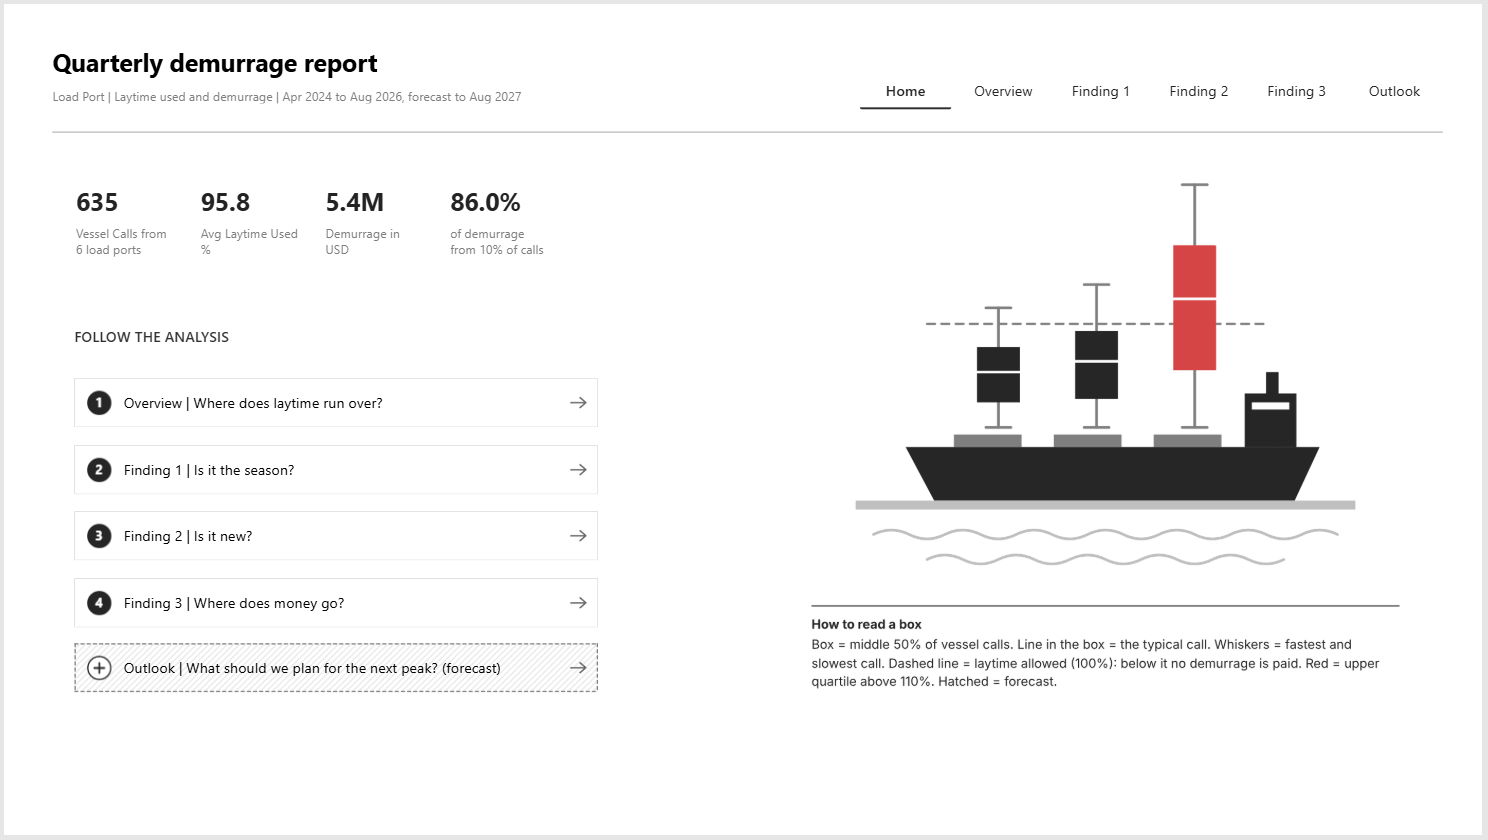
This Quarterly Demurrage Report showcases box and whisker plots built using Inforiver Analytics+. It tracks 635 vessel calls across 6 load ports from April 2024 to August 2026, showing the full spread of laytime used at each port, the demurrage it costs, and a forecast for the next peak season. Illustrative data, real port names.
The report acts as a Port Performance Scorecard in Power BI, combining box plots, small multiples and conditional formatting in an IBCS-compliant layout. Five pre-calculated DAX measures draw each box, and a single rule turns any port red when its upper quartile runs past 110% of laytime. Overlapped box plots compare this season with last season, and forecast box plots show the expected spread for 2027 in hatched IBCS scenario notation.
Designed as a guided analytics report, it follows one question per page: Where does laytime run over? Is it the season? Is it new? Where does the money go? Each page pairs the chart with a summary table, numbered comments and an action, so chartering, claims and trading teams can see what is driving the bill, not only how big it is.
Download the report and explore box plots, overlapped and forecast box plots, and IBCS storytelling with Inforiver Analytics+.