Upcoming webinar on 'Inforiver Charts : The fastest way to deliver stories in Power BI', Aug 29th , Monday, 10.30 AM CST. Register Now
Upcoming webinar on 'Inforiver Charts : The fastest way to deliver stories in Power BI', Aug 29th , Monday, 10.30 AM CST. Register Now
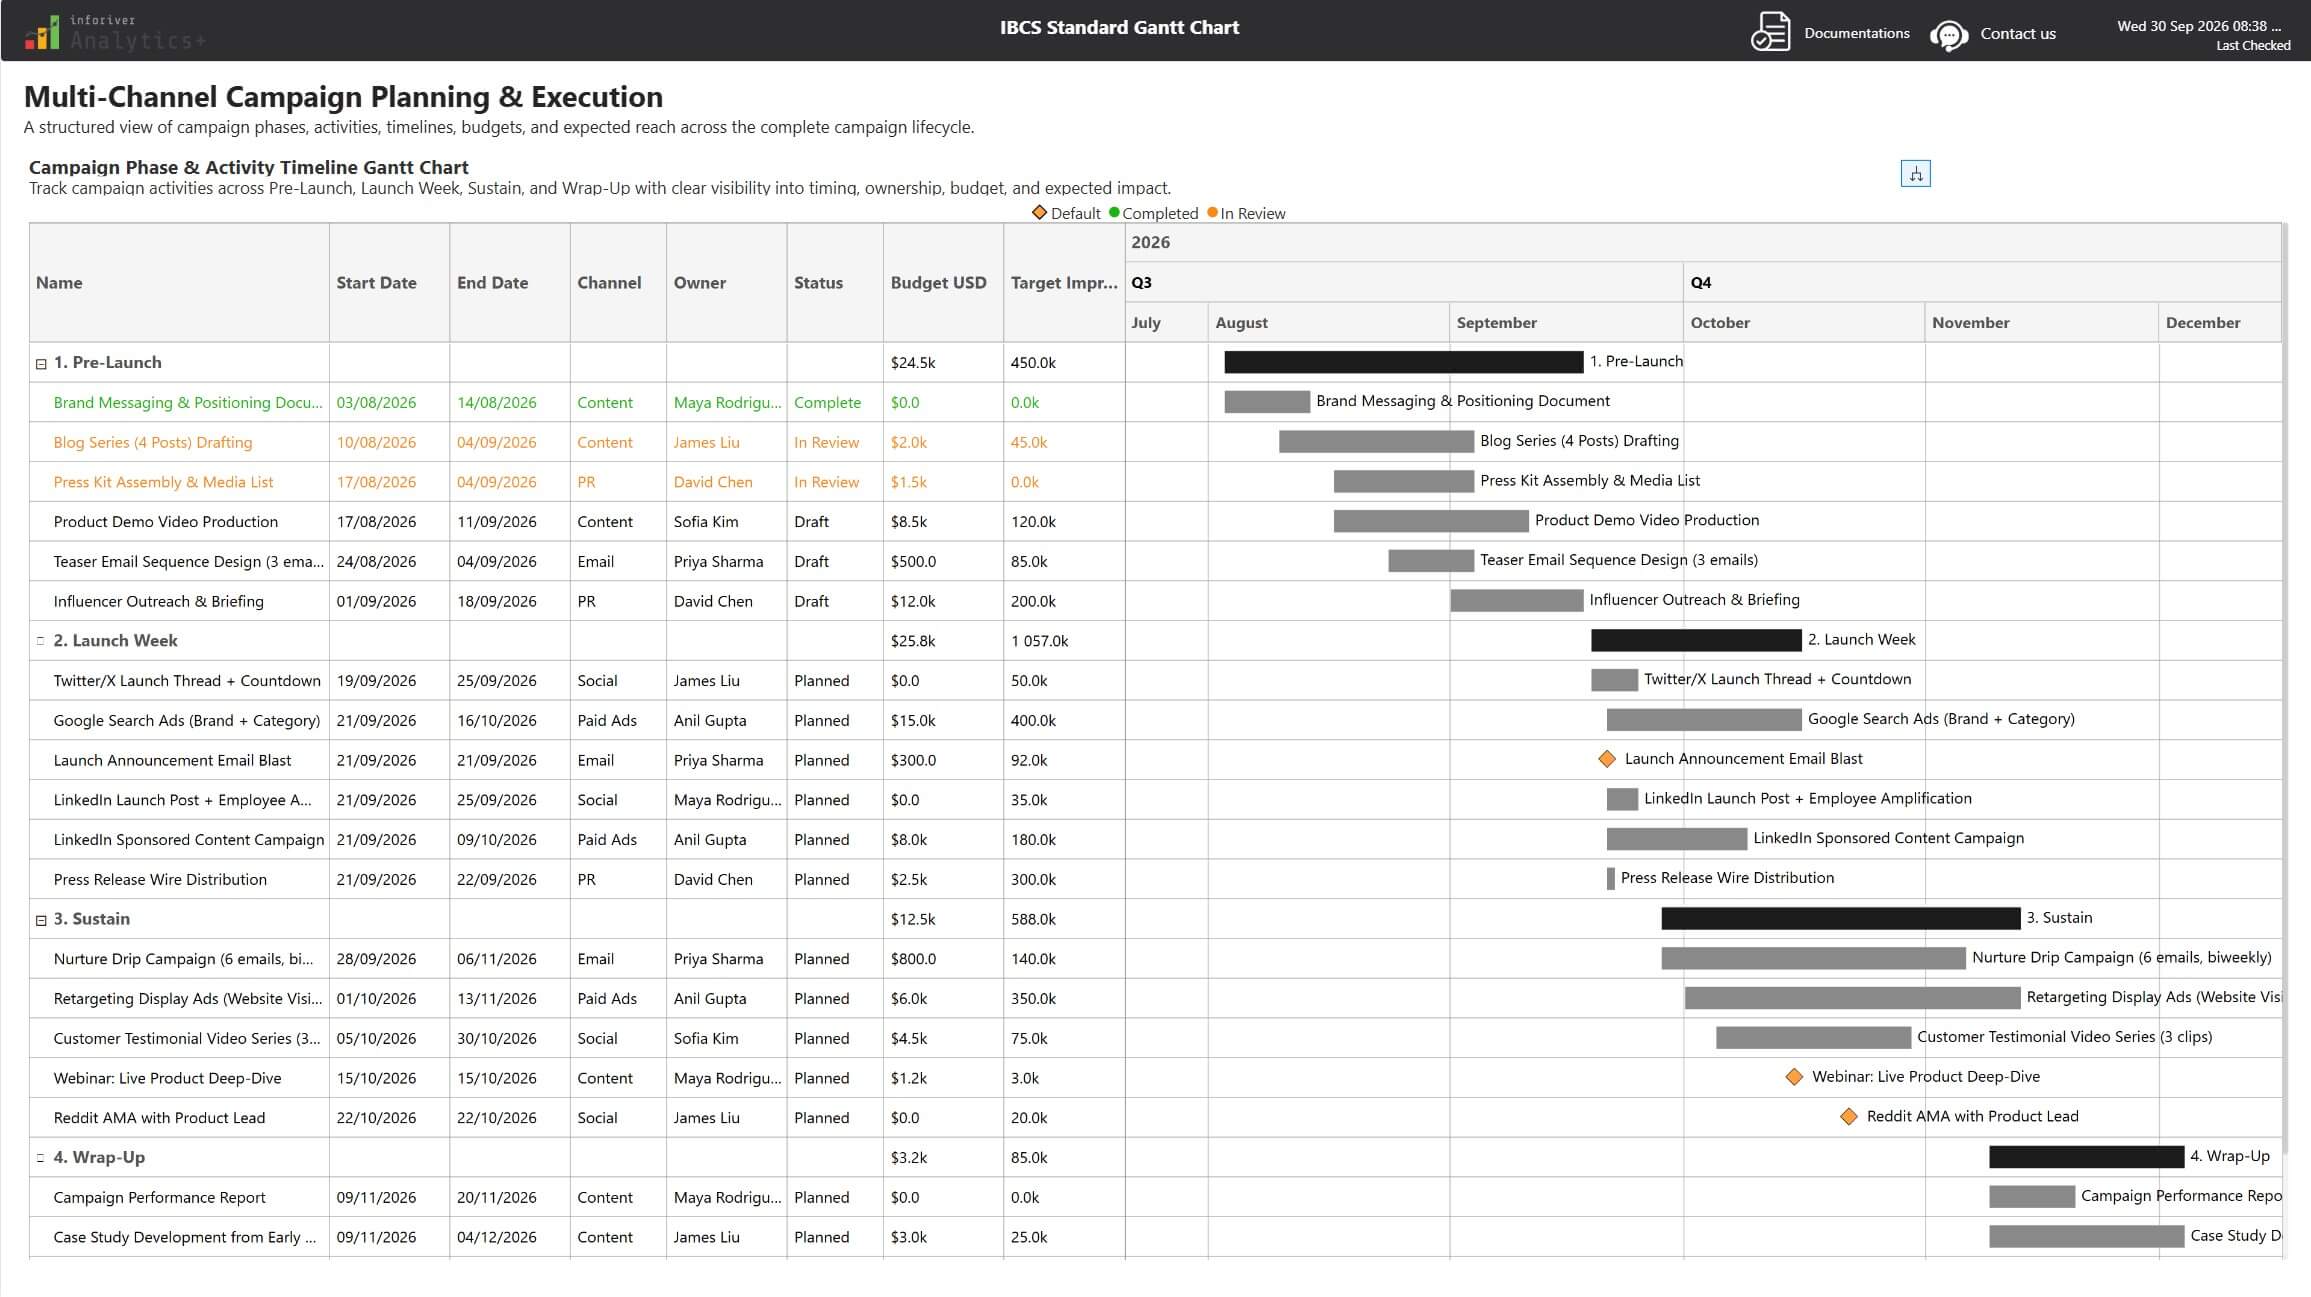
This Multi-Channel Campaign Planning & Execution report showcases an IBCS-standard Gantt Chart in Power BI built using Inforiver Analytics+. It provides a structured view of campaign phases, activities, timelines, budgets, ownership, and expected impact across the complete campaign lifecycle.
The report organizes campaign execution into key phases including Pre-Launch, Launch Week, Sustain, and Wrap-Up, helping marketing teams track activities across Content, PR, Email, Social, and Paid Ads.
Using an IBCS-compliant Gantt Chart, users can clearly visualize campaign timelines while comparing activities, budgets, and target impressions in a consistent and structured format. The report also provides a clear view of ownership and campaign status for better execution tracking.
Designed for marketing teams, campaign managers, and business leaders, this dashboard brings campaign planning and execution into a single, structured Power BI view.
Download the report and explore IBCS-standard Gantt Chart reporting and multi-channel campaign planning in Power BI with Inforiver Analytics+.

to try advance features
[demo_download_modal title="IBCS Gantt Chart for Multi-Channel Campaign Planning & Execution" link="https://inforiver.com/wp-content/uploads/ibcs-standard-gantt-chart-power-bi-multi-channel-campaign-planning-in-inforiver-analytics-plus.zip"]
Inforiver helps enterprises consolidate planning, reporting & analytics on a single platform (Power BI). The no-code, self-service award-winning platform has been recognized as the industry’s best and is adopted by many Fortune 100 firms.
Inforiver is a product of Lumel, the #1 Power BI AppSource Partner. The firm serves over 3,000 customers worldwide through its portfolio of products offered under the brands Inforiver, EDITable, ValQ, and xViz.