Upcoming webinar on 'Inforiver Charts : The fastest way to deliver stories in Power BI', Aug 29th , Monday, 10.30 AM CST. Register Now
Upcoming webinar on 'Inforiver Charts : The fastest way to deliver stories in Power BI', Aug 29th , Monday, 10.30 AM CST. Register Now
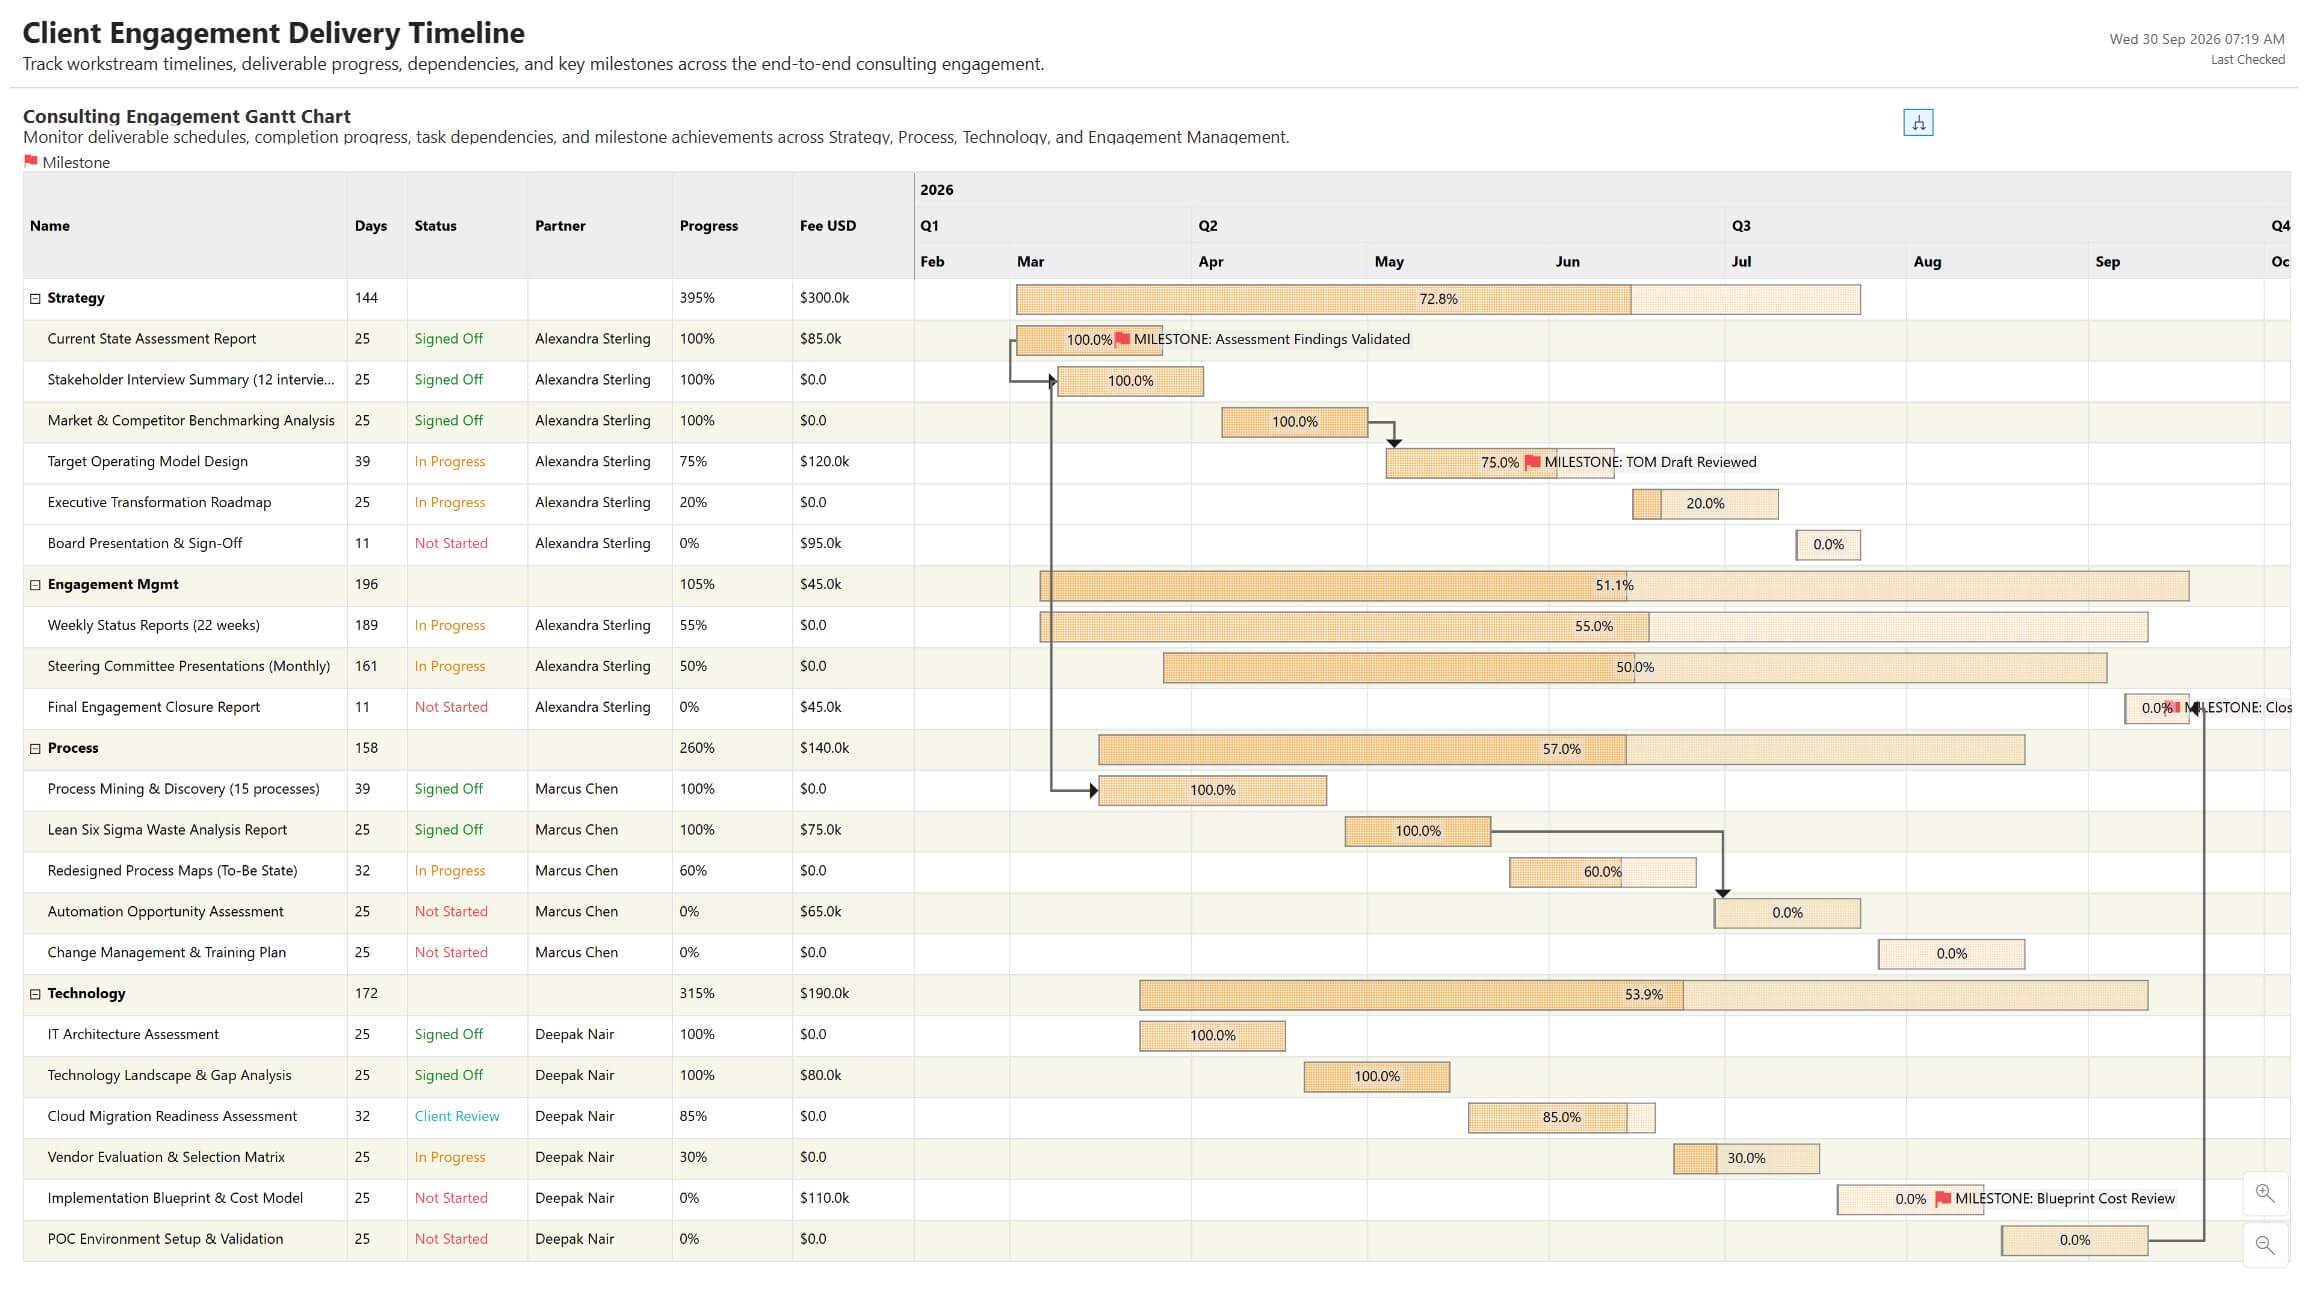
This Client Engagement Delivery Timeline showcases an interactive Power BI Gantt Chart built using Inforiver Analytics+. It provides a structured view of consulting workstreams, deliverables, timelines, progress, and key engagement milestones.
The report acts as a Consulting Project Management Dashboard in Power BI, covering Strategy, Process, Technology, and Engagement Management workstreams. Teams can monitor deliverable status, completion progress, partner ownership, timelines, and engagement fees in a single view.
Using Gantt Chart dependencies and connectors, users can visualize how tasks are linked and understand the sequence of deliverables across the engagement. Milestone tracking highlights important project events, while advanced conditional formatting makes status and progress easier to interpret.
Designed for consulting teams, project managers, and engagement leaders, this dashboard provides a clear view of client delivery timelines, dependencies, milestones, and project progress.
Download the report and explore client engagement planning and project delivery tracking in Power BI with Inforiver Analytics+.

to try advance features
[demo_download_modal title="Gantt Chart for Client Engagement Delivery Timeline" link="https://inforiver.com/wp-content/uploads/power-bi-client-engagement-delivery-timeline-gantt-chart-in-inforiver-analytics-plus.zip"]
Inforiver helps enterprises consolidate planning, reporting & analytics on a single platform (Power BI). The no-code, self-service award-winning platform has been recognized as the industry’s best and is adopted by many Fortune 100 firms.
Inforiver is a product of Lumel, the #1 Power BI AppSource Partner. The firm serves over 3,000 customers worldwide through its portfolio of products offered under the brands Inforiver, EDITable, ValQ, and xViz.