Inforiver

Upcoming webinar on 'Inforiver Charts : The fastest way to deliver stories in Power BI', Aug 29th , Monday, 10.30 AM CST.    Register Now

Funnel and Pyramid Chart in Power BI

Download PBIX File

The Funnel and Pyramid Chart in Inforiver Analytics+ helps you analyze stage-wise movement and conversion across processes such as sales pipelines, marketing funnels, user journeys, recruitment stages, and onboarding flows. You can clearly see how values progress from one step to the next and where drop-offs or growth occur, which makes it easier to identify bottlenecks and improvement areas. 

Along with standard Funnel and Pyramid layouts, Inforiver also provides an Executive Funnel Chart designed specially for leadership dashboards. It delivers a clean summary view of conversions with clear percentages and stage-wise contribution, so executives can review performance quickly without dense visuals. 

You can switch between multiple display styles, control width and layout, and show values or percentages as needed. Trellis view allows comparison of multiple funnels or pyramids across regions or segments side by side, keeping analysis structured and simple inside Power BI. 

For complete feature details, demo visuals, and pricing information, visit: https://inforiver.com/analytics-plus/gauge-chart/


iframe preview
View interactive content

Funnel and Pyramid Chart in Power BI

The Funnel and Pyramid Chart in Inforiver Analytics+ helps you analyze stage-wise movement and conversion across processes such as sales pipelines, marketing funnels, user journeys, recruitment stages, and onboarding flows. You can clearly see how values progress from one step to the next and where drop-offs or growth occur, which makes it easier to identify bottlenecks and improvement areas.  Along with standard Funnel and Pyramid layouts, Inforiver also provides an Executive Funnel Chart designed specially for leadership dashboards. It delivers a clean summary view of conversions with clear percentages and stage-wise contribution, so executives can review performance quickly without dense visuals.  You can switch between multiple display styles, control width and layout, and show values or percentages as needed. Trellis view allows comparison of multiple funnels or pyramids across regions or segments side by side, keeping analysis structured and simple inside Power BI.  For complete feature details, demo visuals, and pricing information, visit: https://inforiver.com/analytics-plus/gauge-chart/
iframe preview
View interactive content

Download Report for Free

to try advance features

[demo_download_modal title="Funnel and Pyramid Chart in Power BI" link="https://inforiver.com/wp-content/uploads/funnel-and-pyramid-chart-in-analytics-plus-demo-update.zip"]

Other Demos

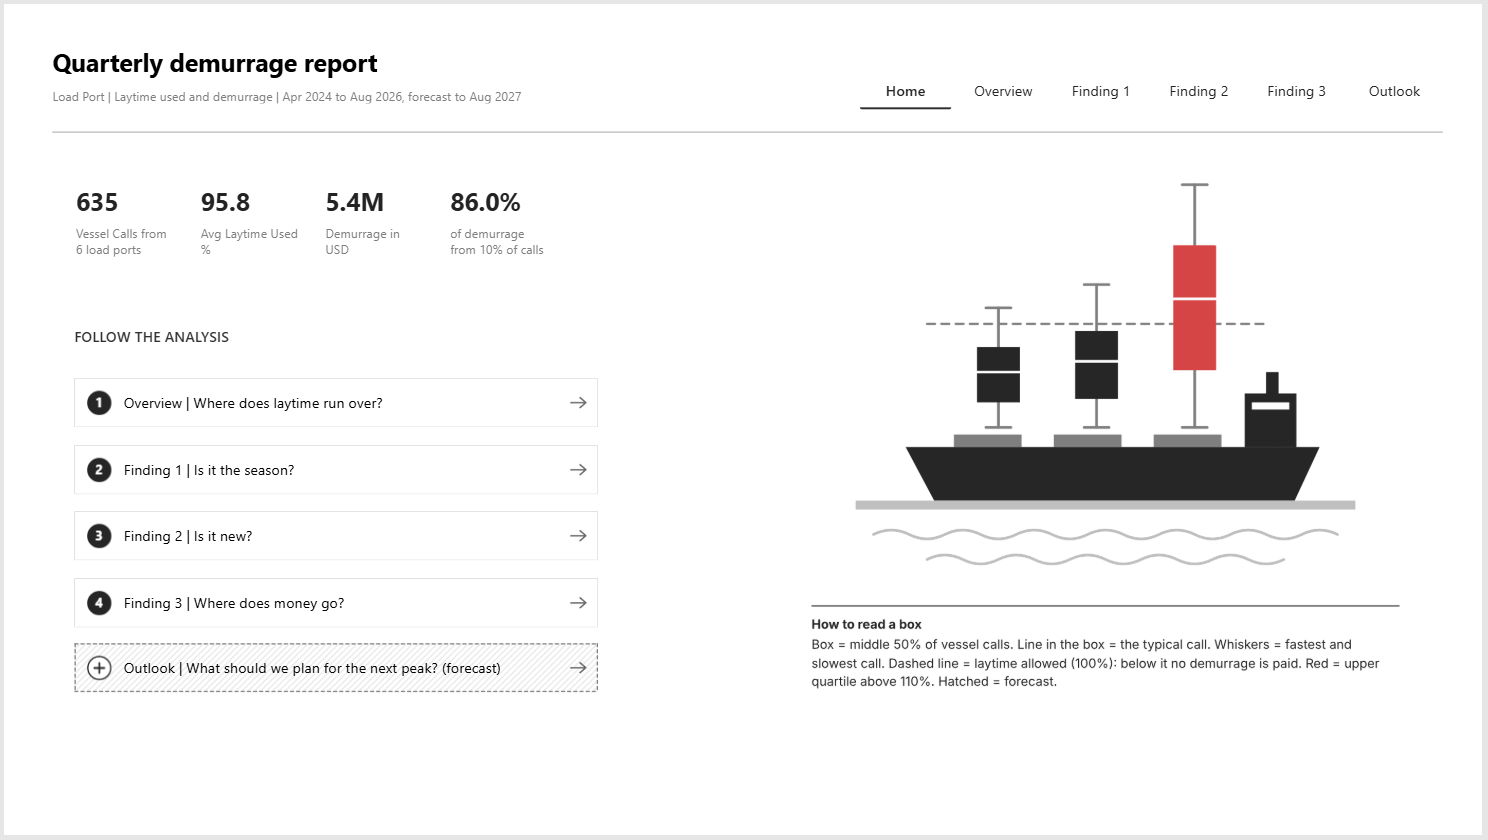
Power BI Box Plots for Demurrage Risk: IBCS Quarterly Port Performance Report with Forecast

Explore a quarterly demurrage report built with Inforiver Analytics+ in Power BI. Analyze laytime usage across six load ports using box plots, seasonal comparisons, conditional formatting, and 2027 forecasts in an IBCS-compliant report layout.
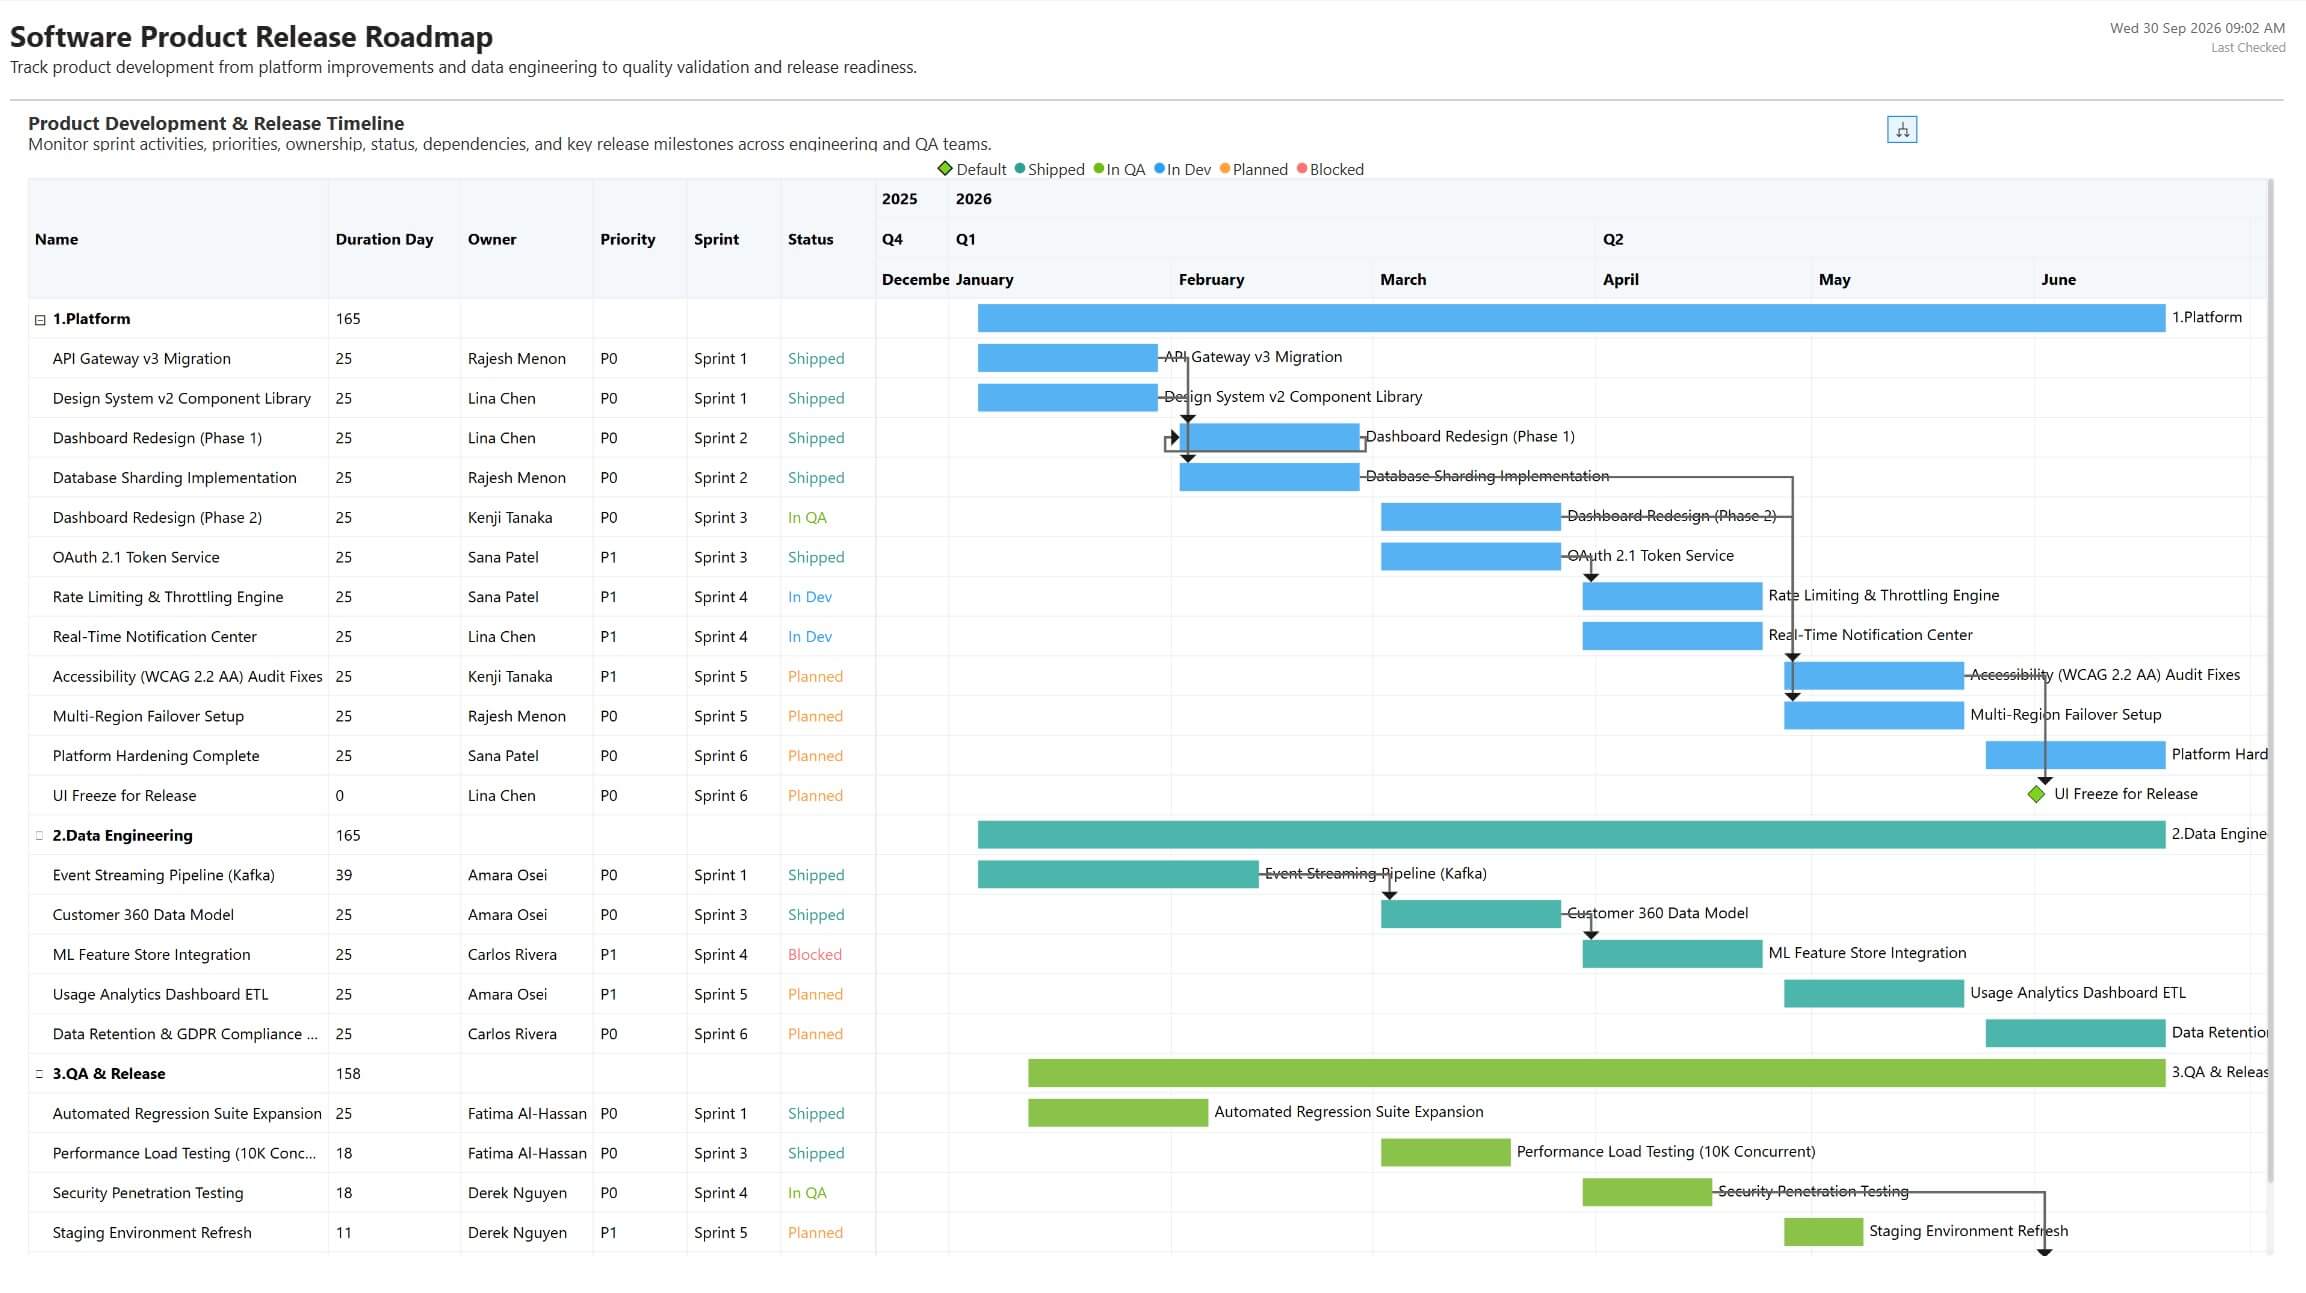
Gantt Chart for Software Product Release Roadmap in Power BI

Plan software releases with sprint timelines, task priorities, status tracking, dependencies, and release milestones in Power BI with Inforiver Analytics+.

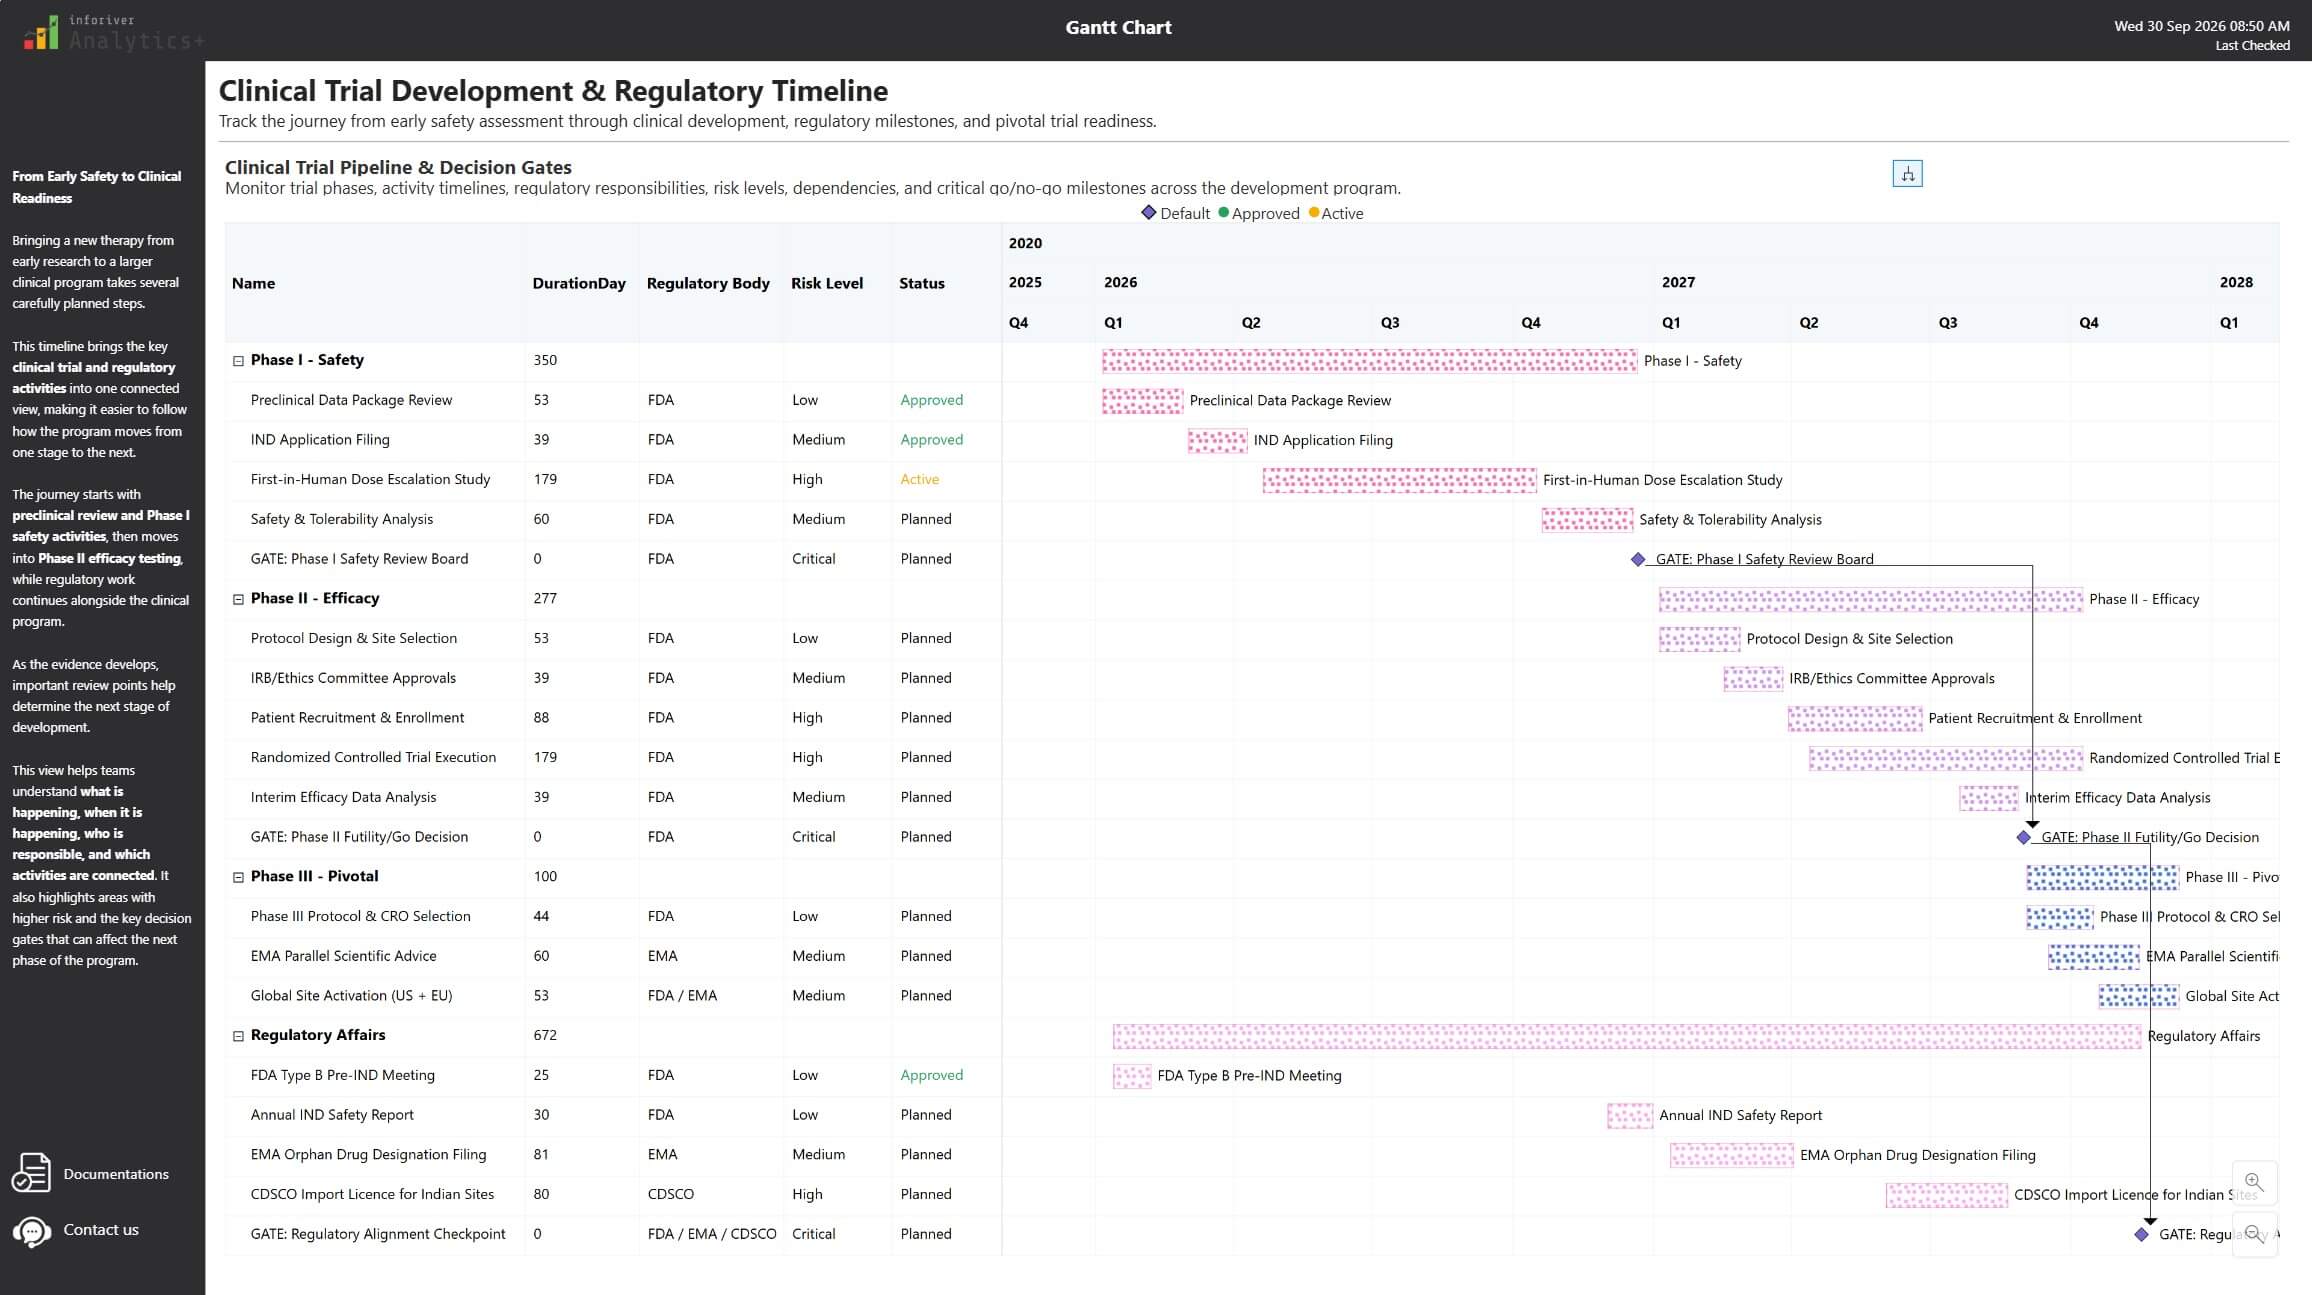
Gantt Chart for Clinical Trial Development & Regulatory Timeline

Manage clinical trial timelines with phase tracking, regulatory activities, risk visibility, dependencies, and critical decision gates in Power BI with Inforiver Analytics+.

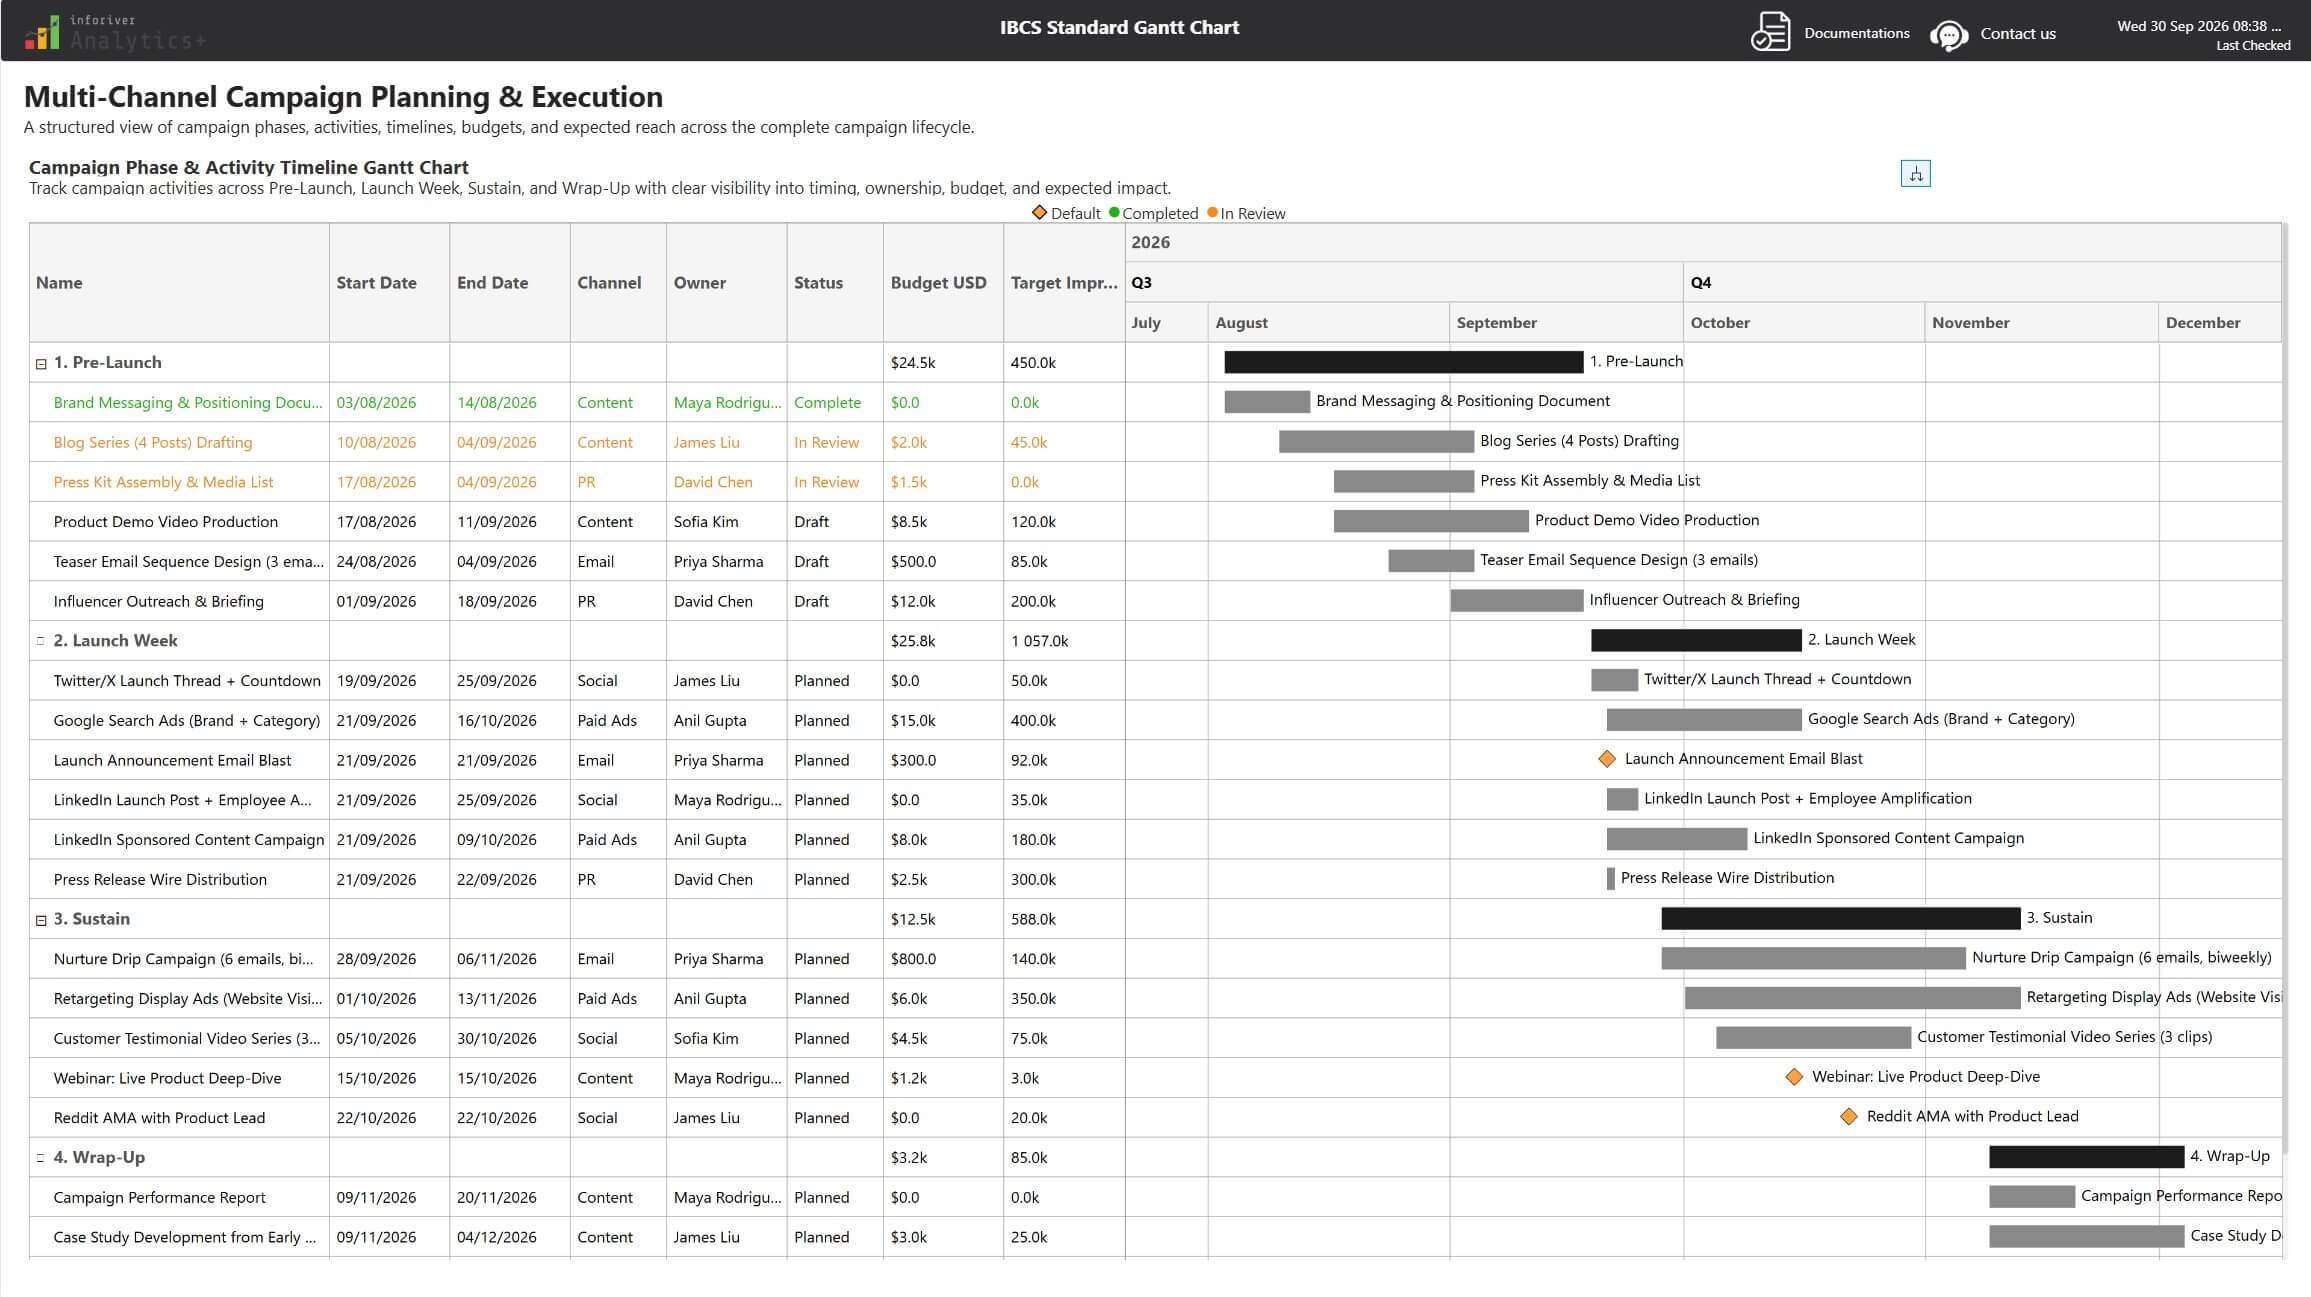
IBCS Gantt Chart for Multi-Channel Campaign Planning & Execution

Plan multi-channel campaigns with an IBCS-standard Gantt Chart, structured timelines, budgets, activities, and campaign phase tracking in Power BI.

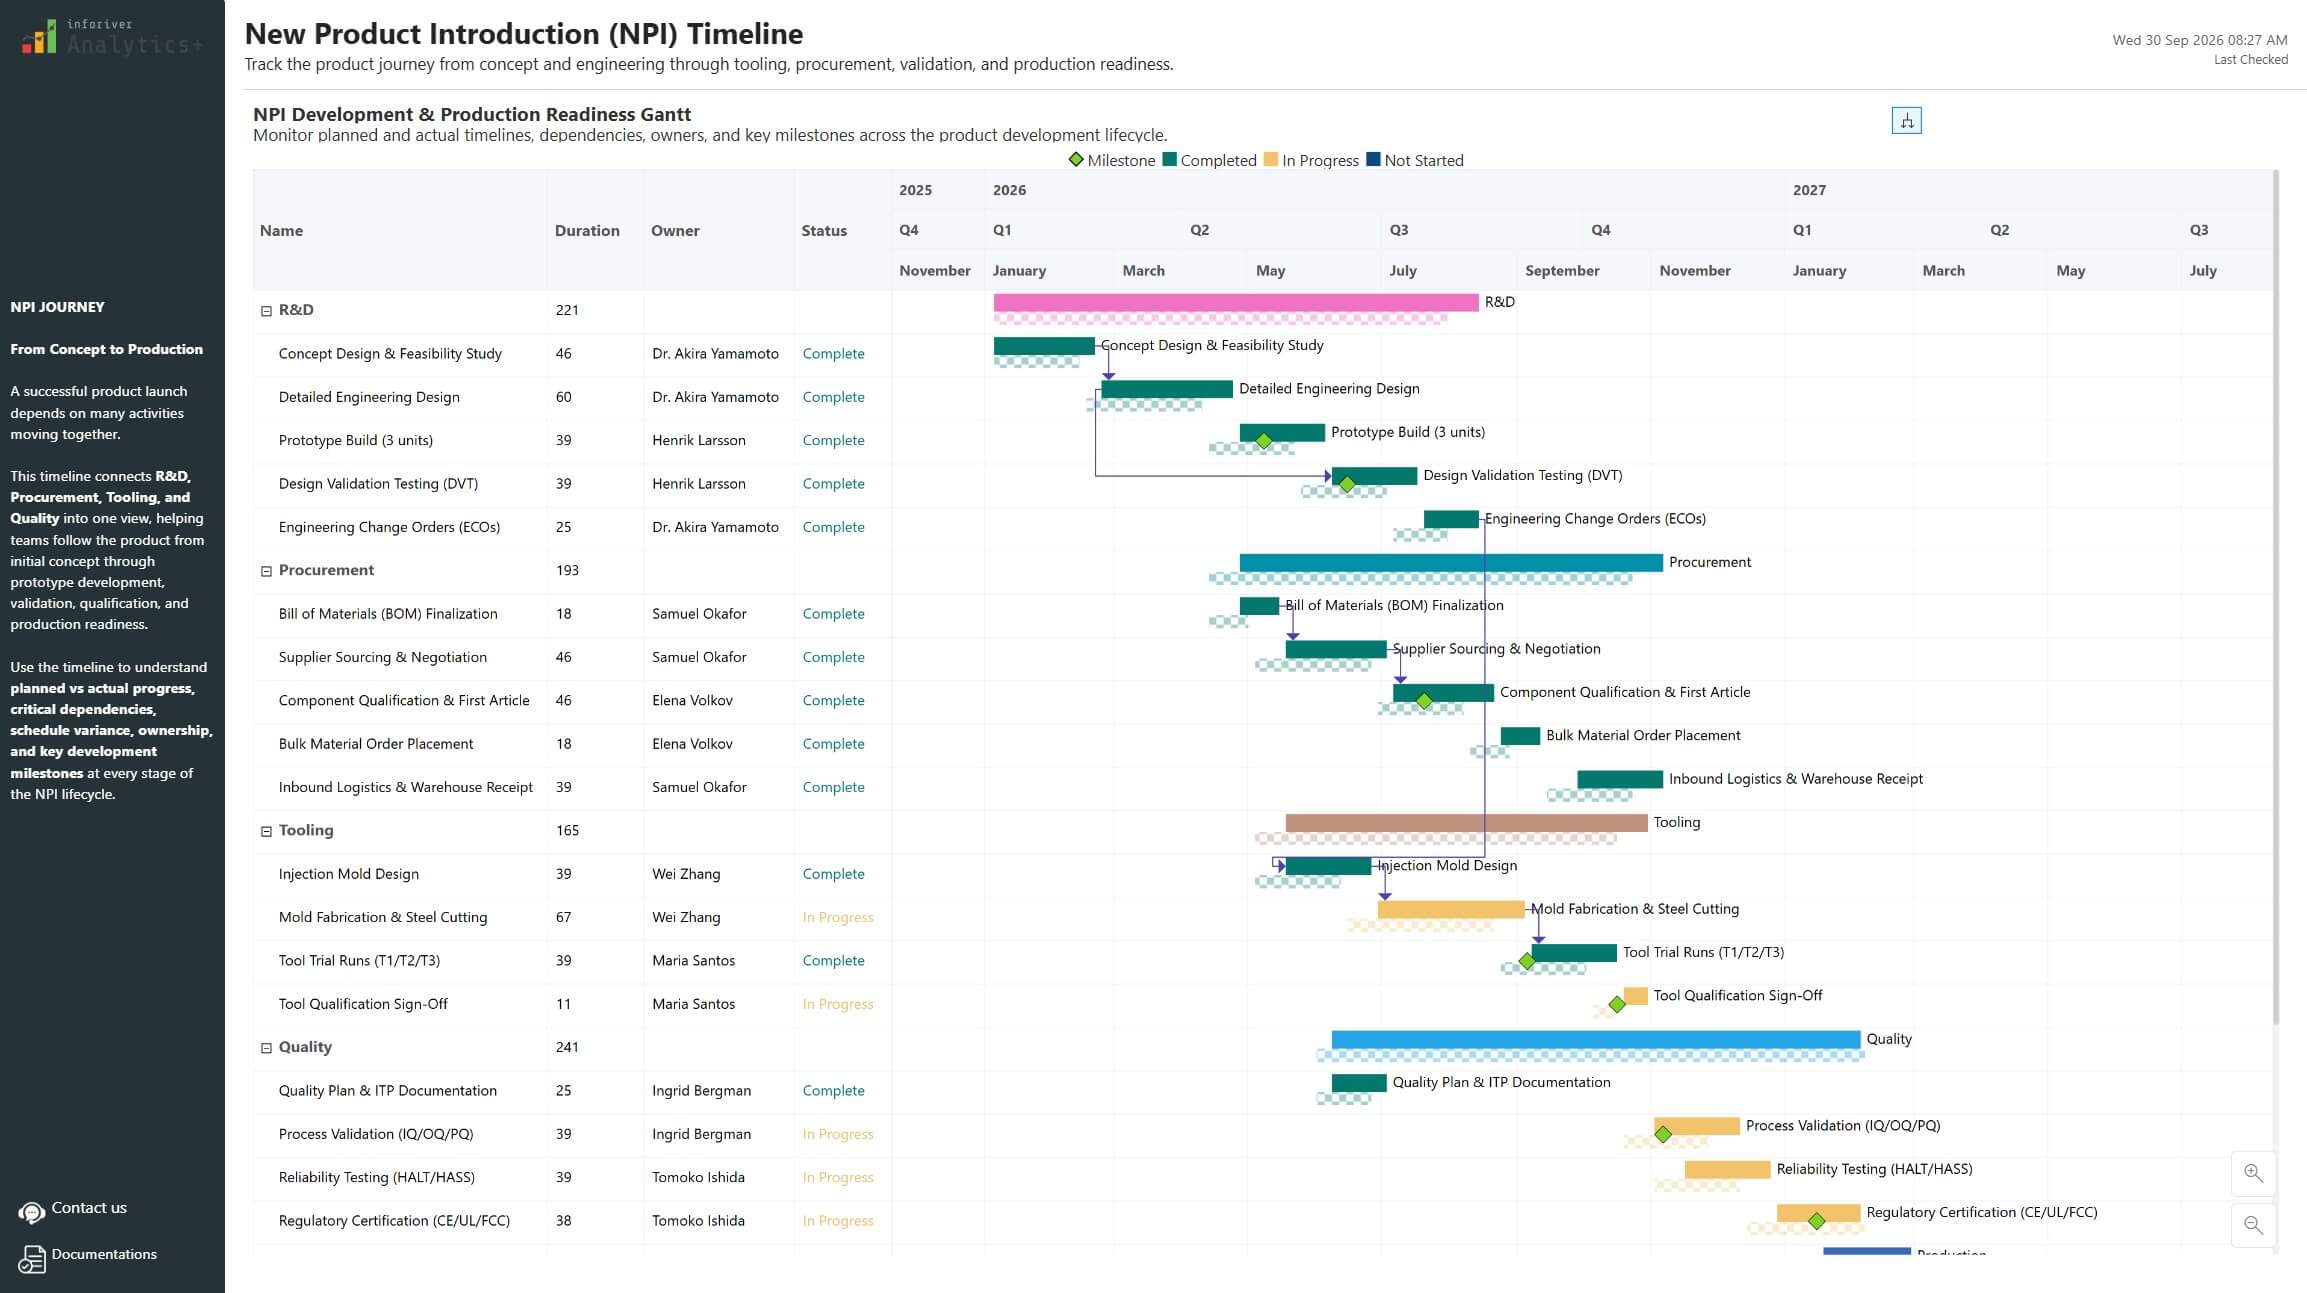
Gantt Chart for New Product Introduction (NPI) Timeline in Power BI

Track NPI execution with actual vs planned timelines, progress-based conditional formatting, RAG status, dependencies, and milestone tracking in Power BI.

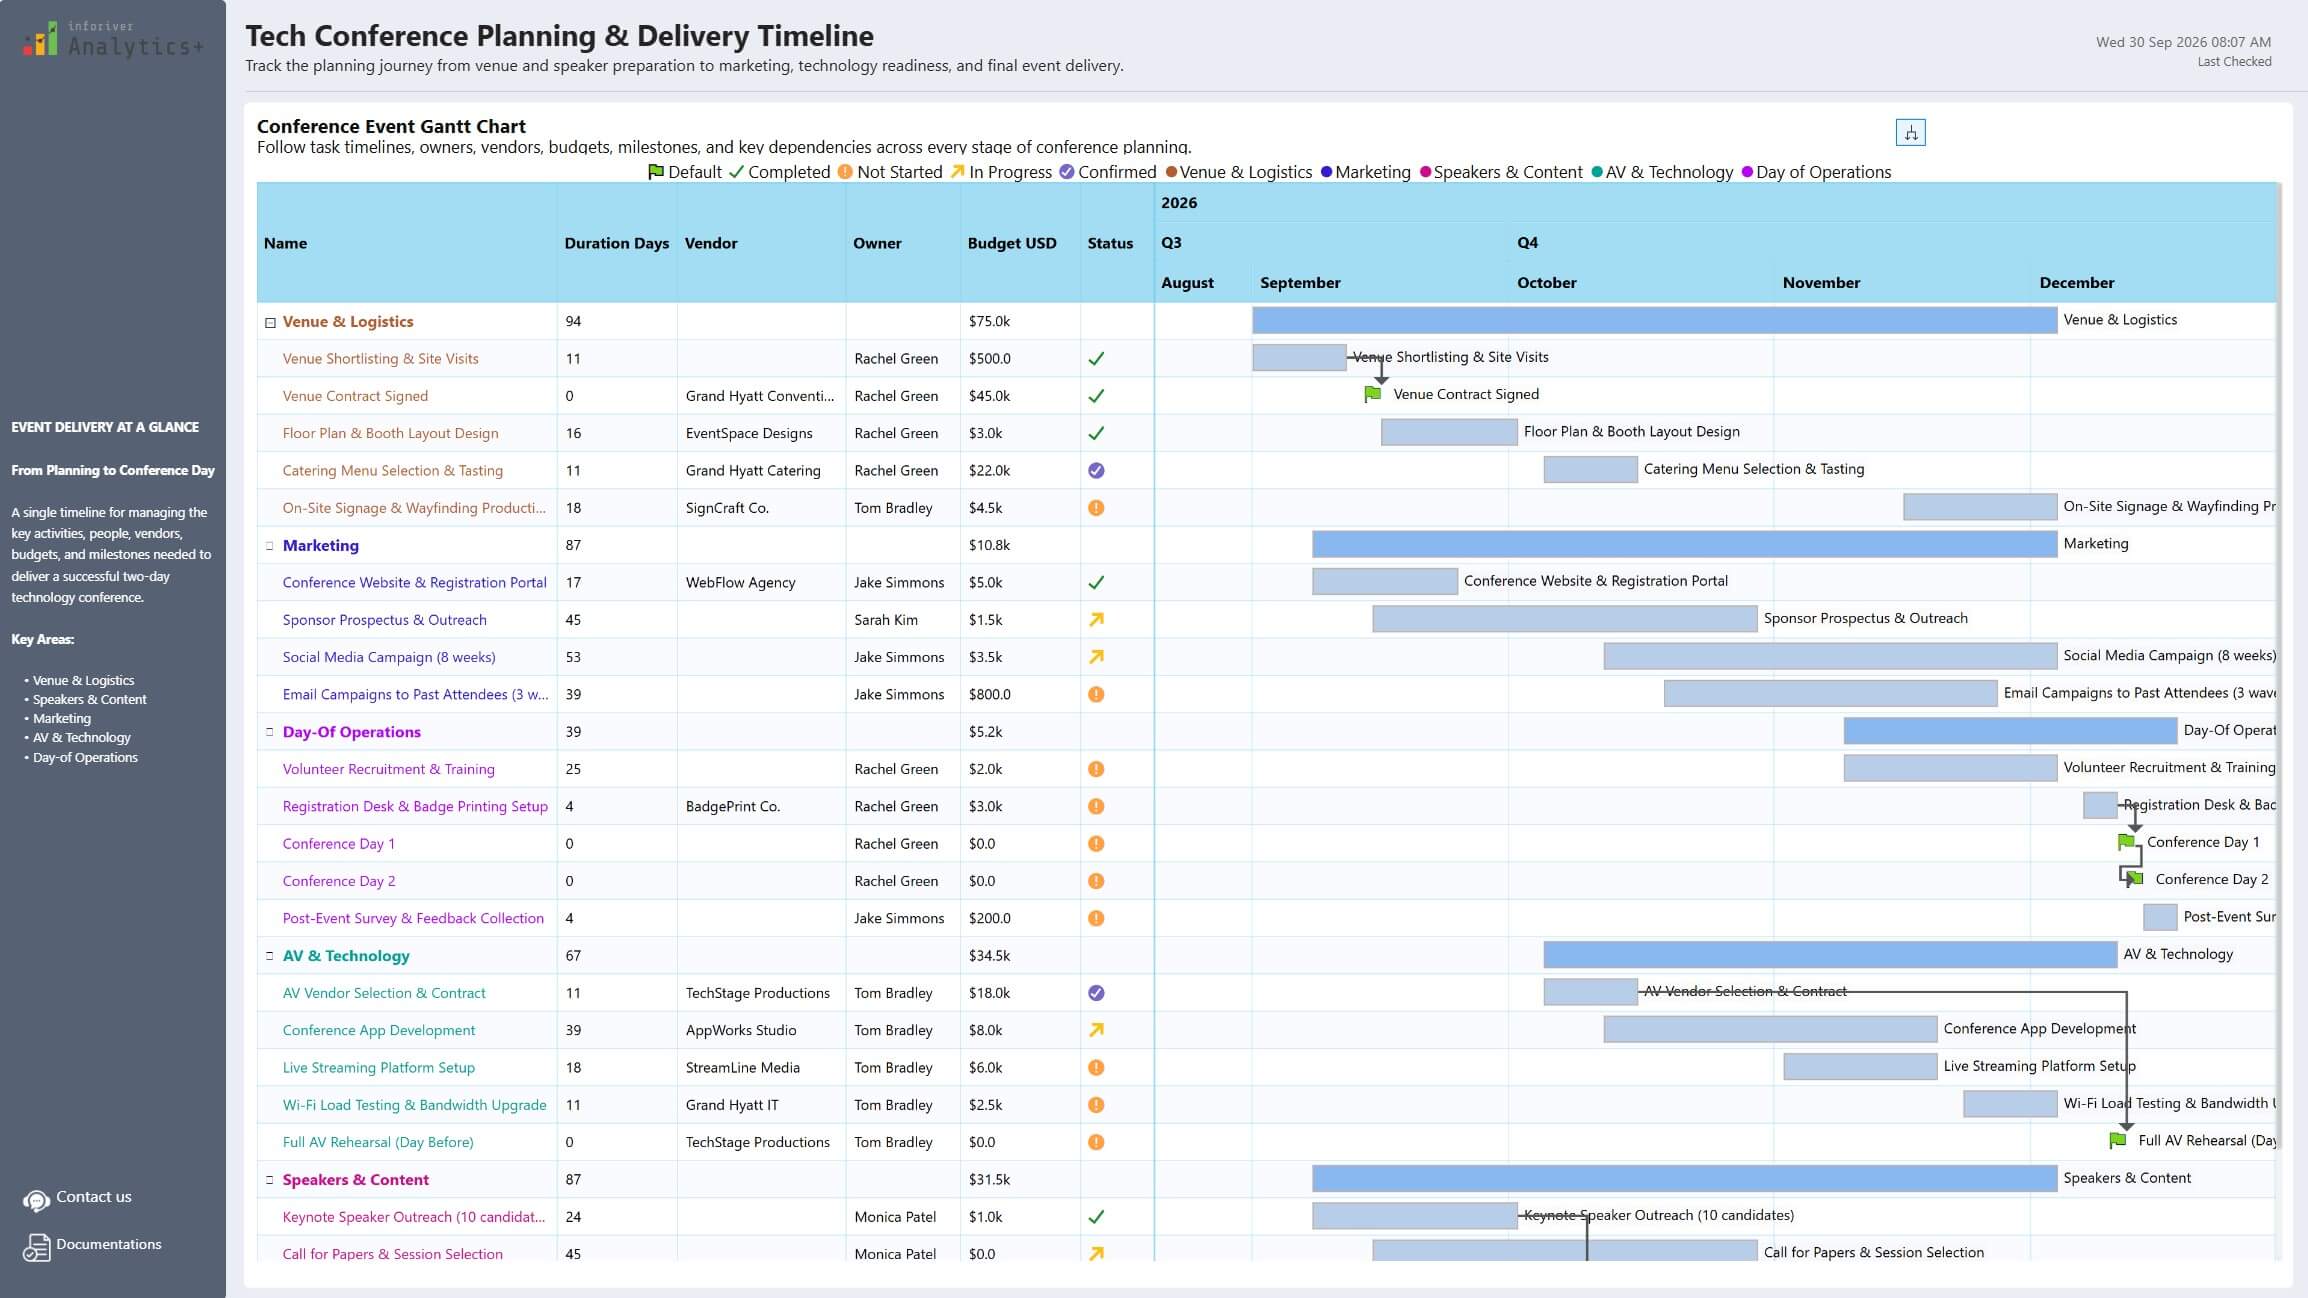
Conference Event Planning Gantt Chart in Power BI

Plan and manage conference delivery with status flags, conditional grid formatting, task dependencies, connectors, and milestone tracking in Inforiver Analytics Plus Power BI.

Download Funnel and Pyramid Chart in Power BI

By clicking on Download PBIX File you agree to our terms and conditions and you acknowledge having read our EULAThe PBIX file is available only for limited duration

Get Inforiver brochure

Maximize your business potential with Inforiver's paginated reporting, data entry, planning & budgeting capabilities
Download now
Inforiver

Inforiver helps enterprises consolidate planning, reporting & analytics on a single platform (Power BI). The no-code, self-service award-winning platform has been recognized as the industry’s best and is adopted by many Fortune 100 firms.

Inforiver is a product of Lumel, the #1 Power BI AppSource Partner. The firm serves over 3,000 customers worldwide through its portfolio of products offered under the brands Inforiver, EDITable, ValQ, and xViz.

homemagnifiercross linkedin facebook pinterest youtube rss twitter instagram facebook-blank rss-blank linkedin-blank pinterest youtube twitter instagram