
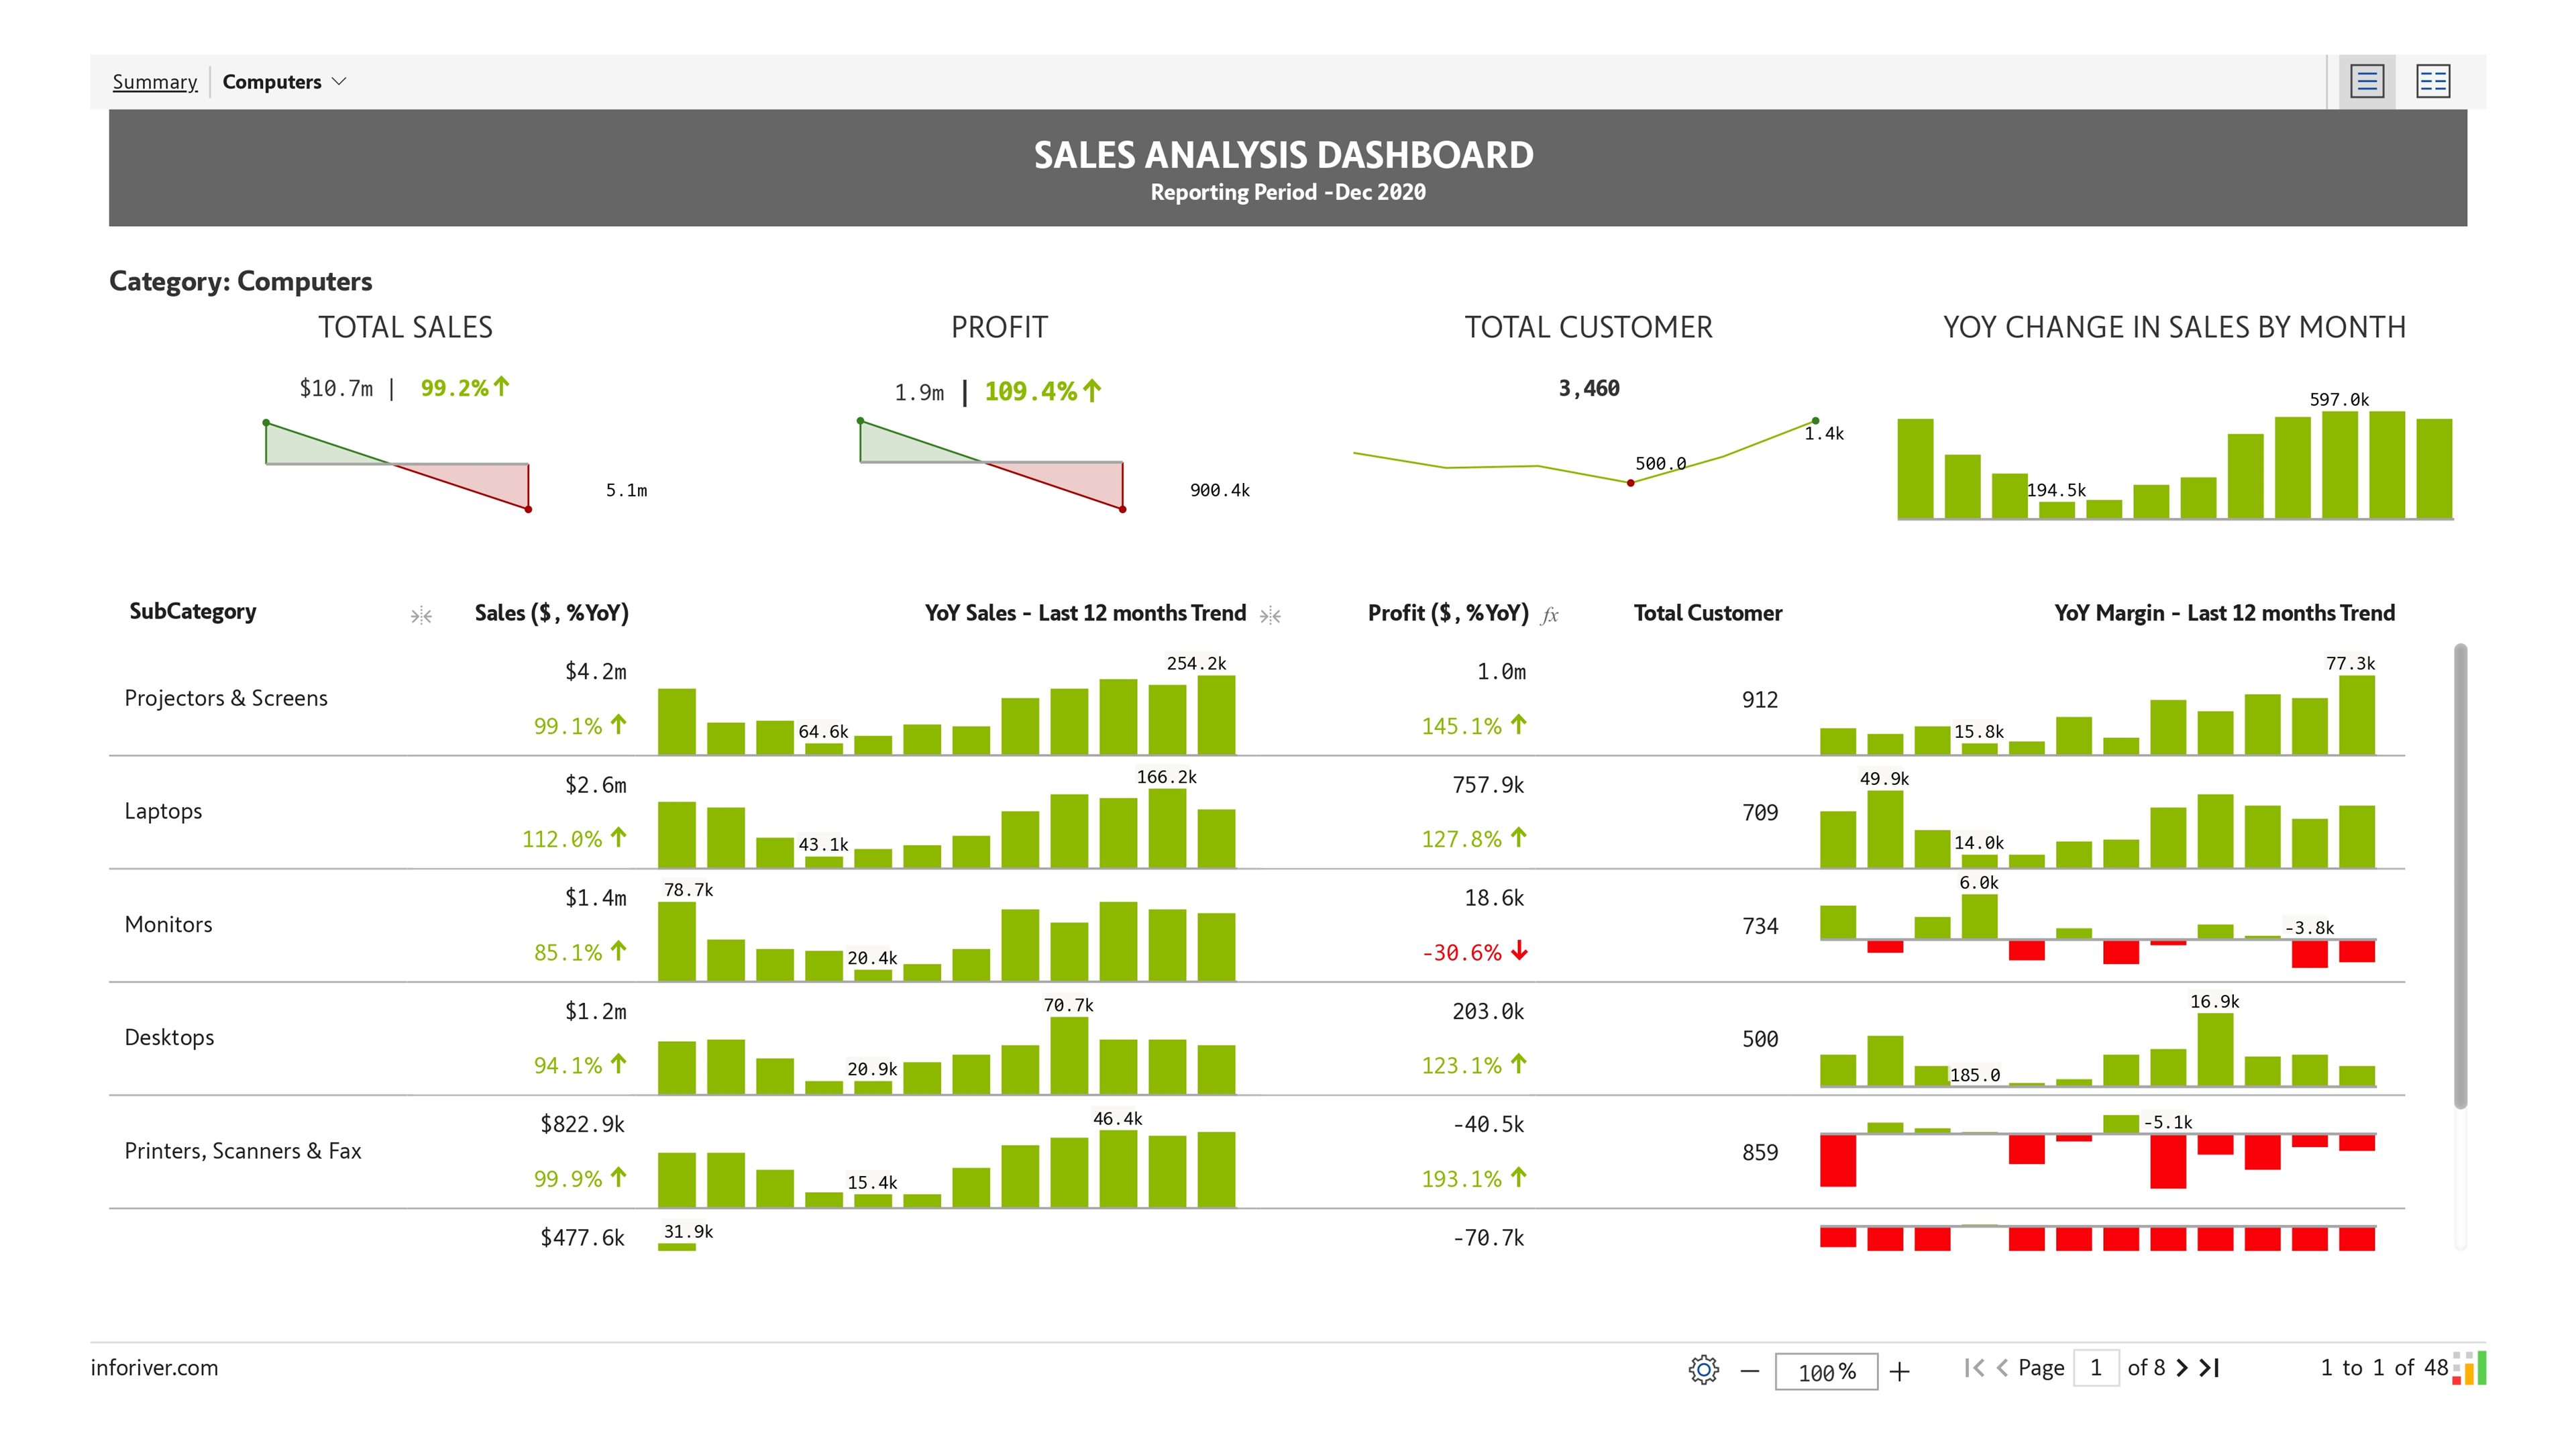
Sales Analysis
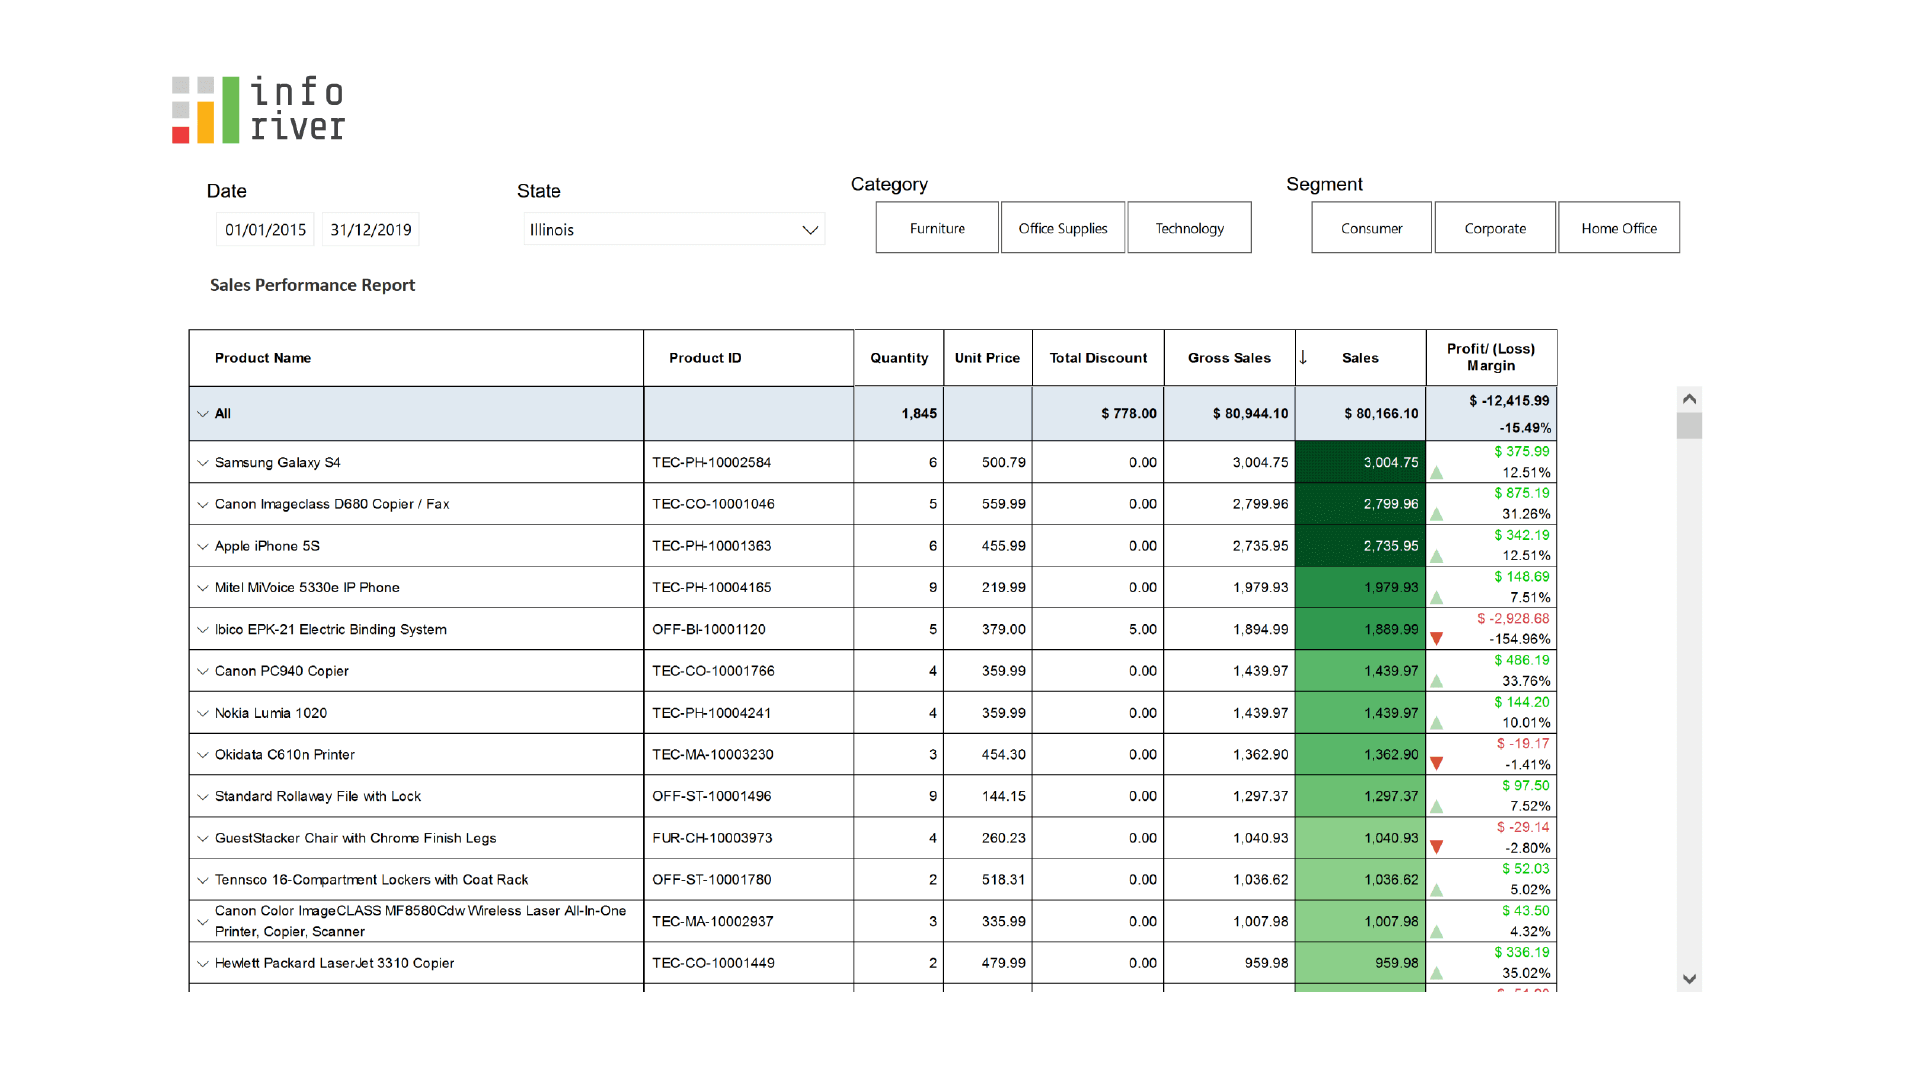
Create multi-page reports: Sales, Profit, 12-month trends & YoY margins by category. Win/loss charts for product performance analysis.
Upcoming webinar on 'Inforiver Charts : The fastest way to deliver stories in Power BI', Aug 29th , Monday, 10.30 AM CST. Register Now
Create multi-page reports: Sales, Profit, 12-month trends & YoY margins by category. Win/loss charts for product performance analysis.
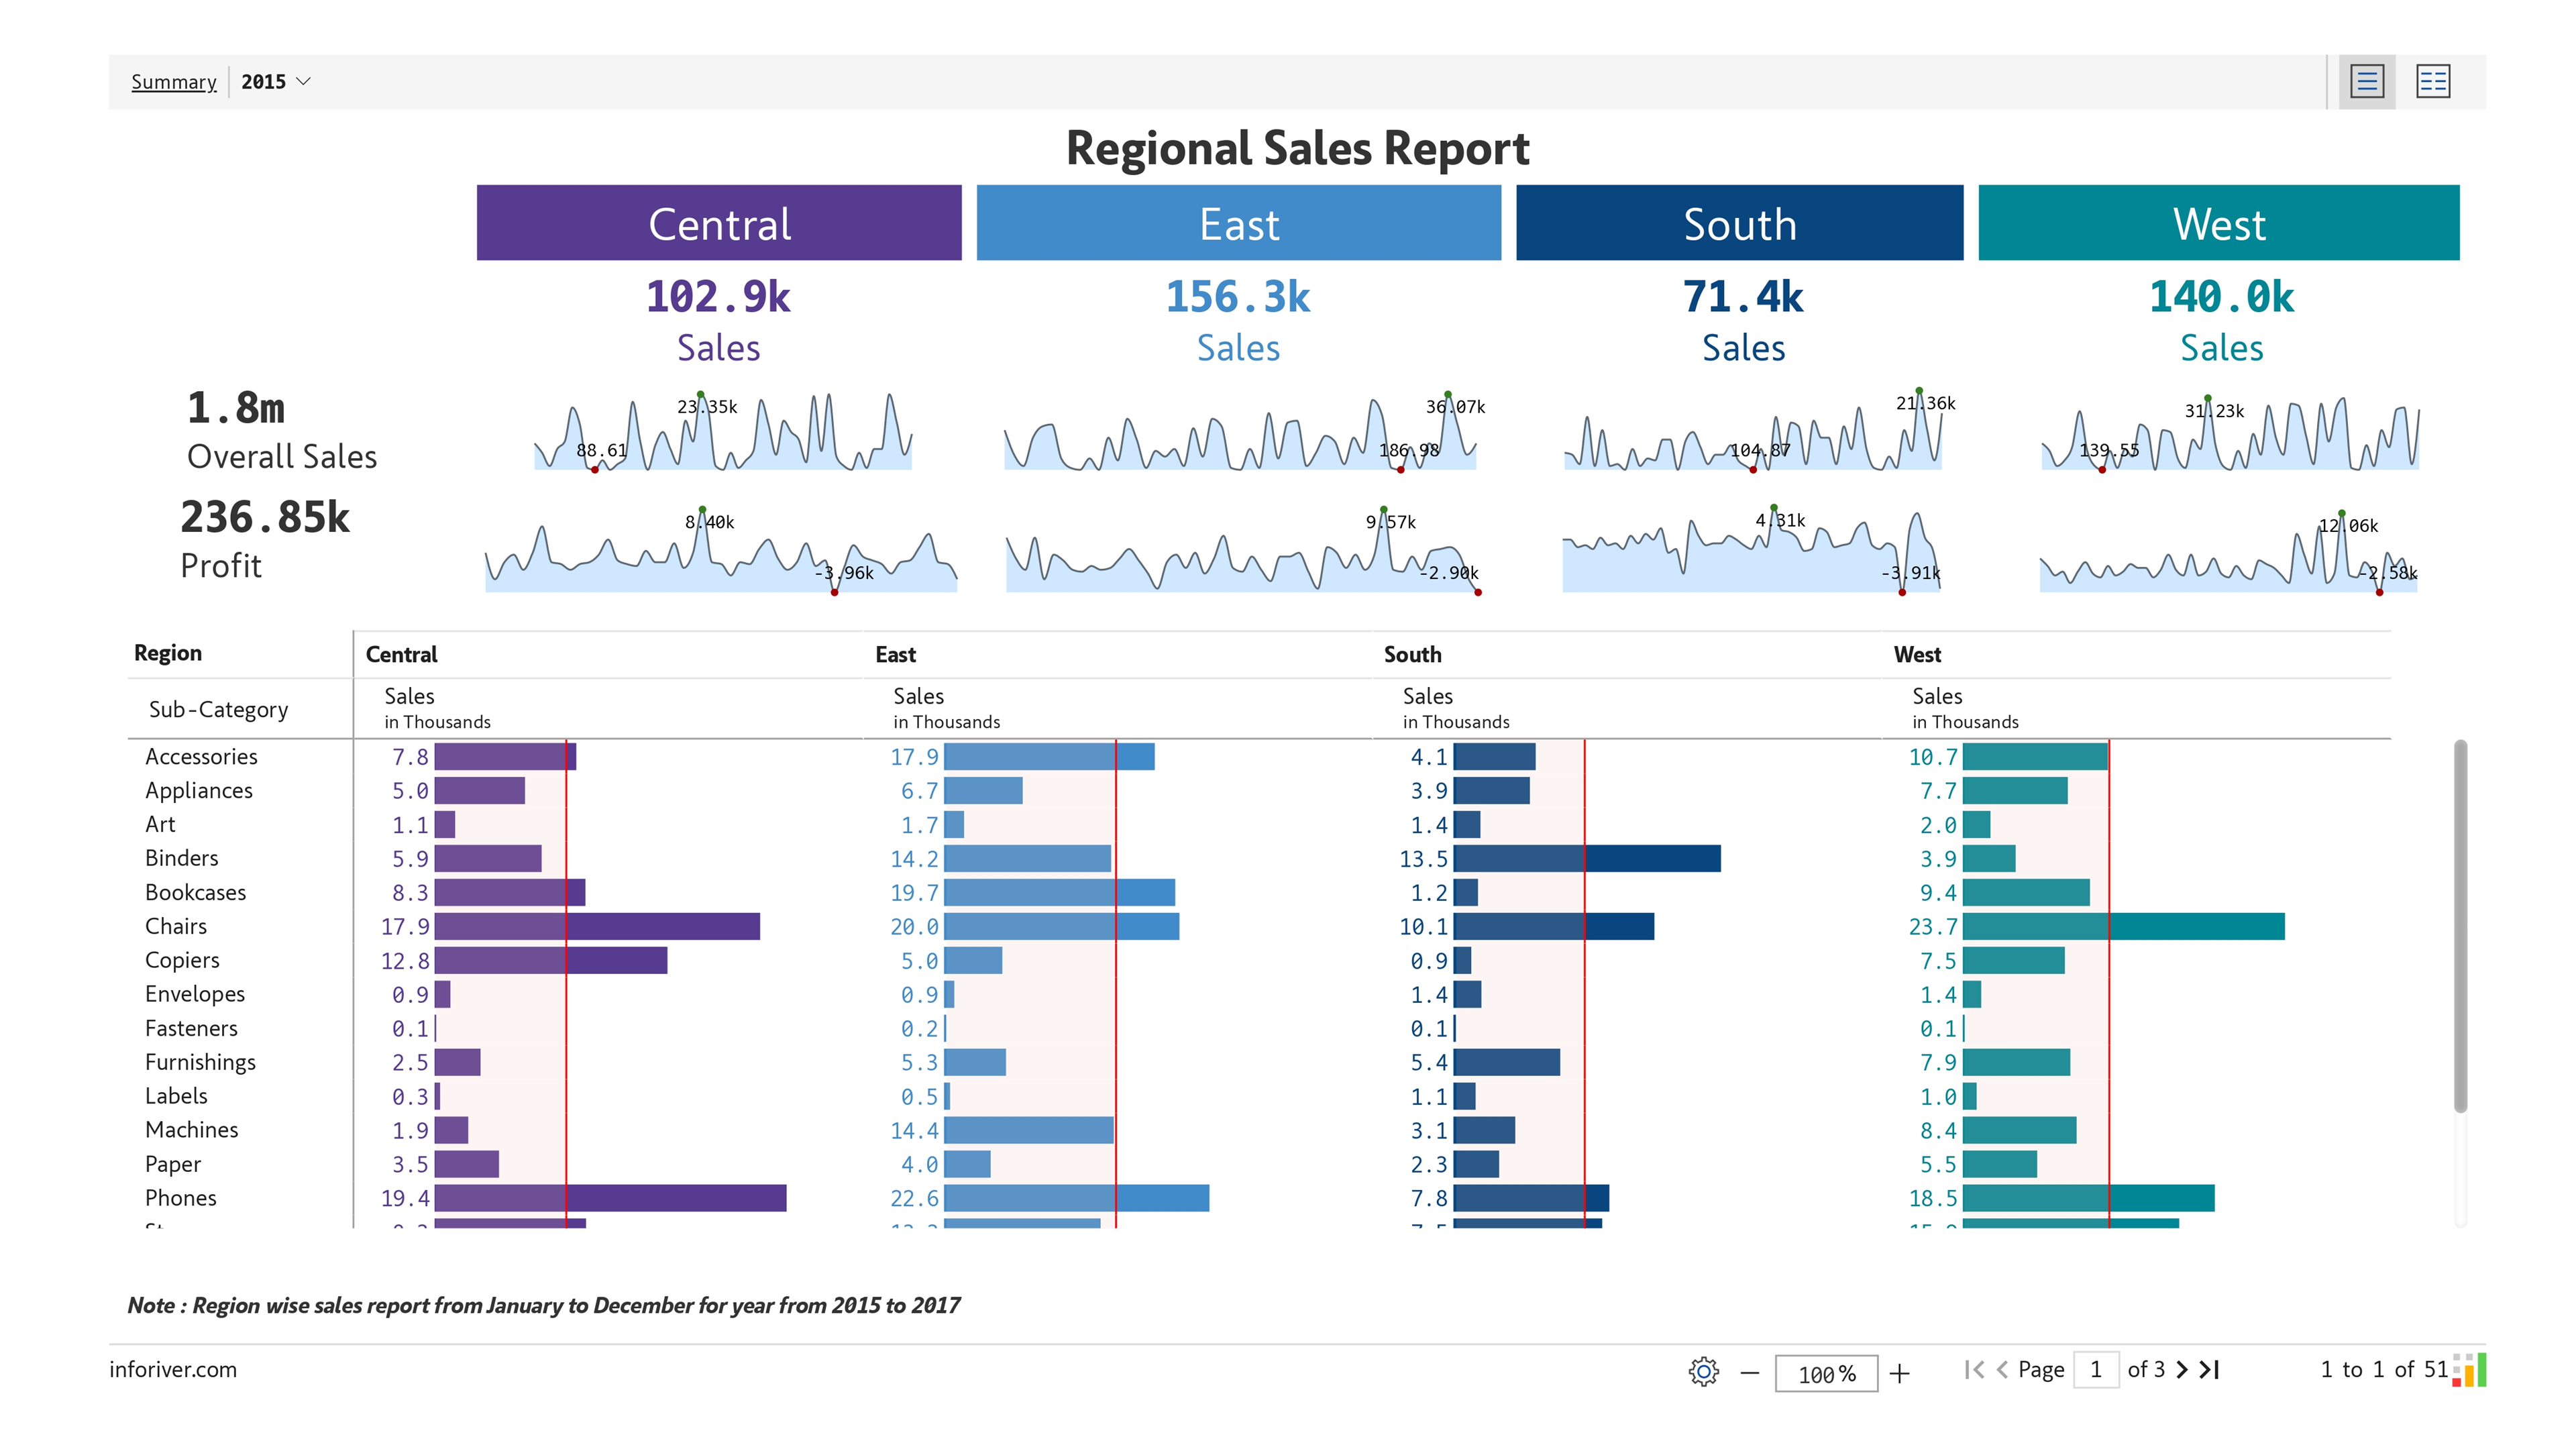
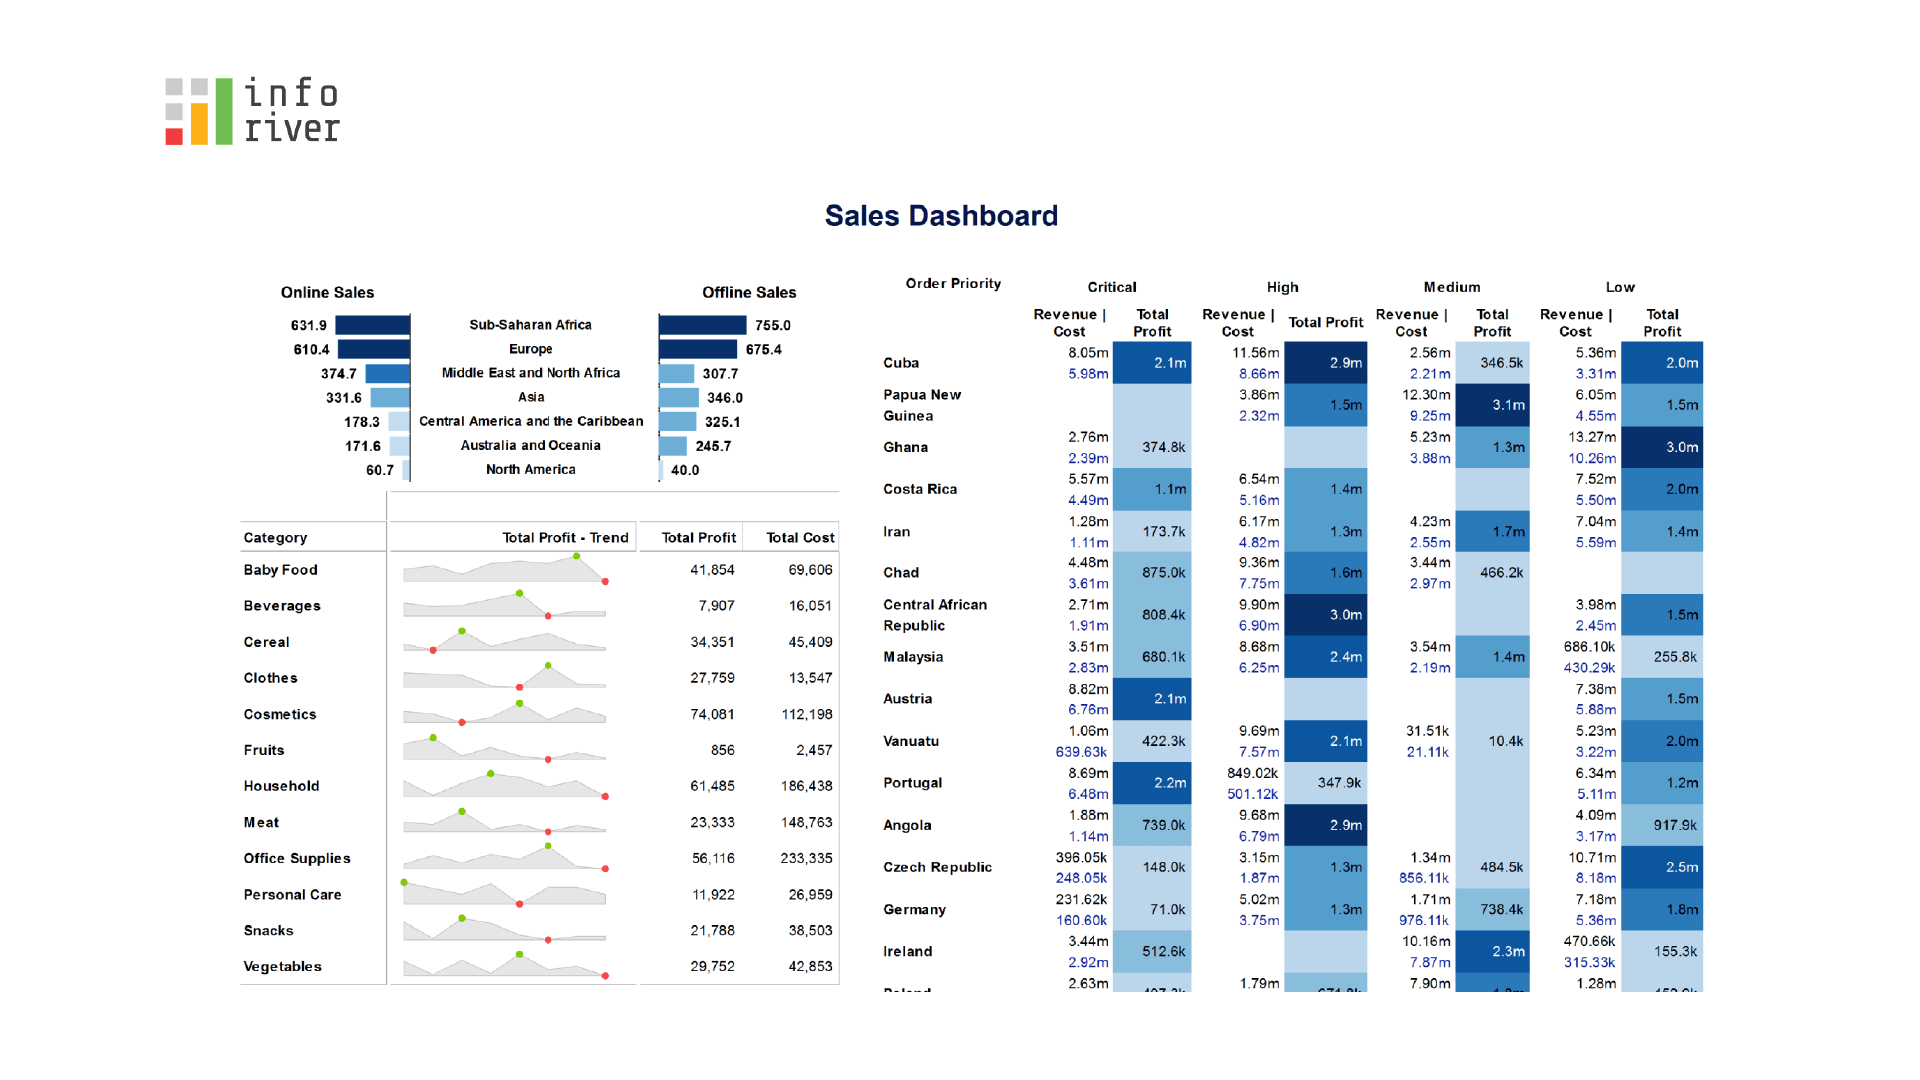
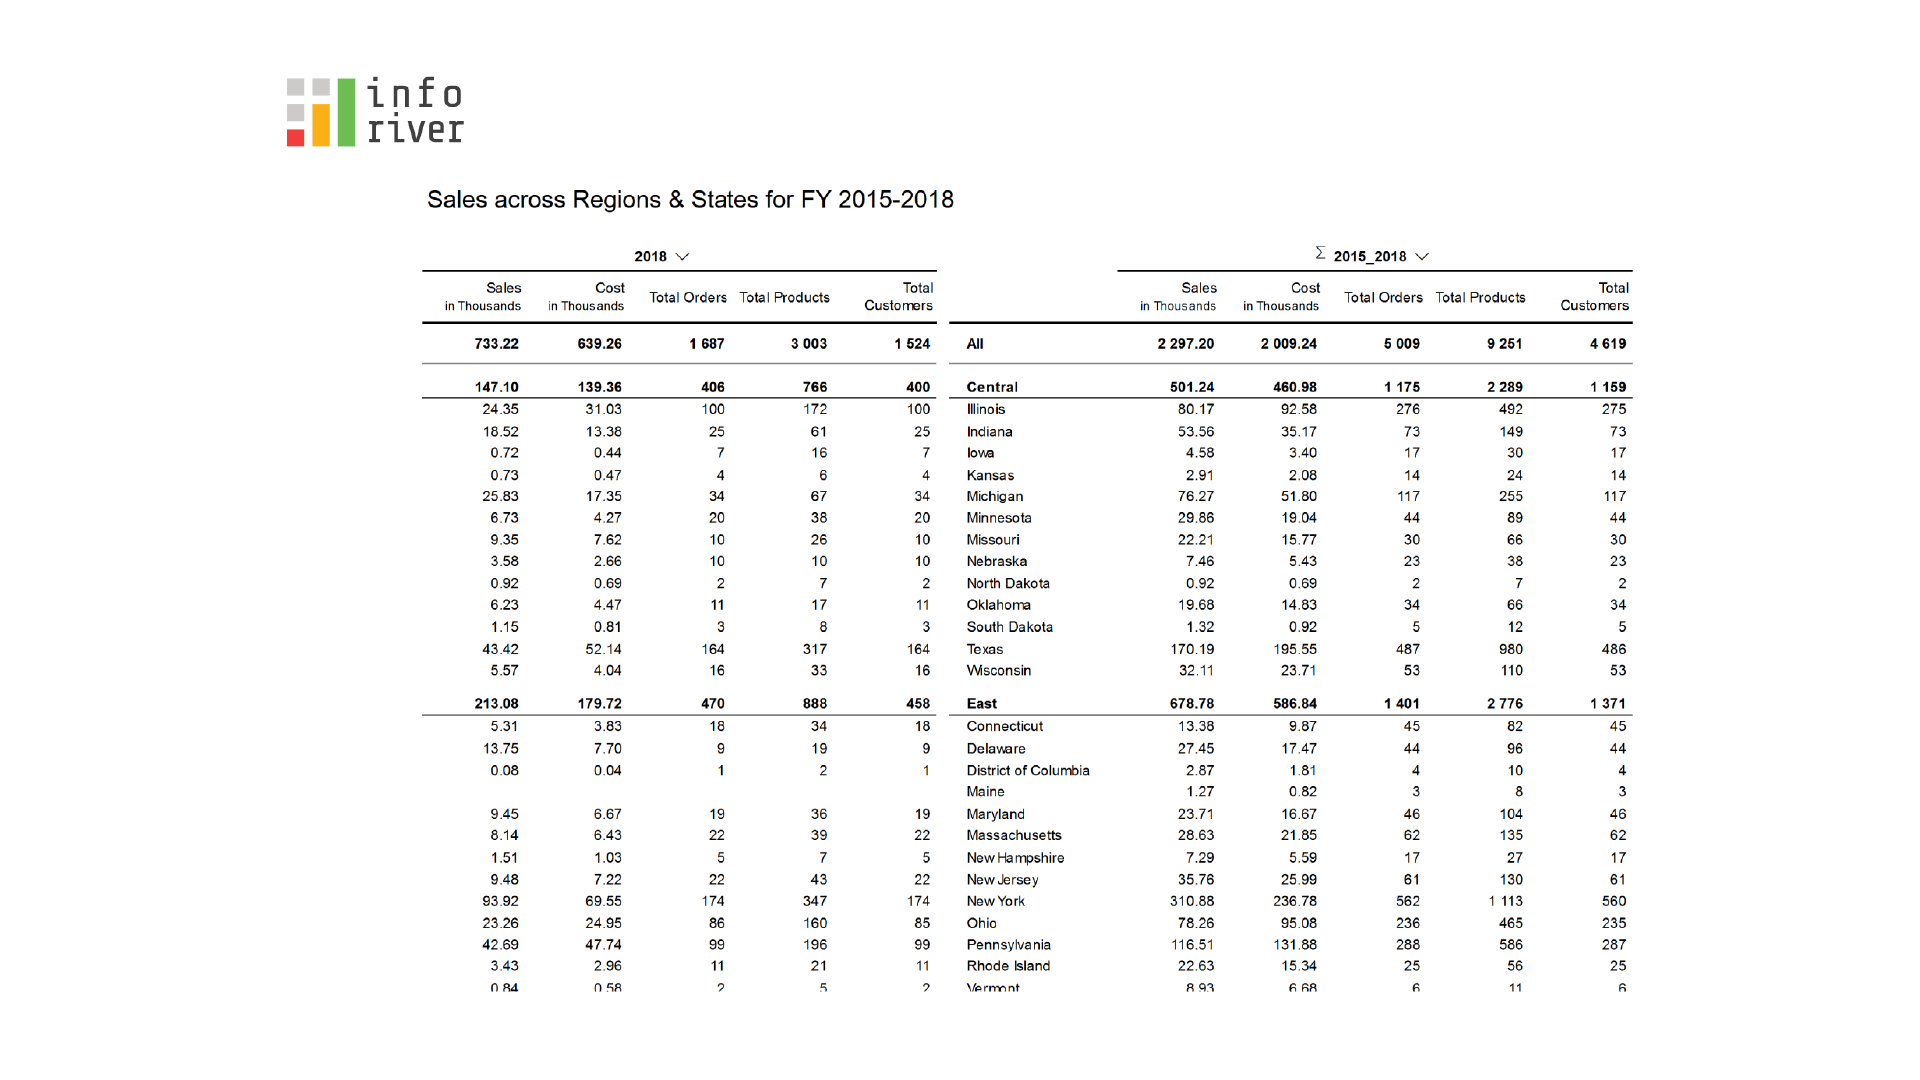
Create dynamic Sales reports with sparkline charts, KPI cards, and bar charts, comparing sales and profit across regions and categories yearly.
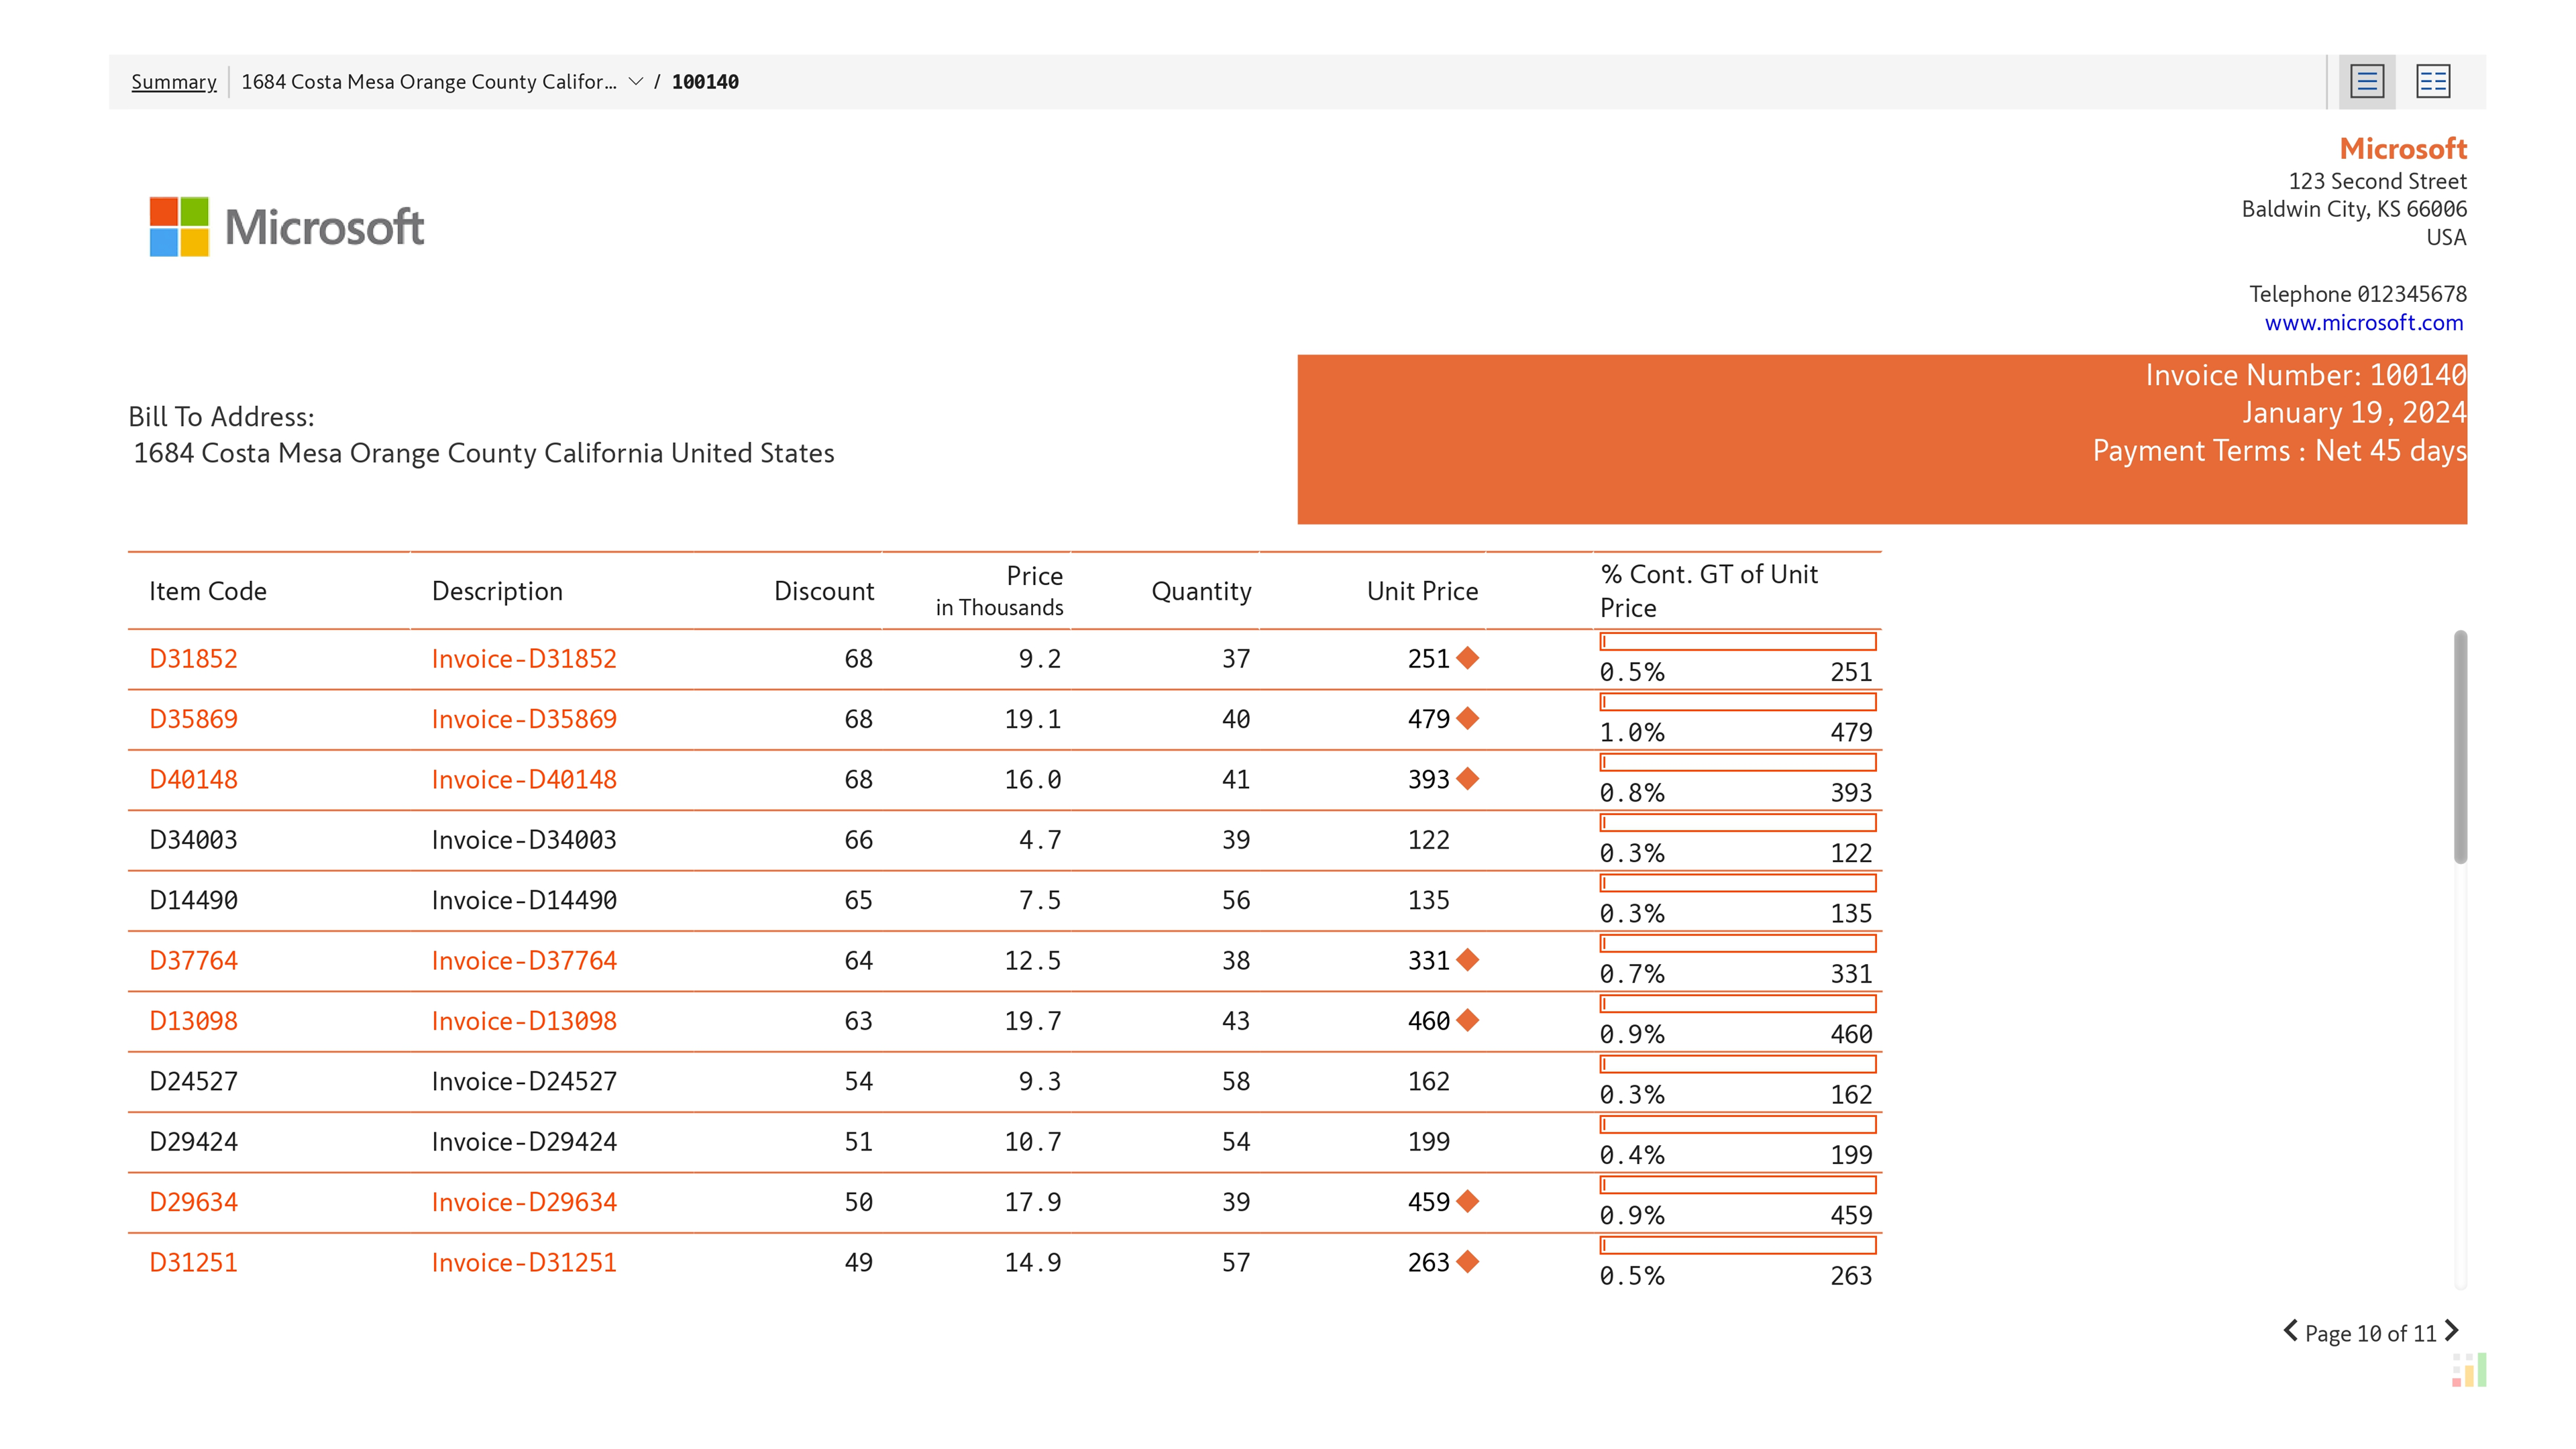
Simplify invoice creation with customizable headers/footers, blended measures, and easy PDF export.
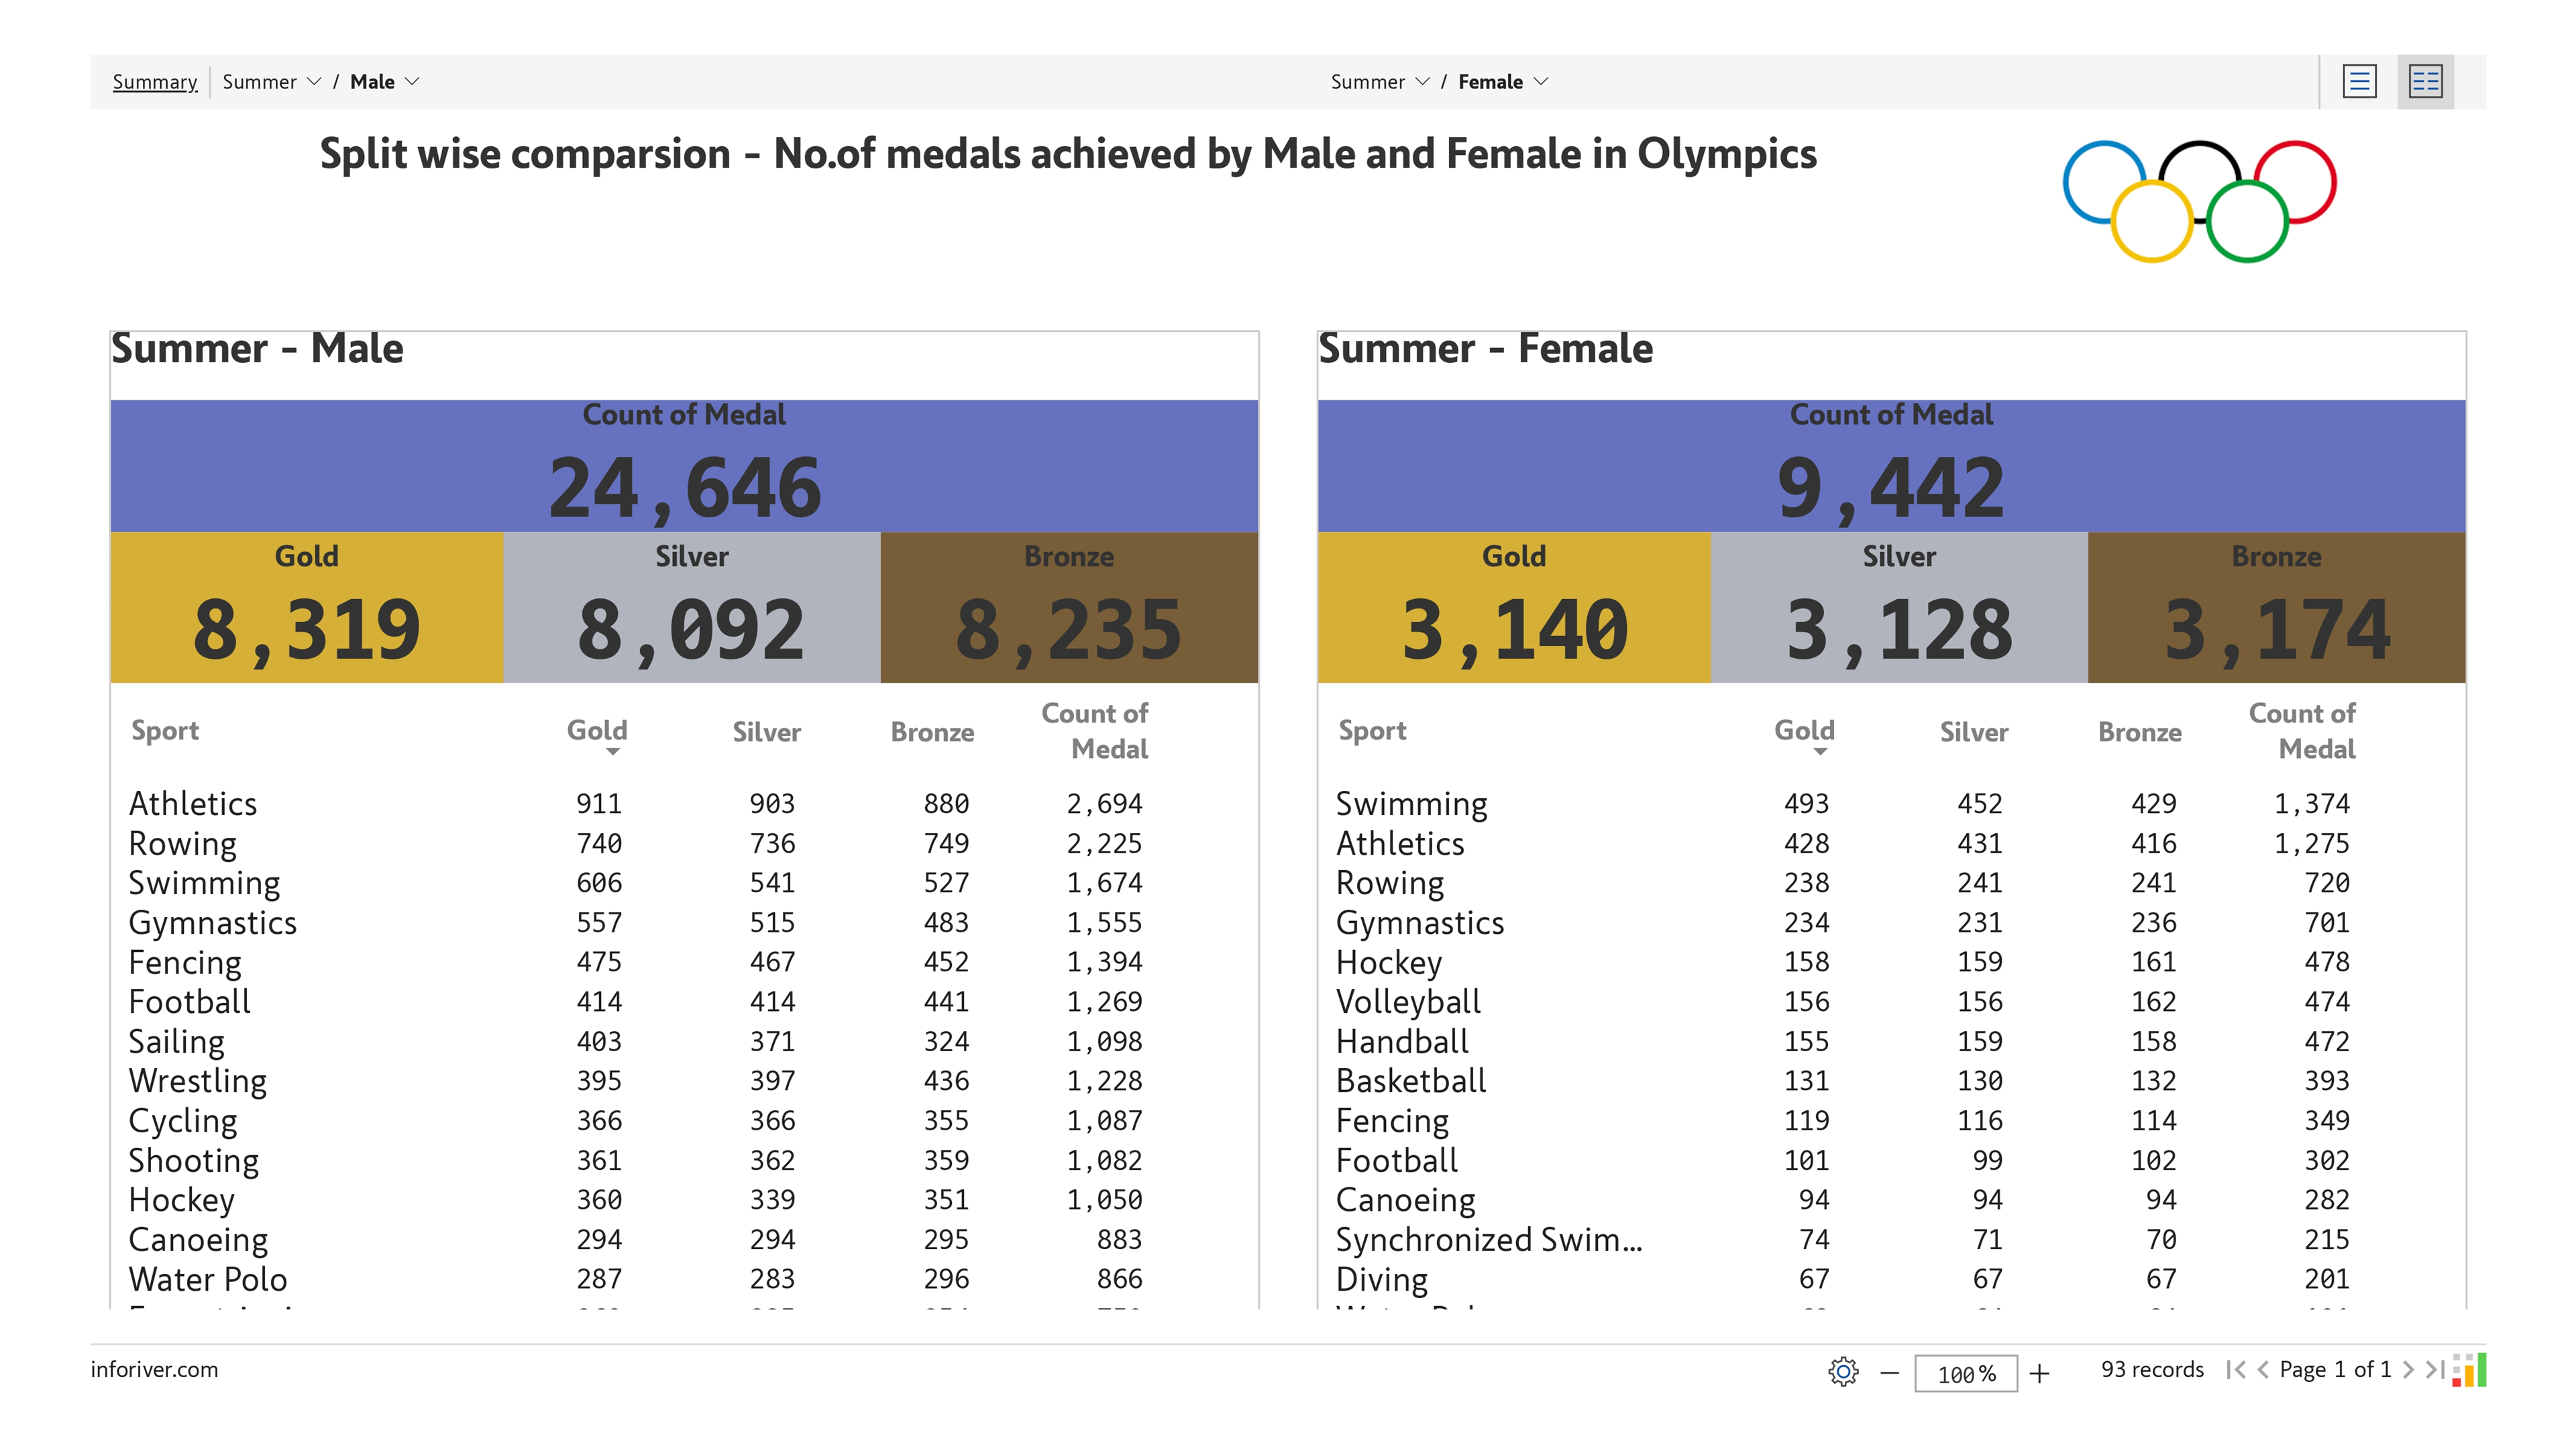
Inforiver Matrix's Report+ compares men and women's Olympic medals by event for both Summer and Winter Games.
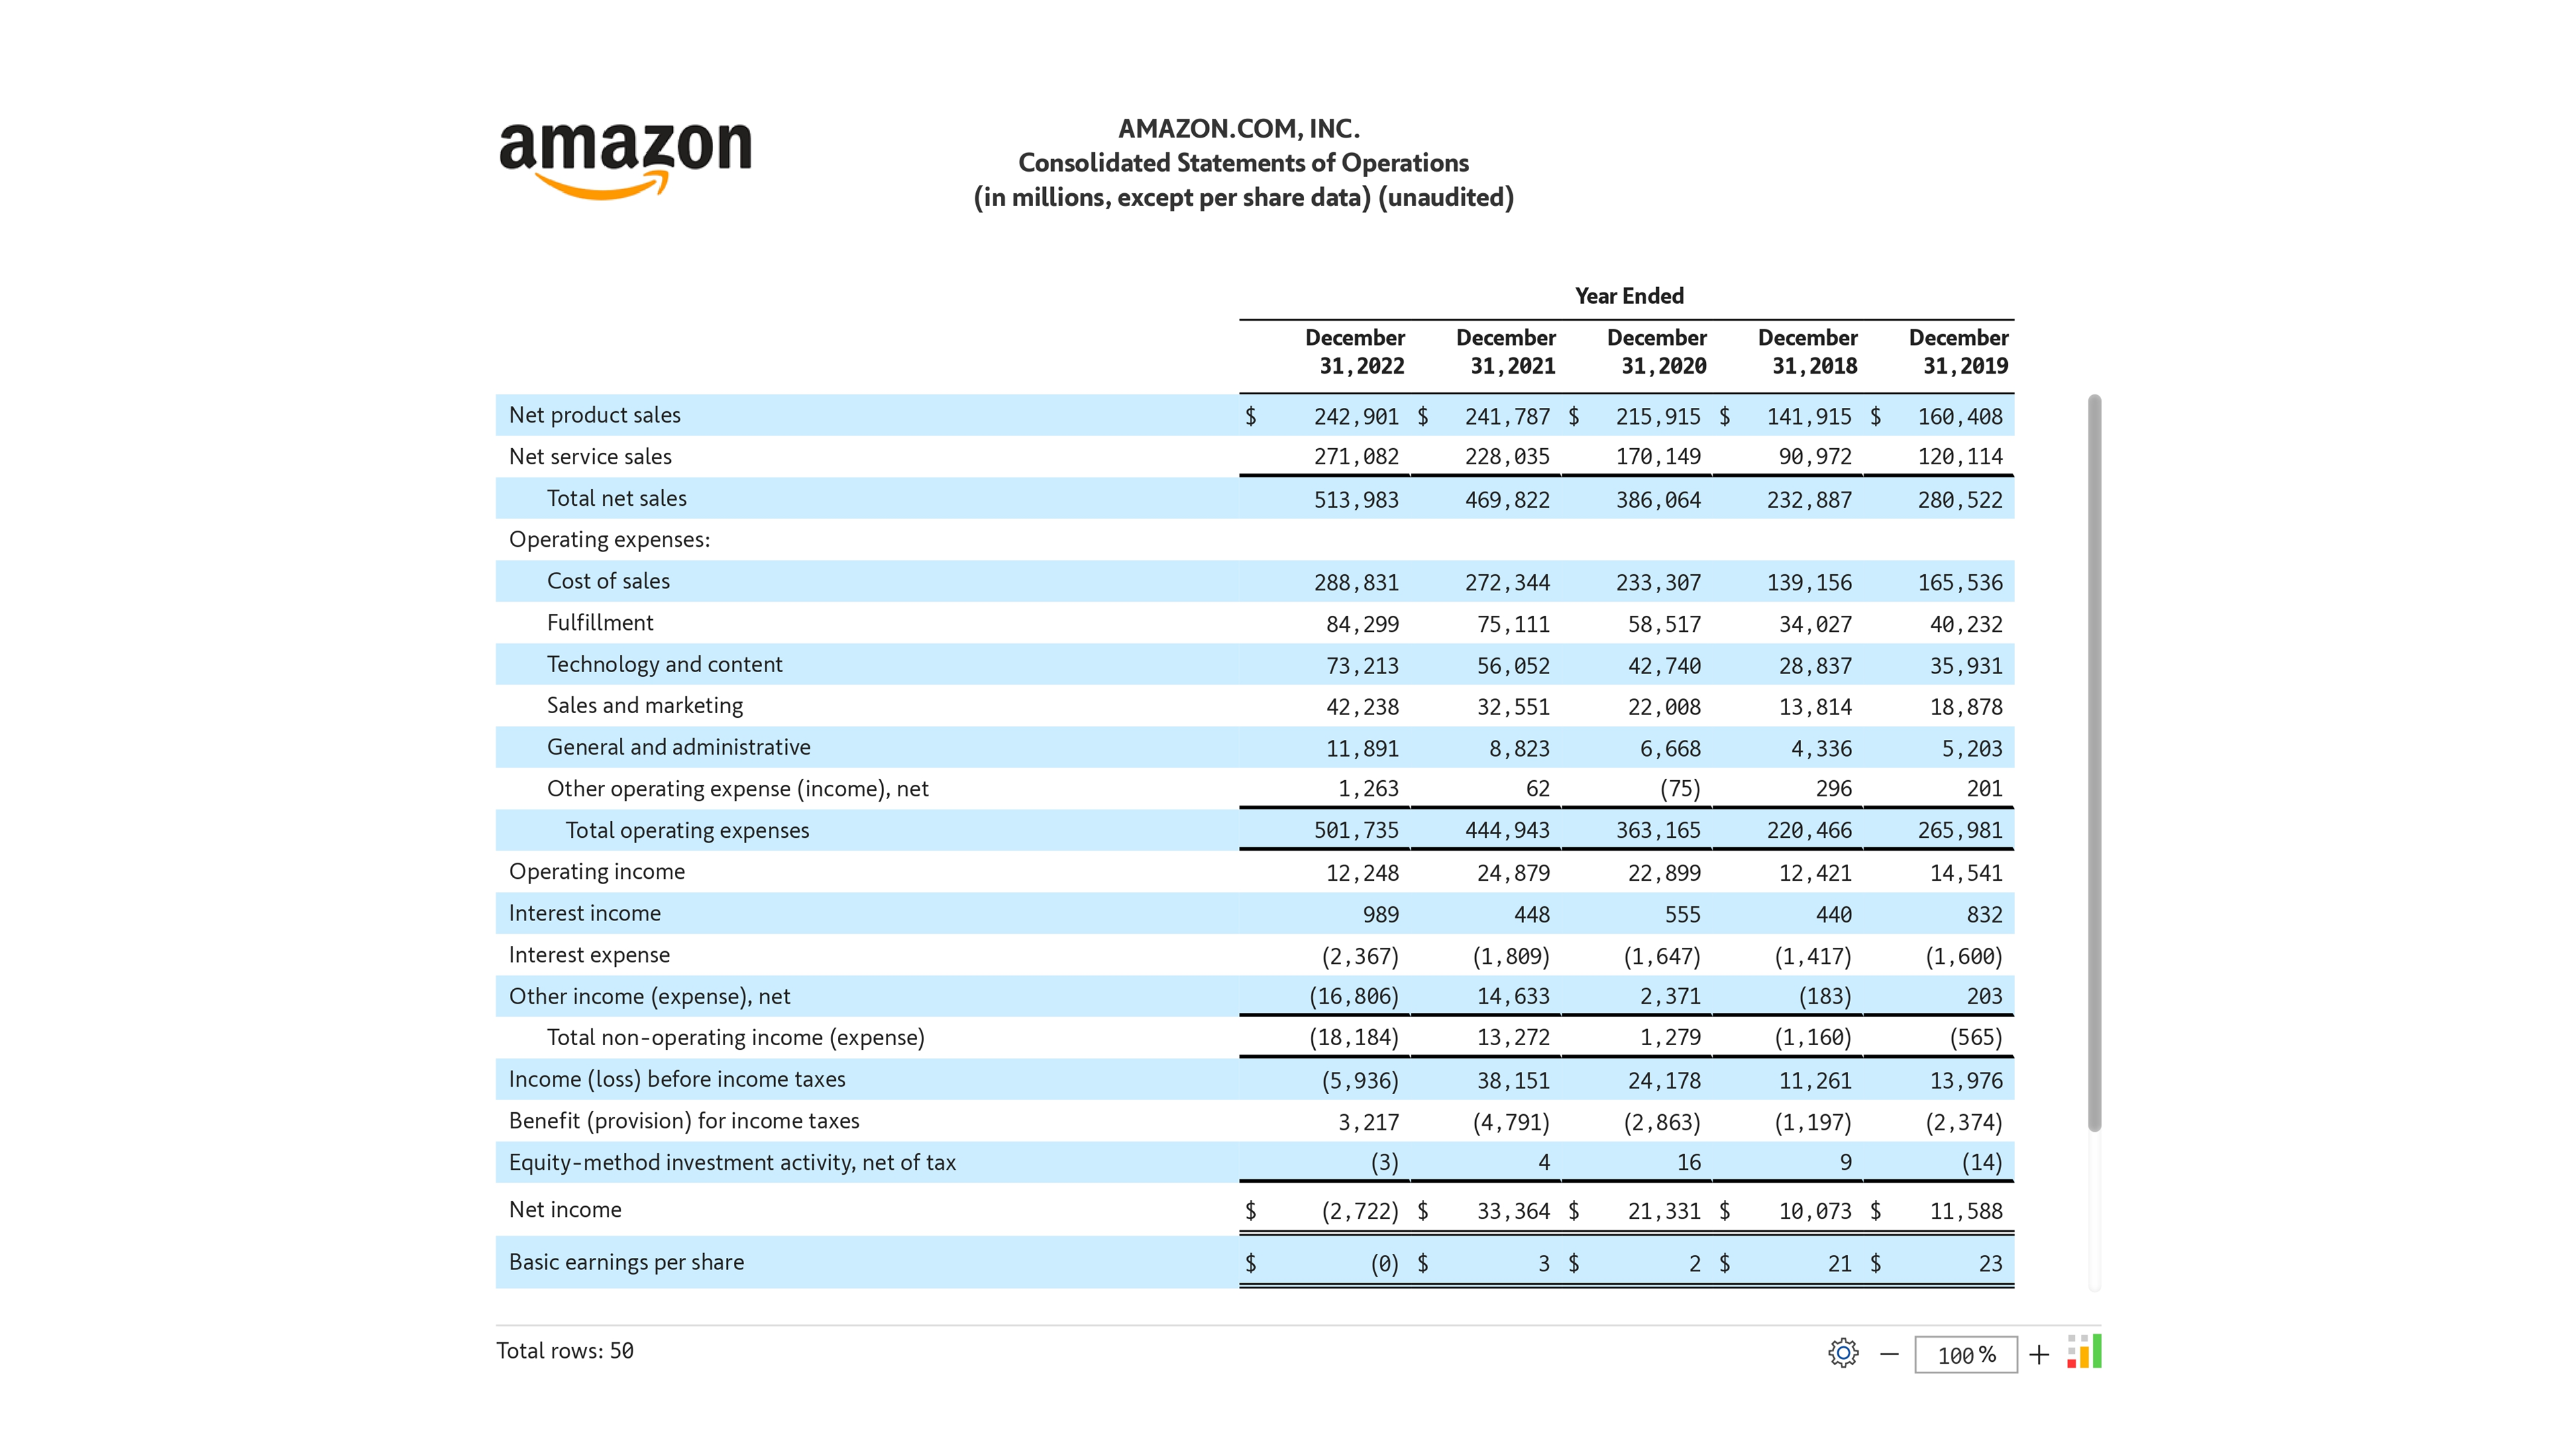
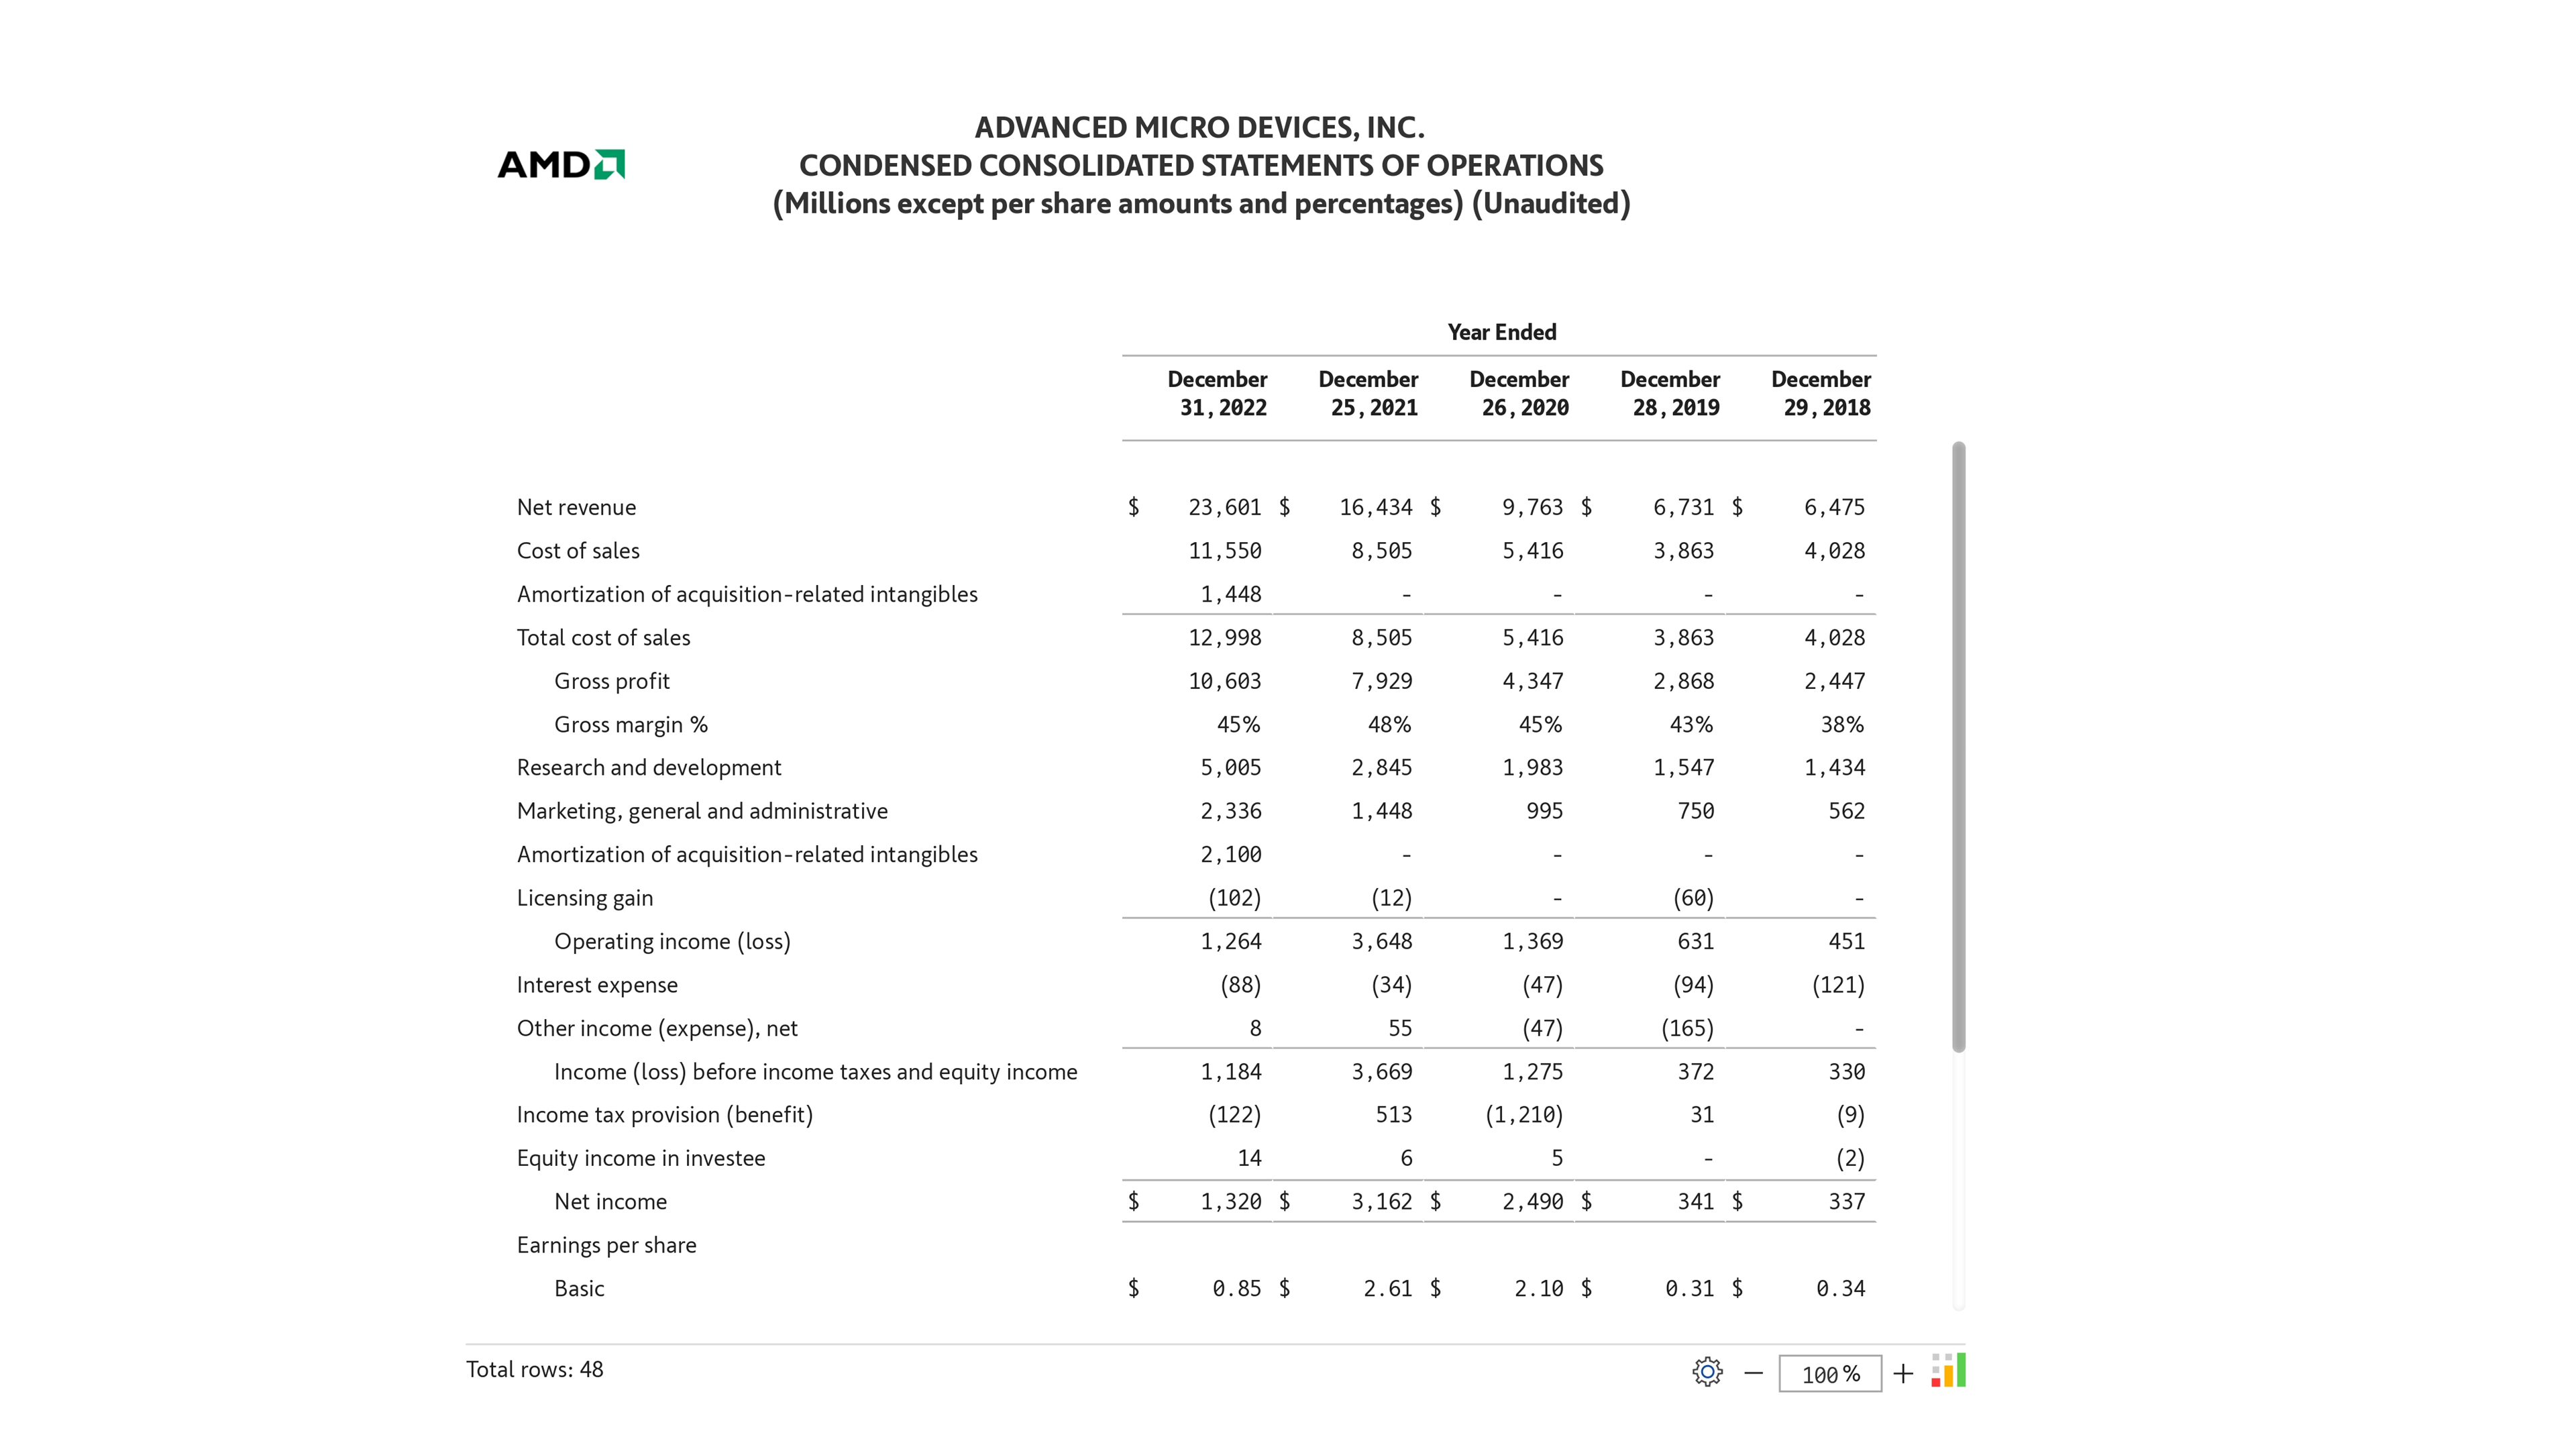
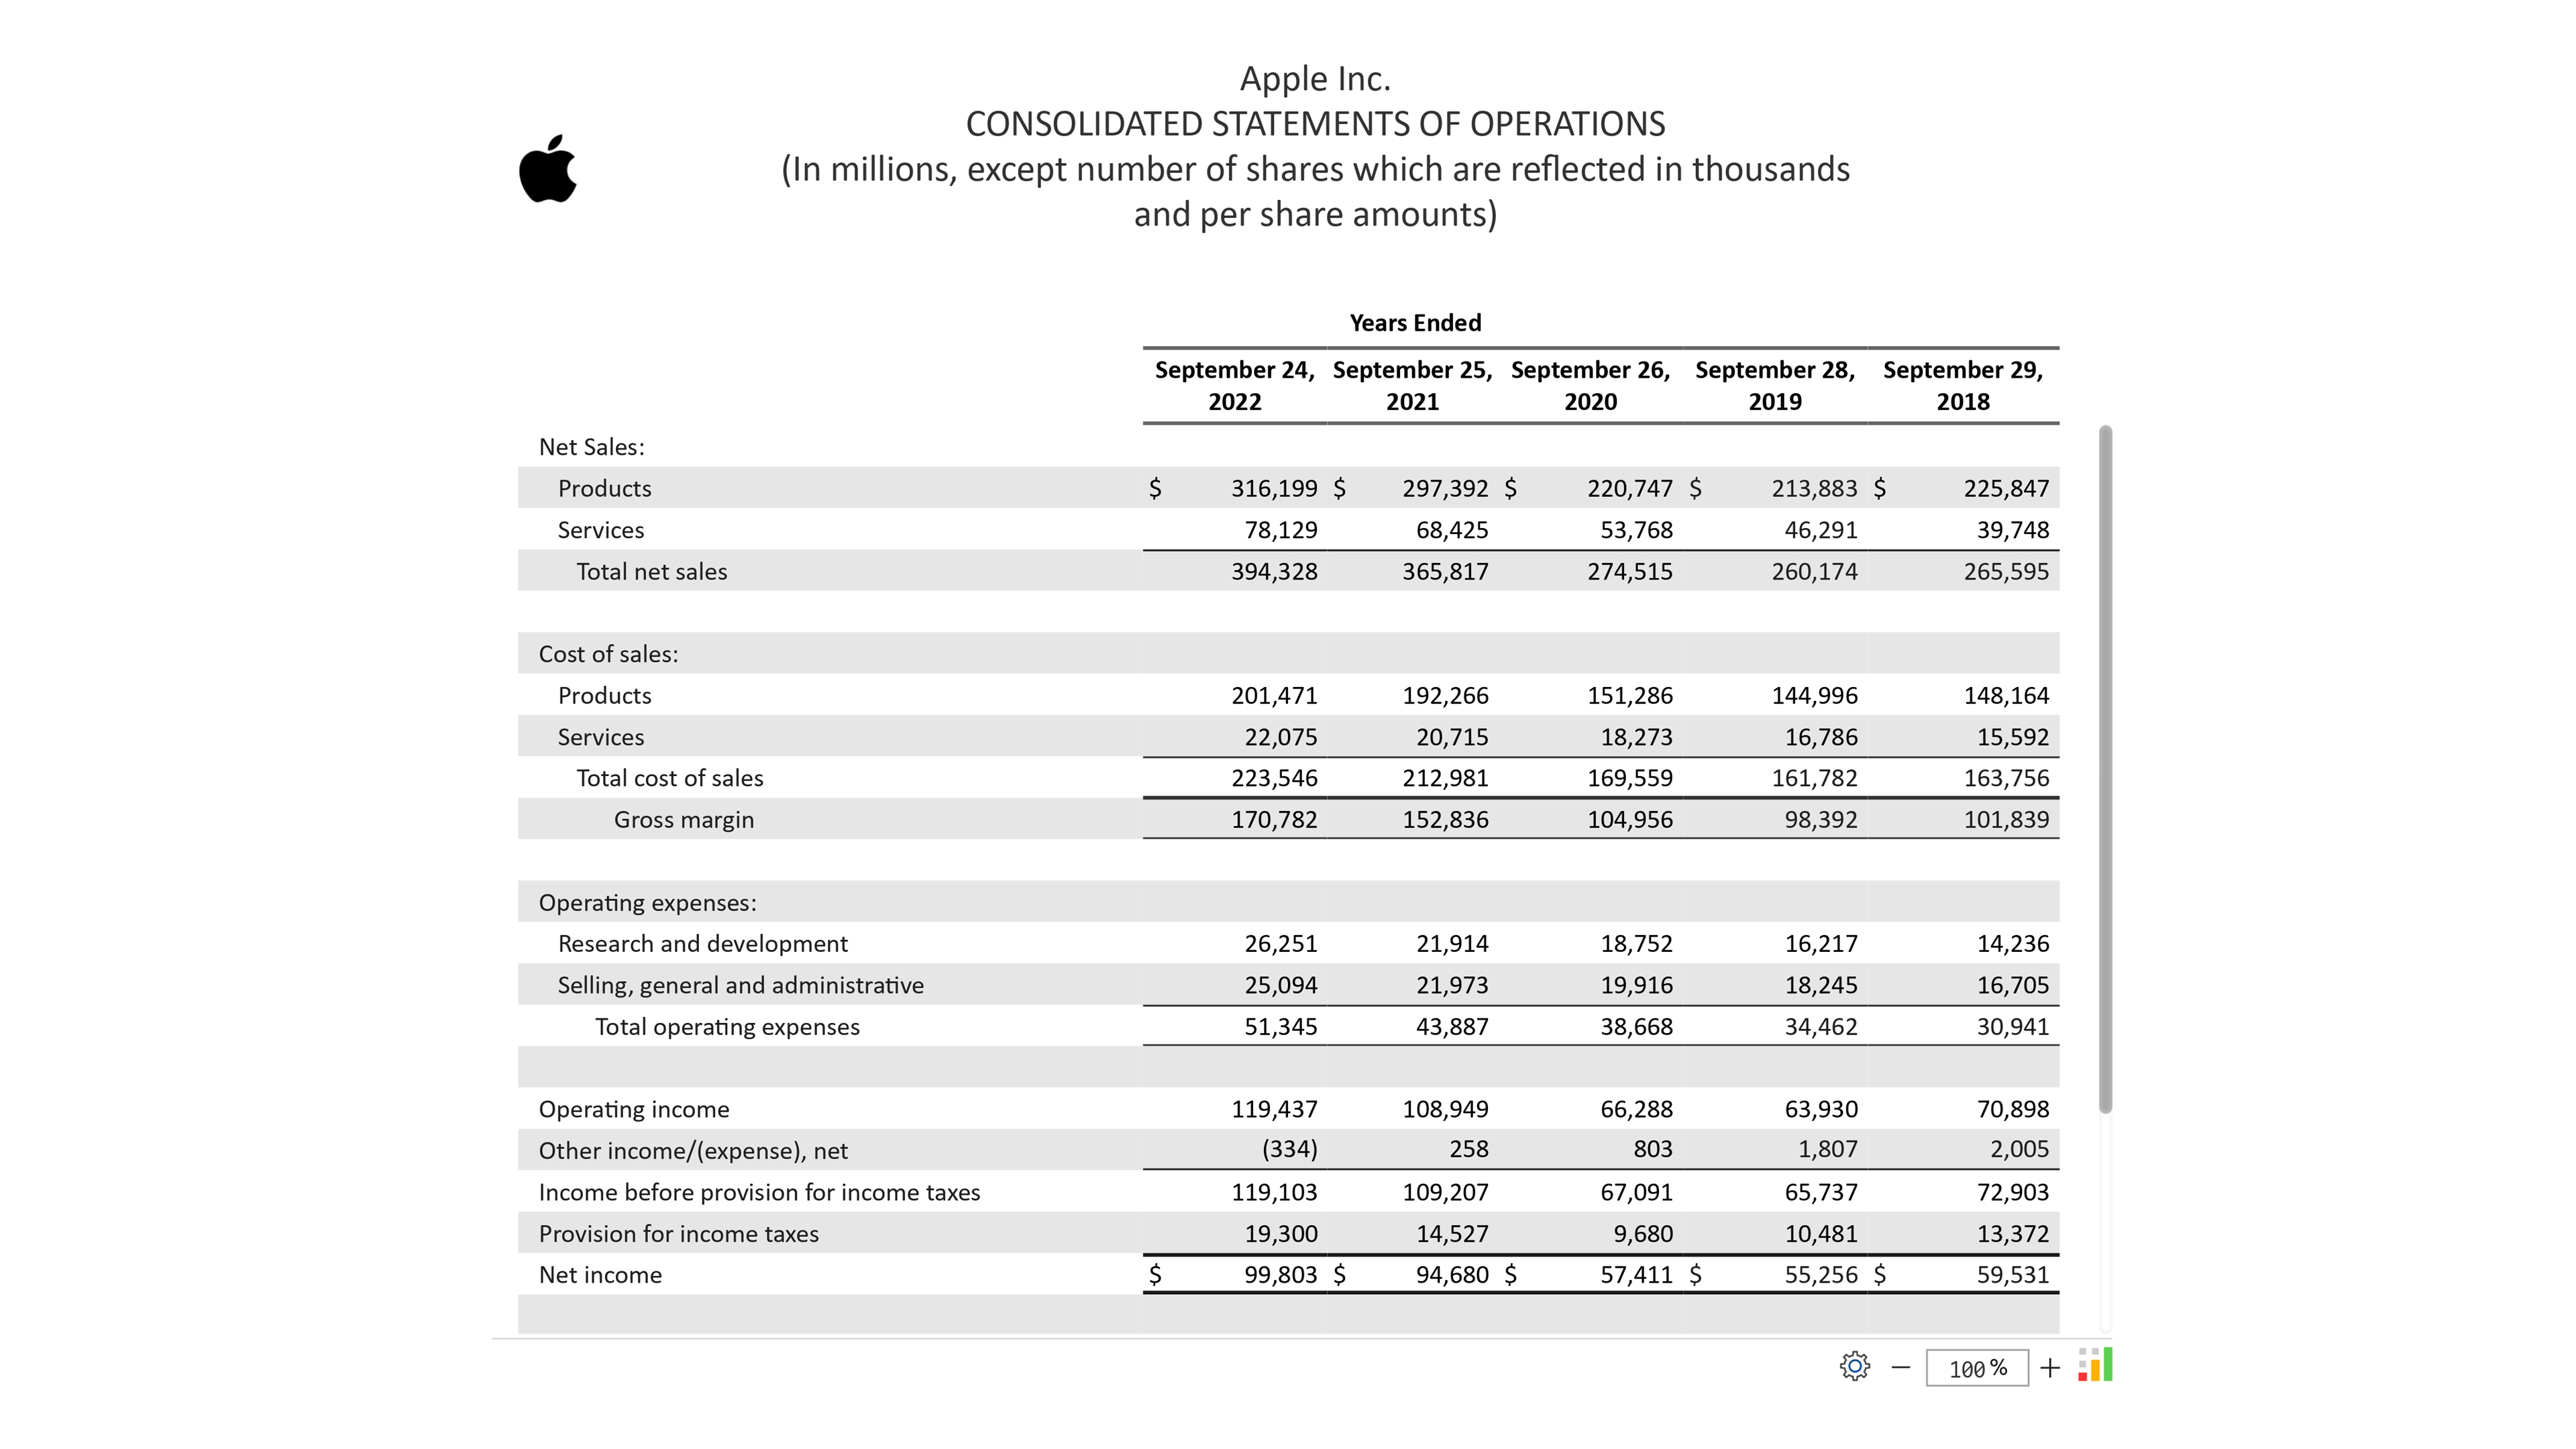
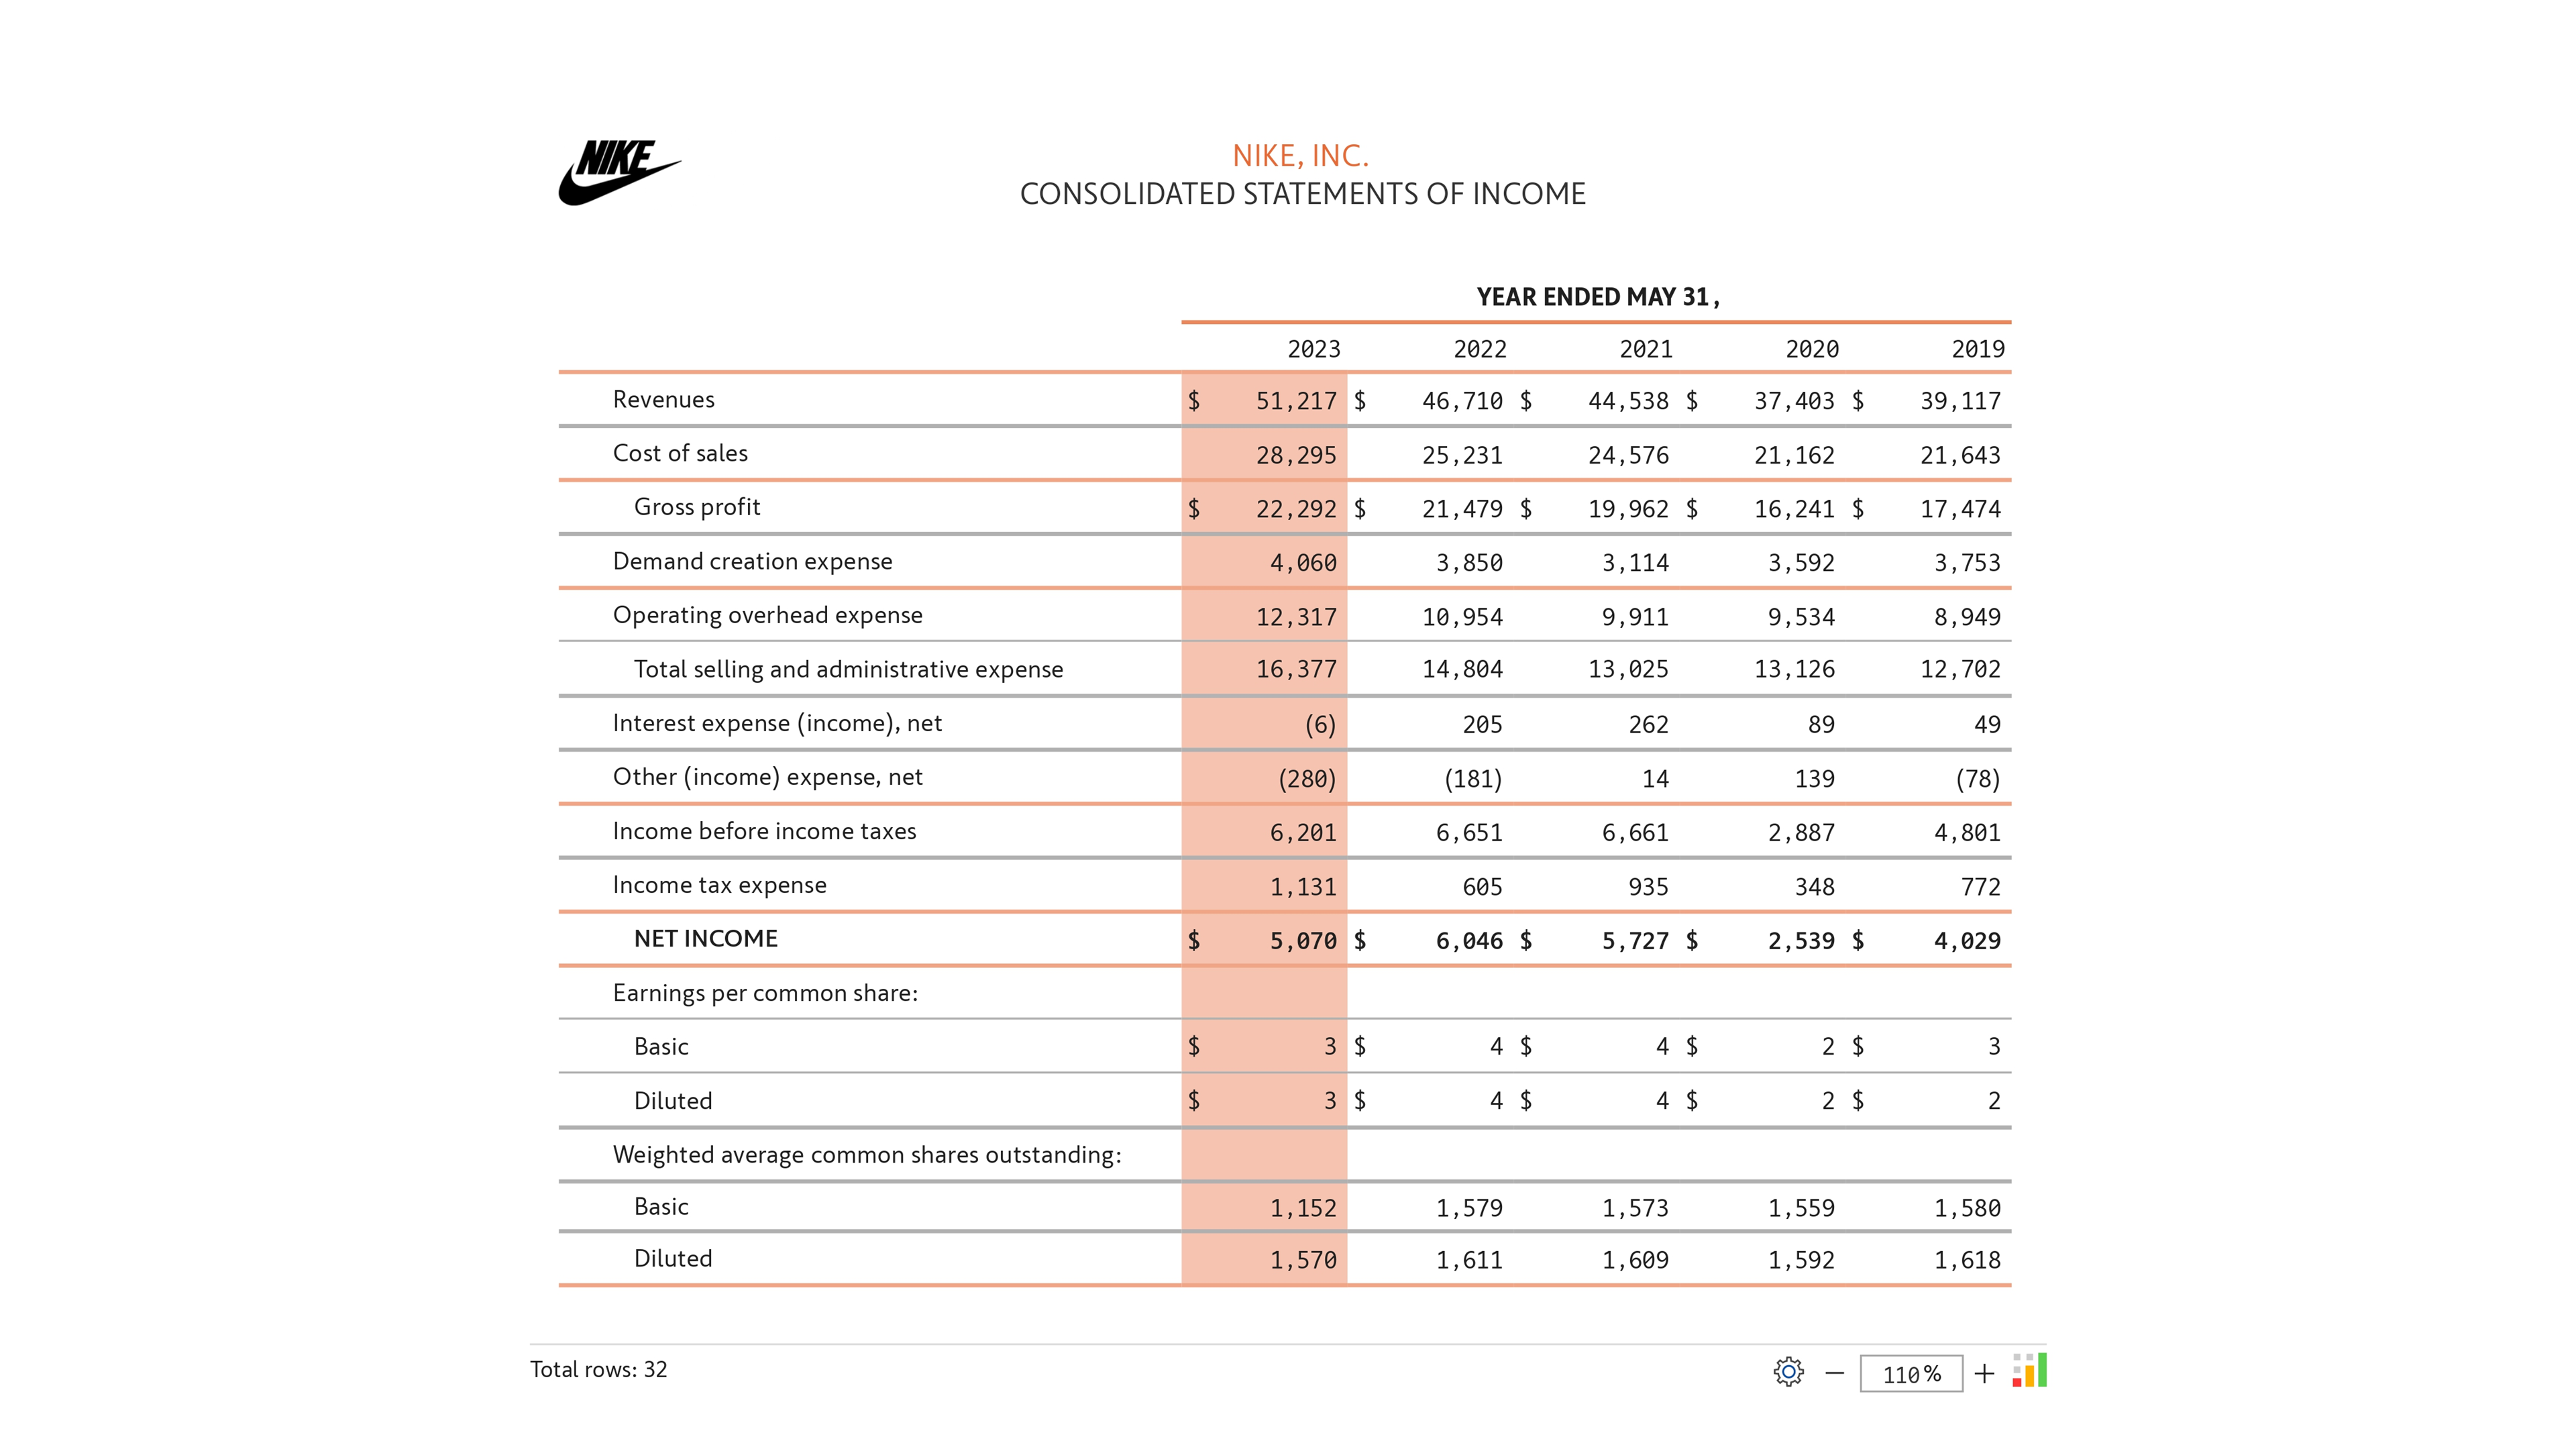
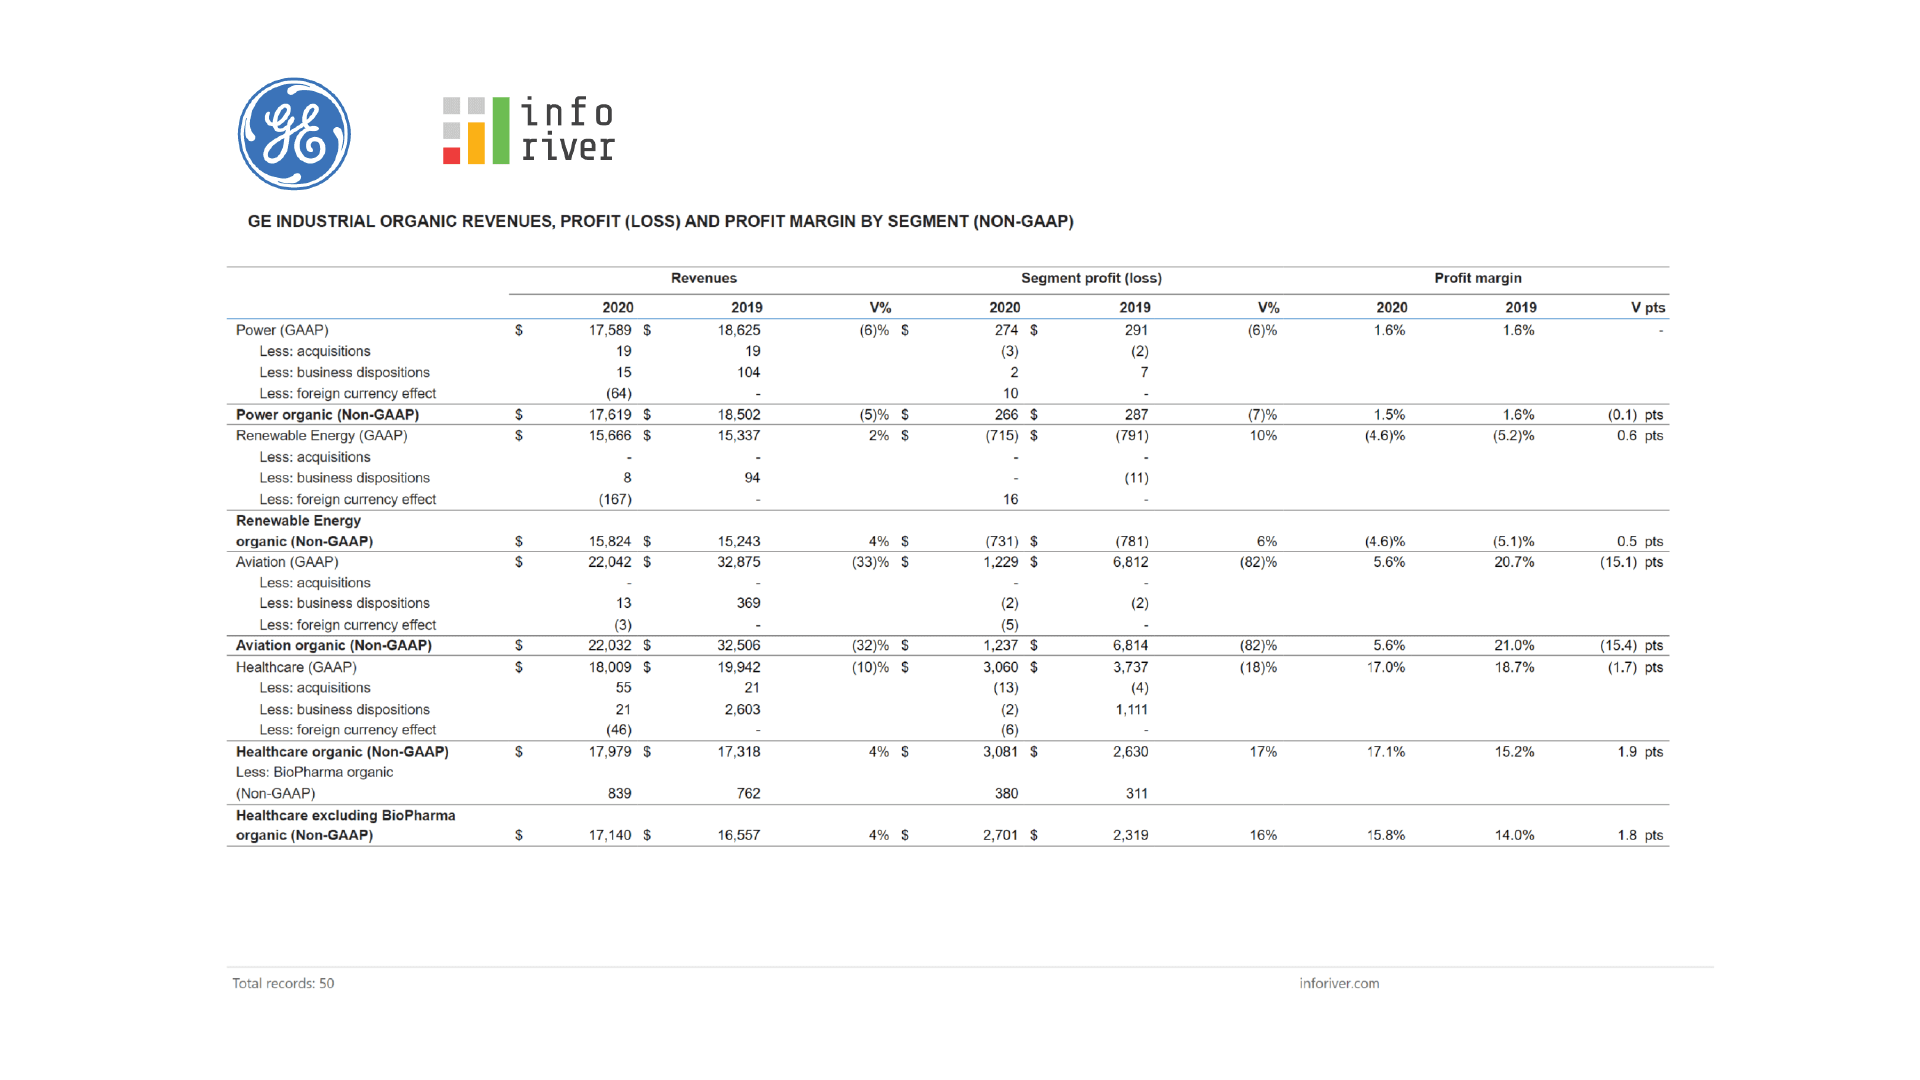
Insert calculated, static and contribution rows and columns in financial statements without the need for DAX.
Leverage support for ragged/unbalanced hierarchies, extensive formatting options and intuitive totals & subtotals management.
Export formatted financial reports with customizable headers and footers; set indentation for account names, apply borders and more.
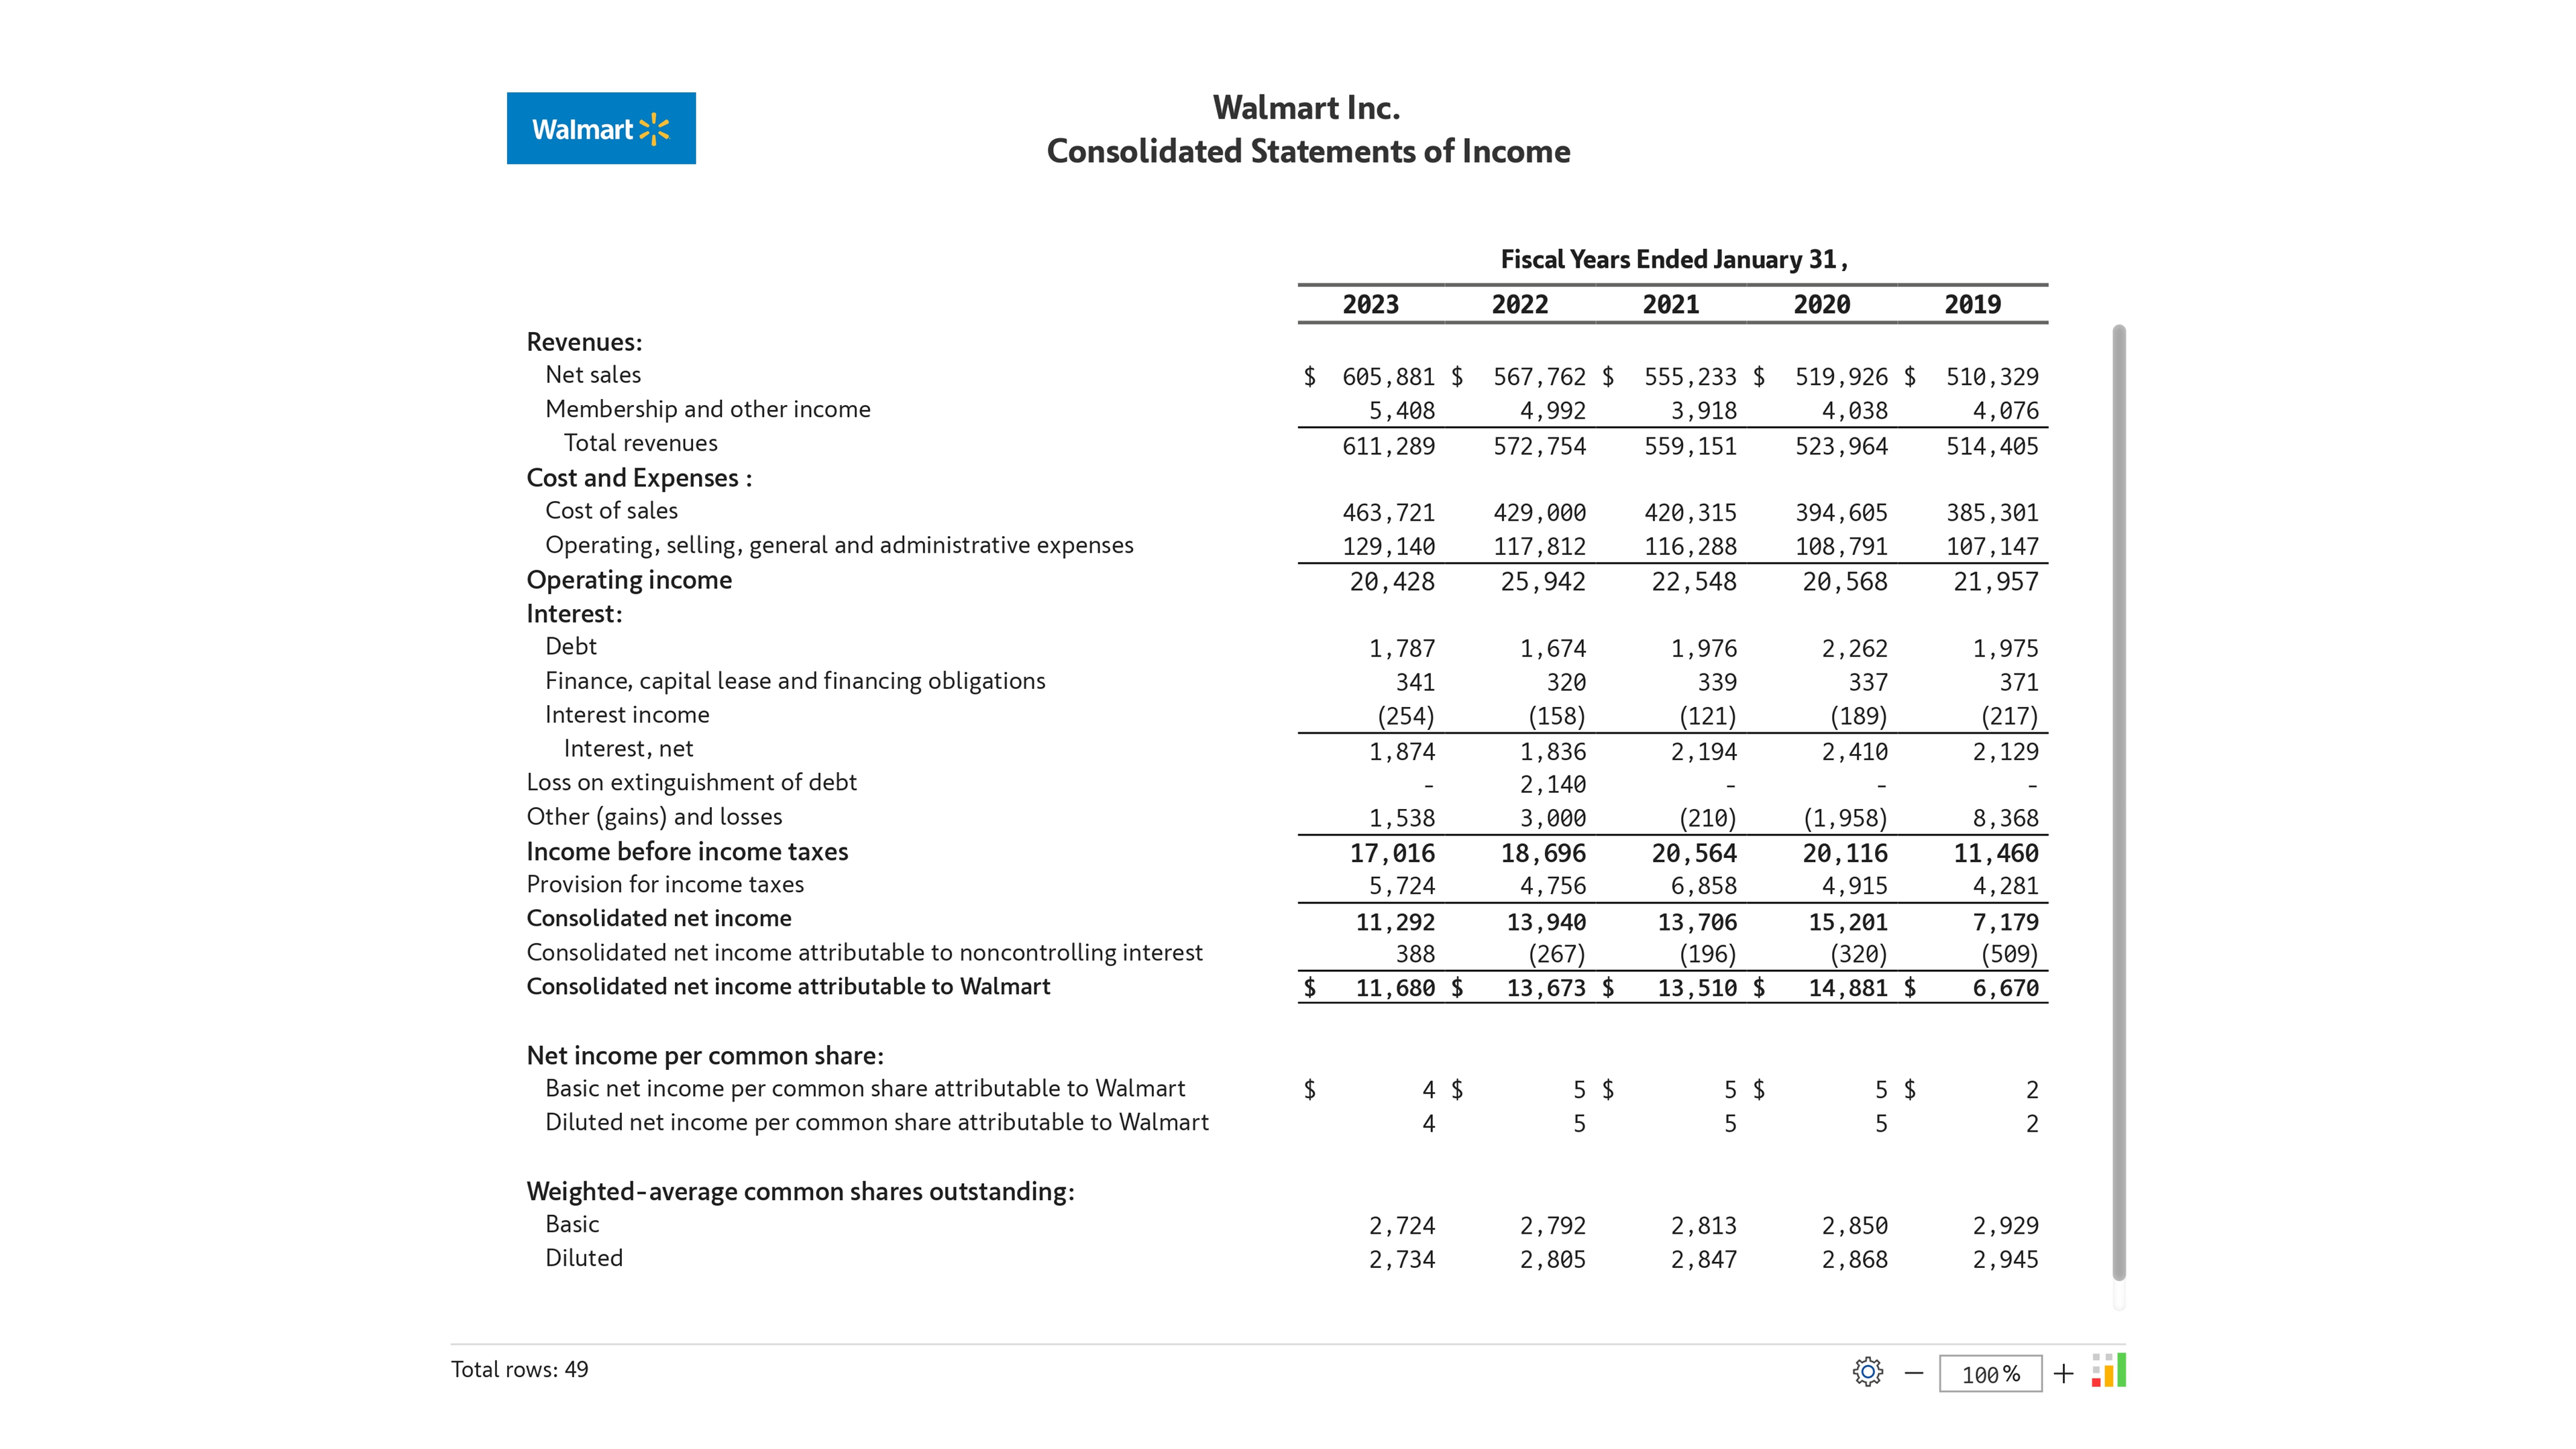
Create financial statements by leveraging Inforiver's intelligent and automated number formatting capability.
Explore the flexibility and power of spreadsheet-like features, functions and a familiar user interface.
Experience the low code/no code approach; simply assign the data and customize without the need for programming.
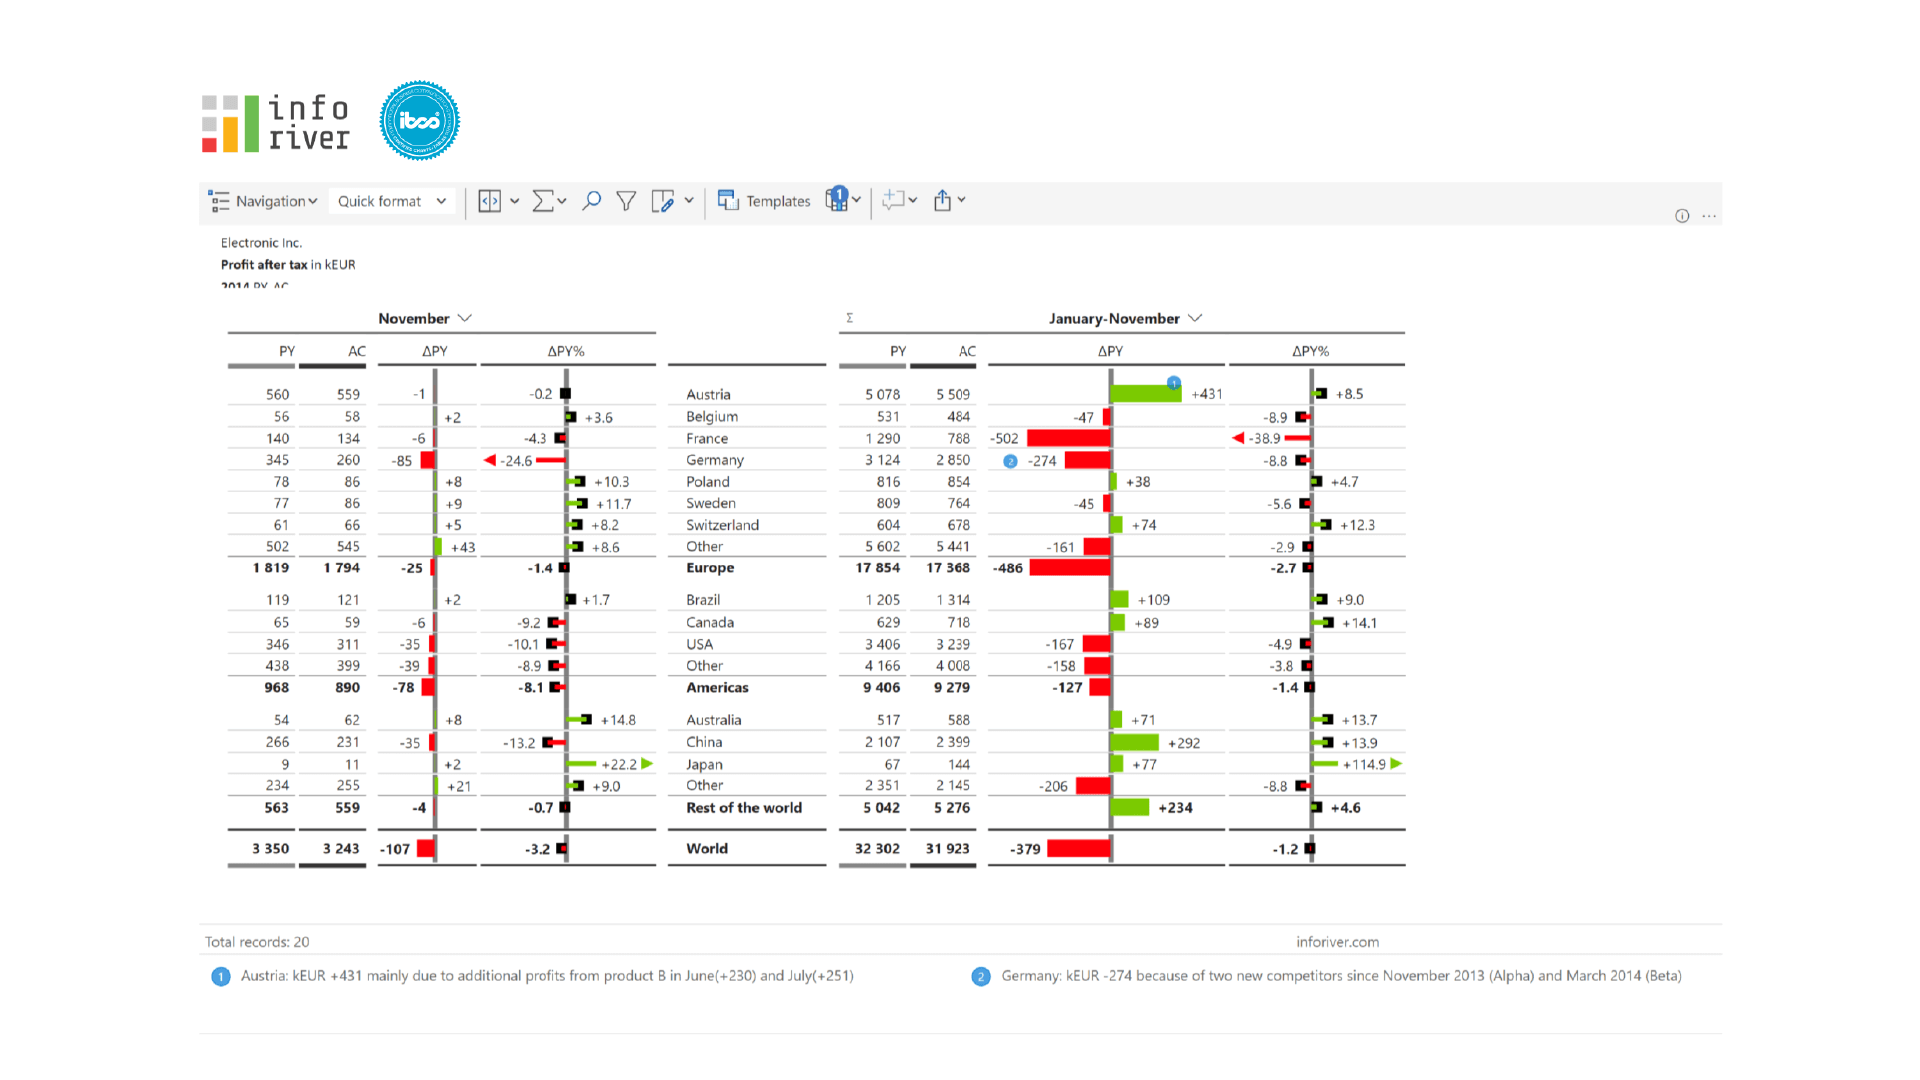
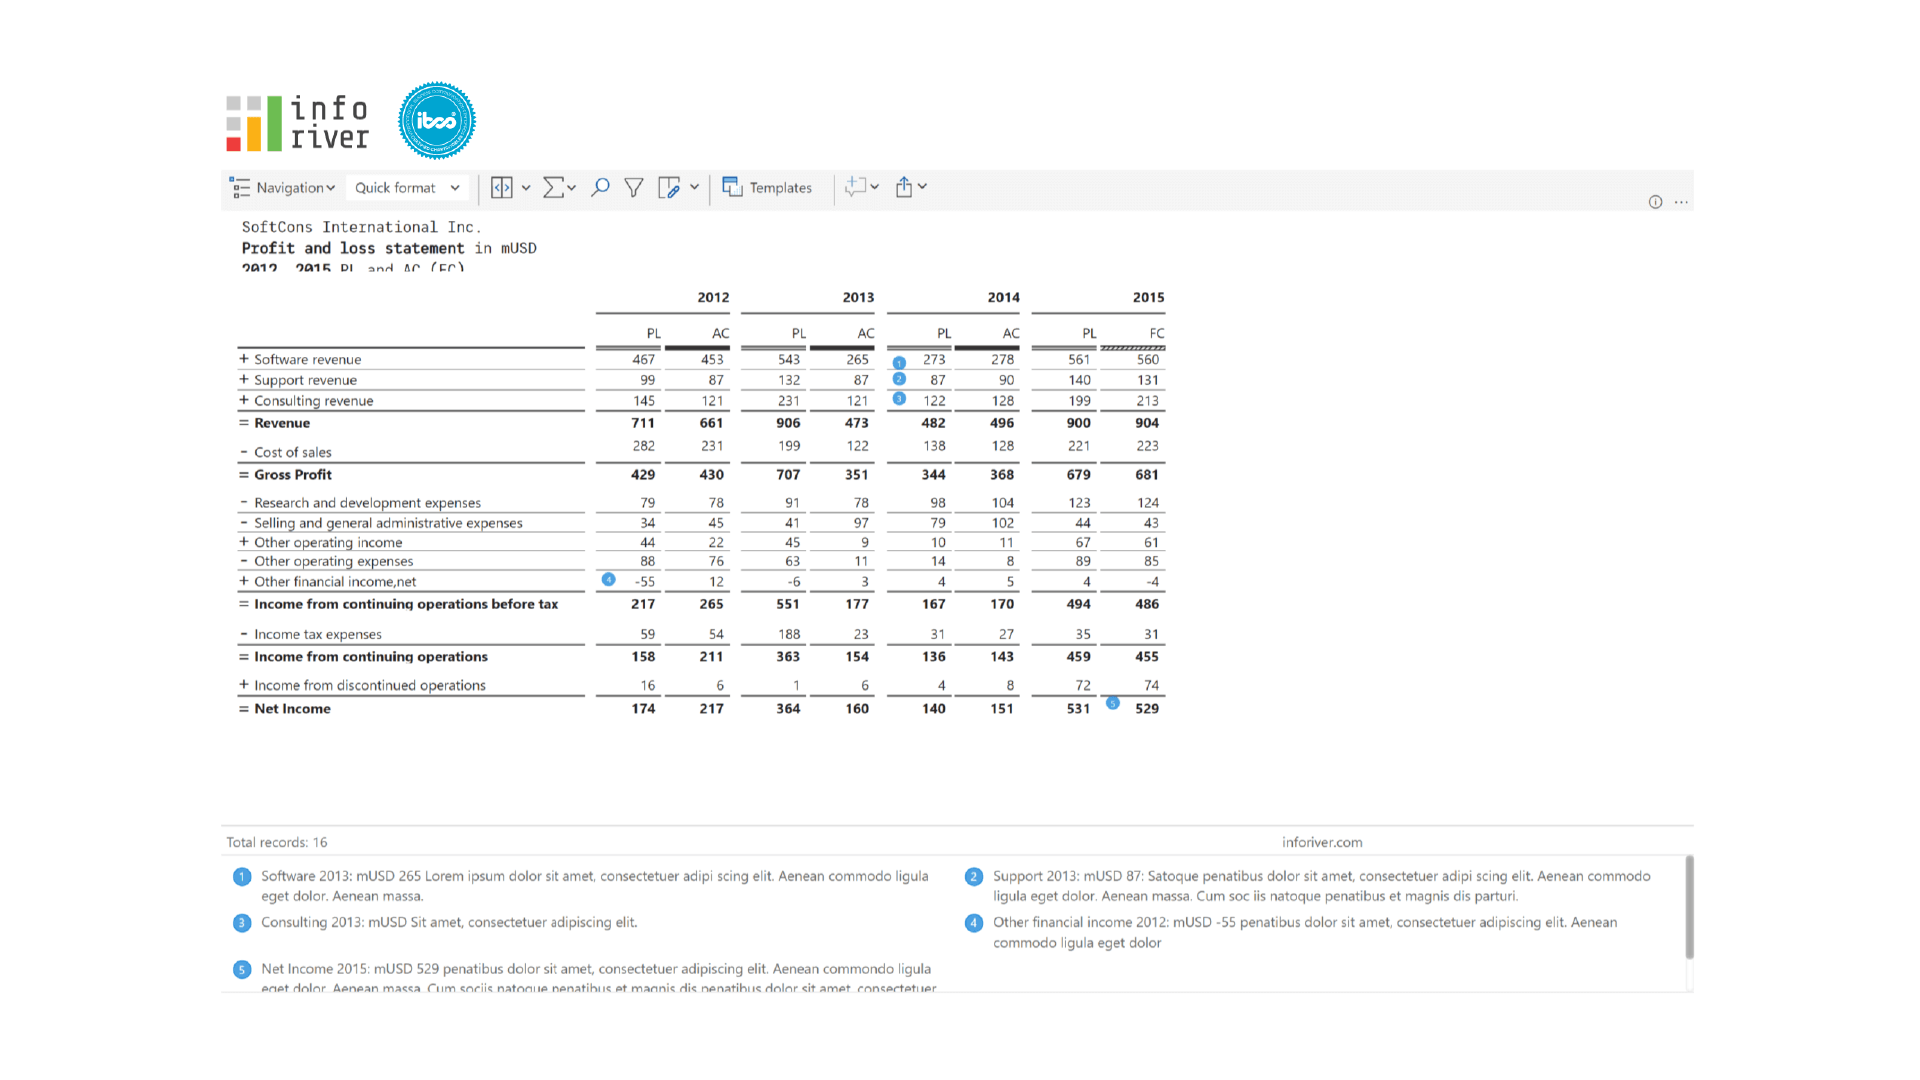
Employ features such as integrated inline, footer & column-based commenting and annotations.
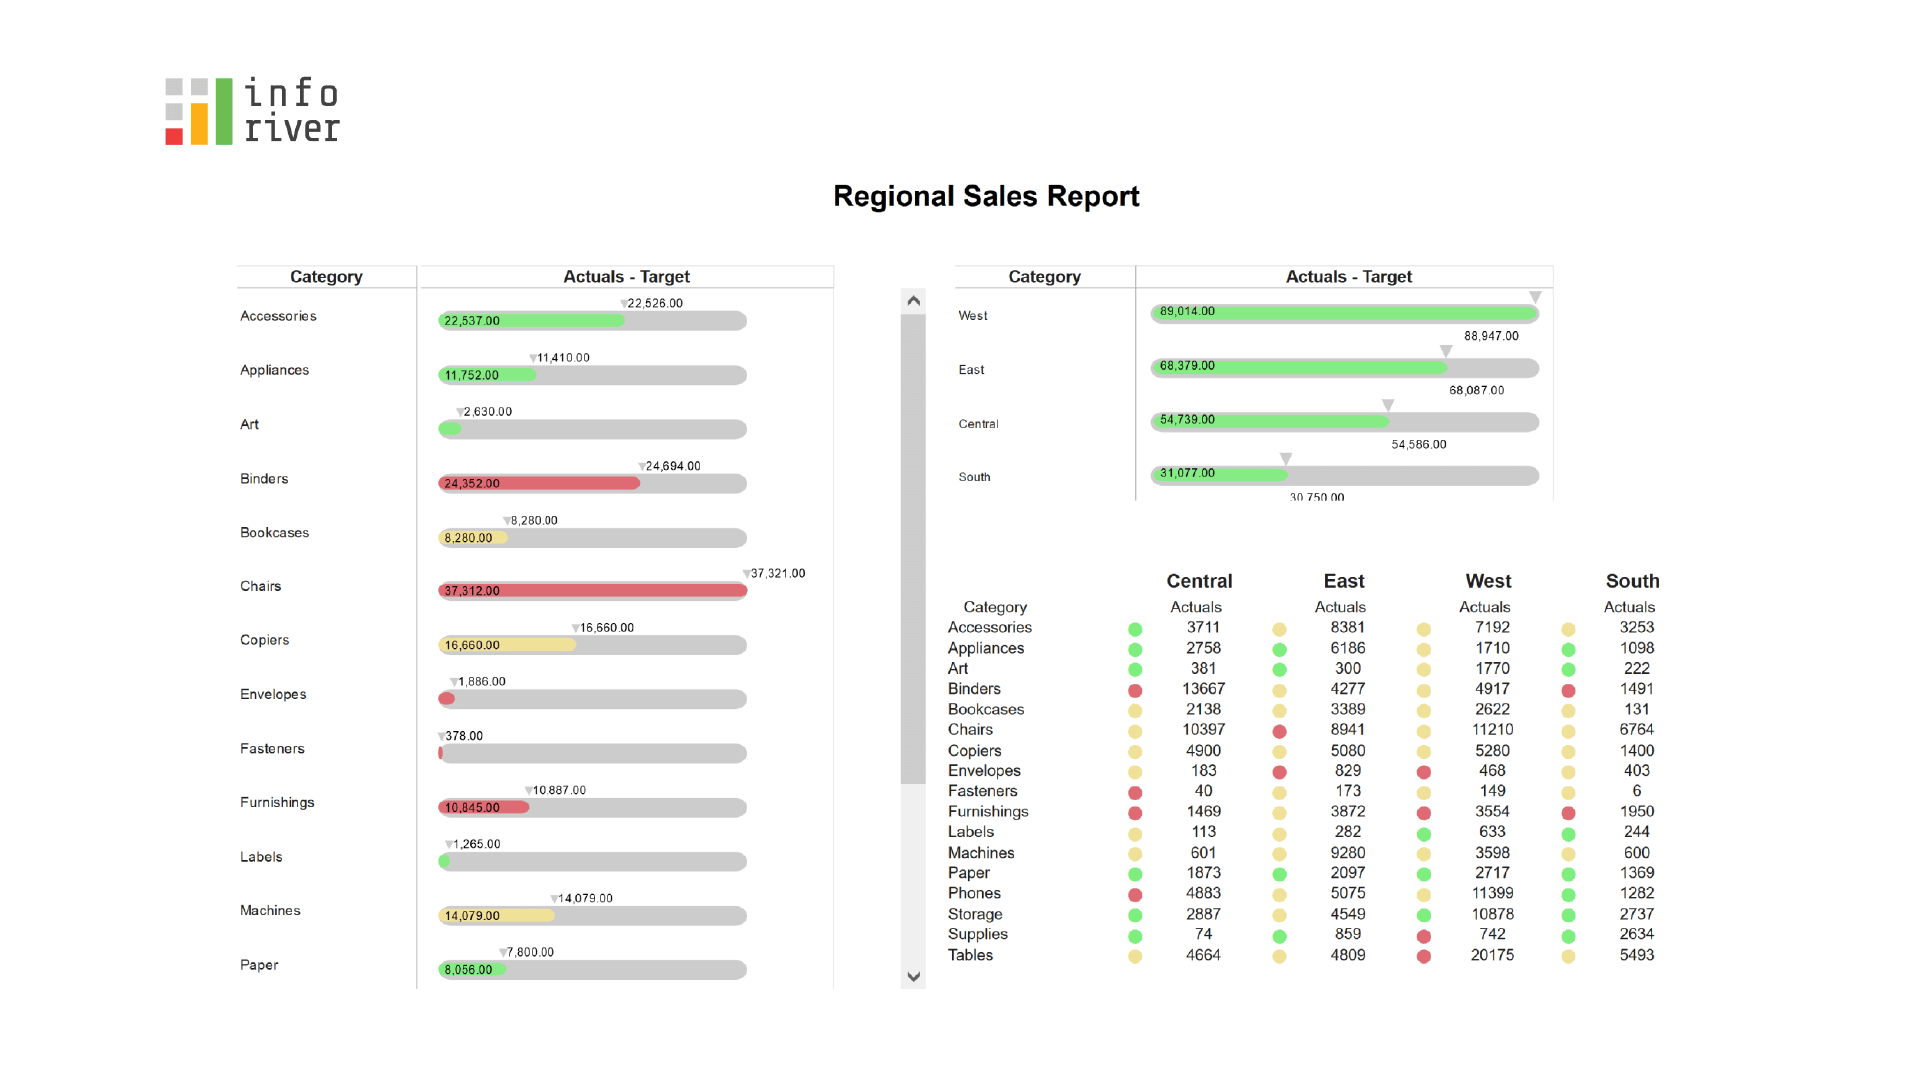
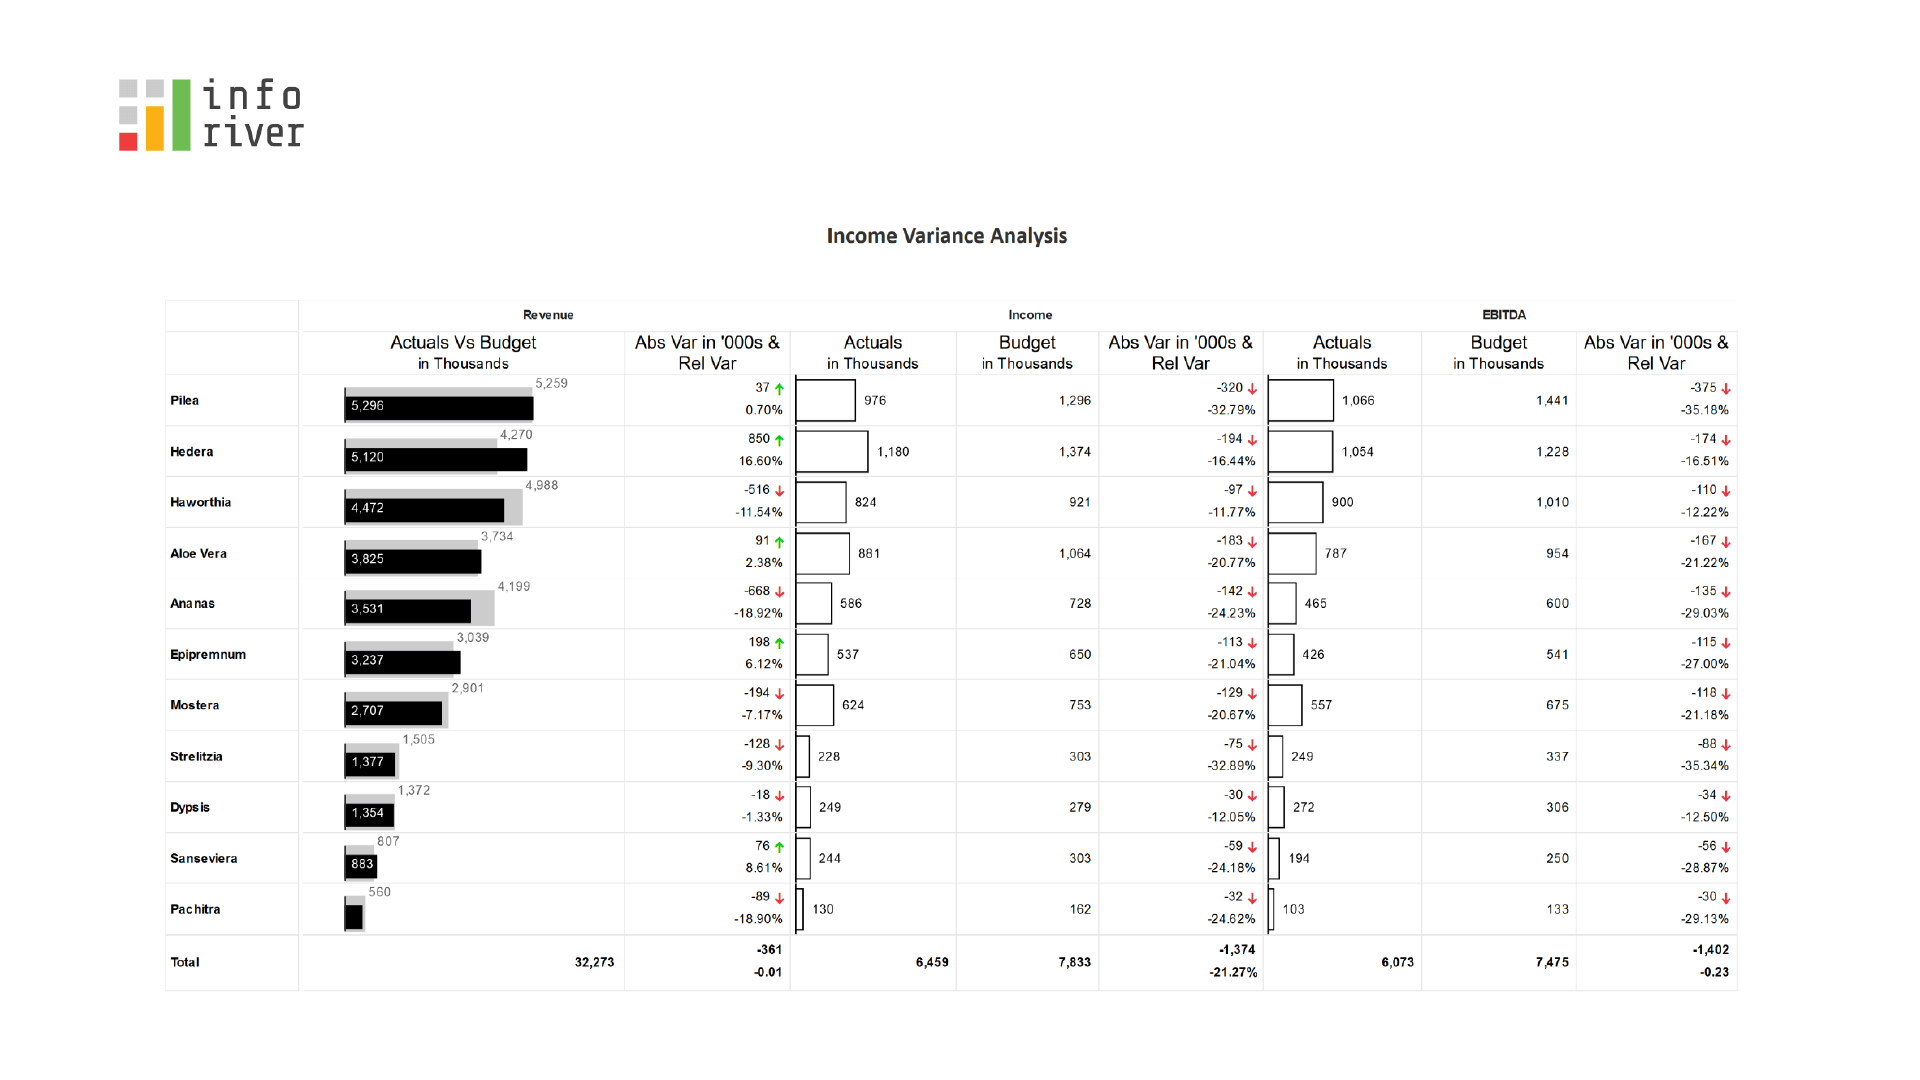
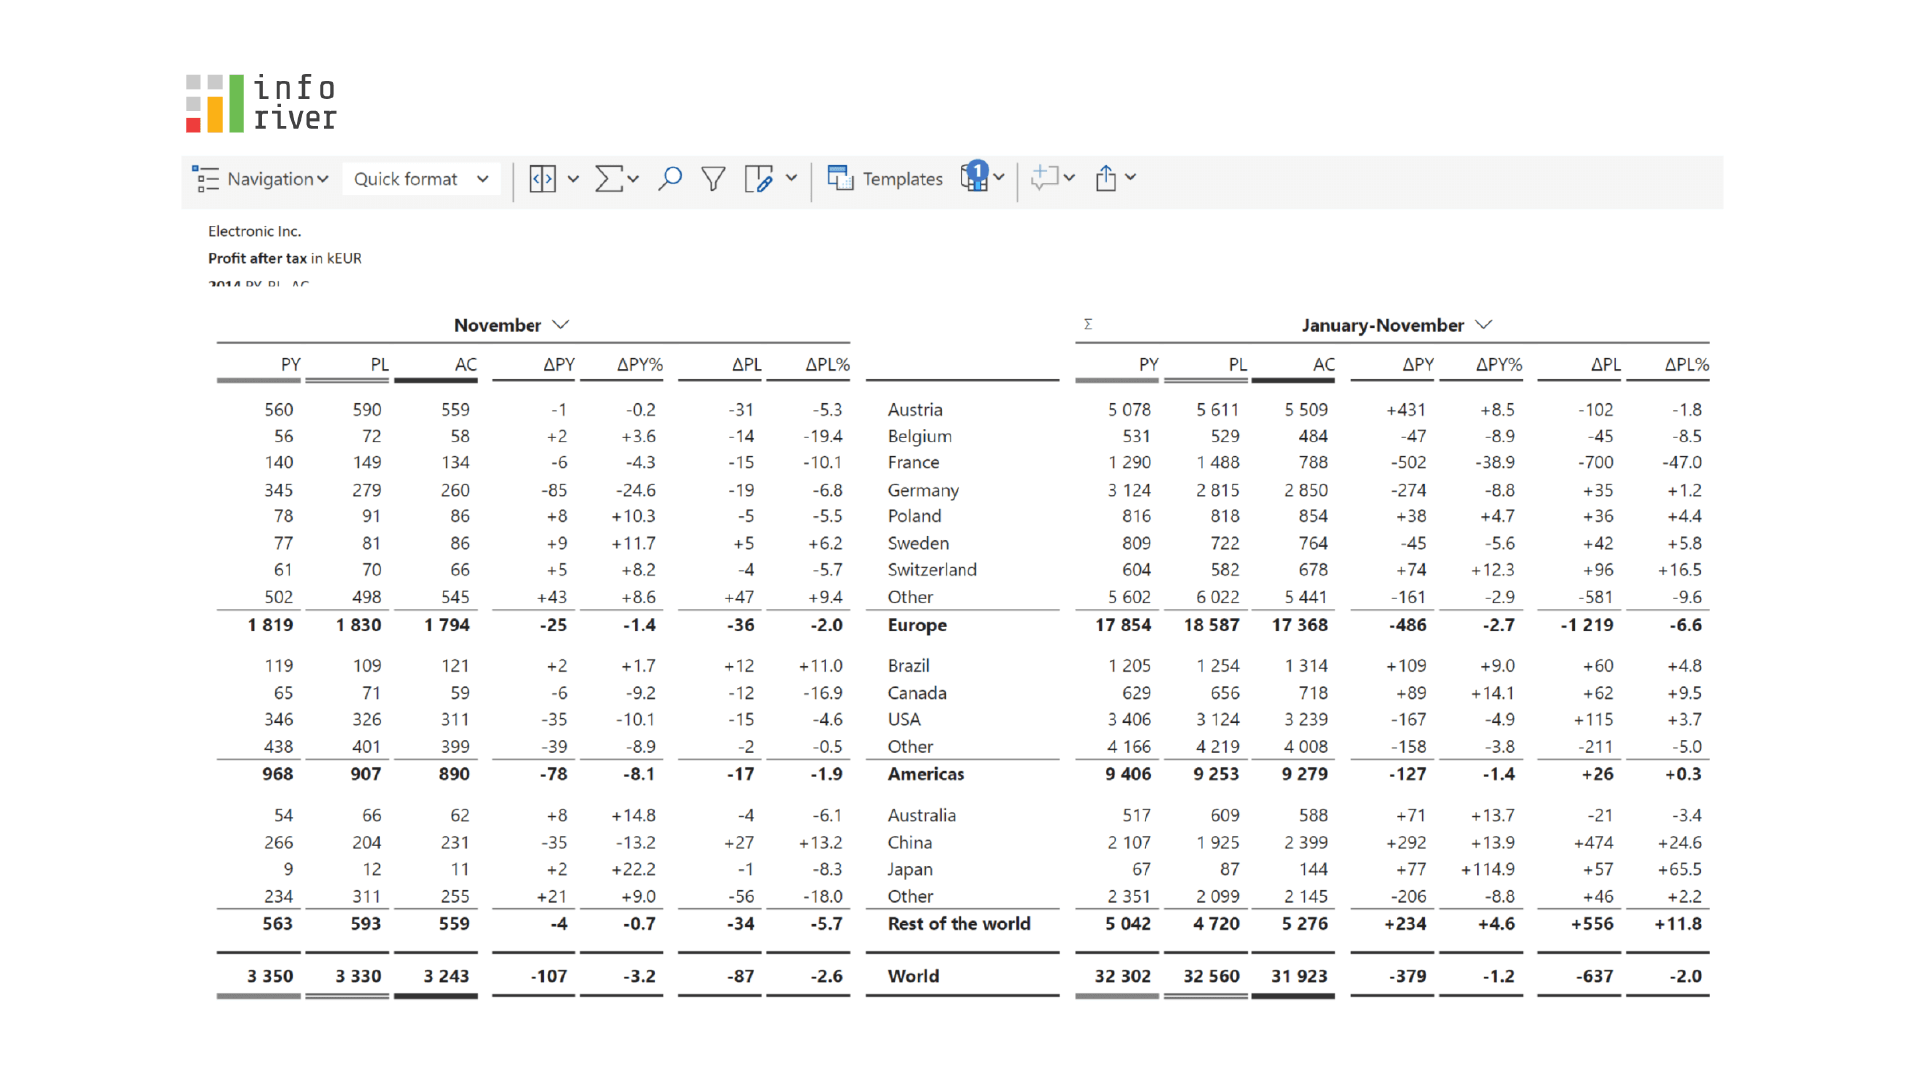
Perform region-wise profitability analysis by comparing actuals with plan and forecast across different time periods.
Build a comparative P&L with calculation schemes in the rows.
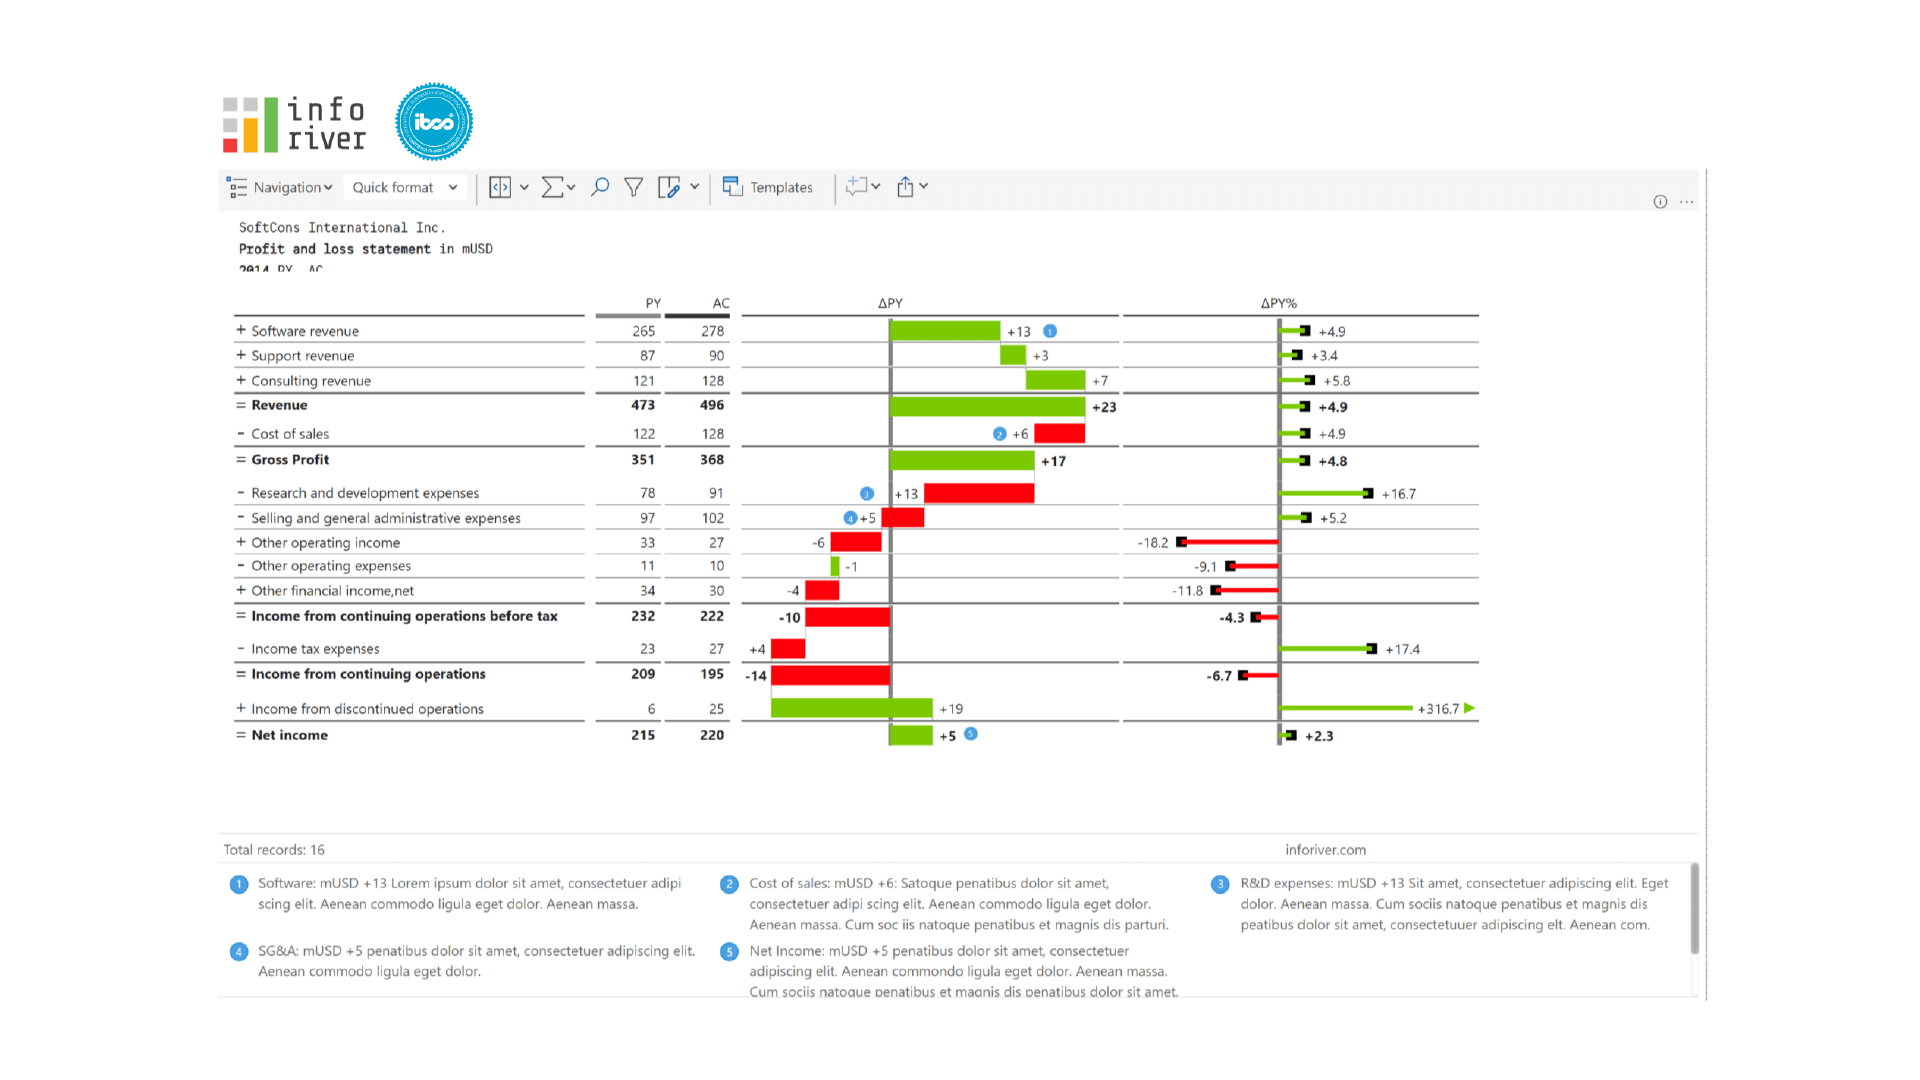
Create a variance P&L where variances are represented as bars and pins.
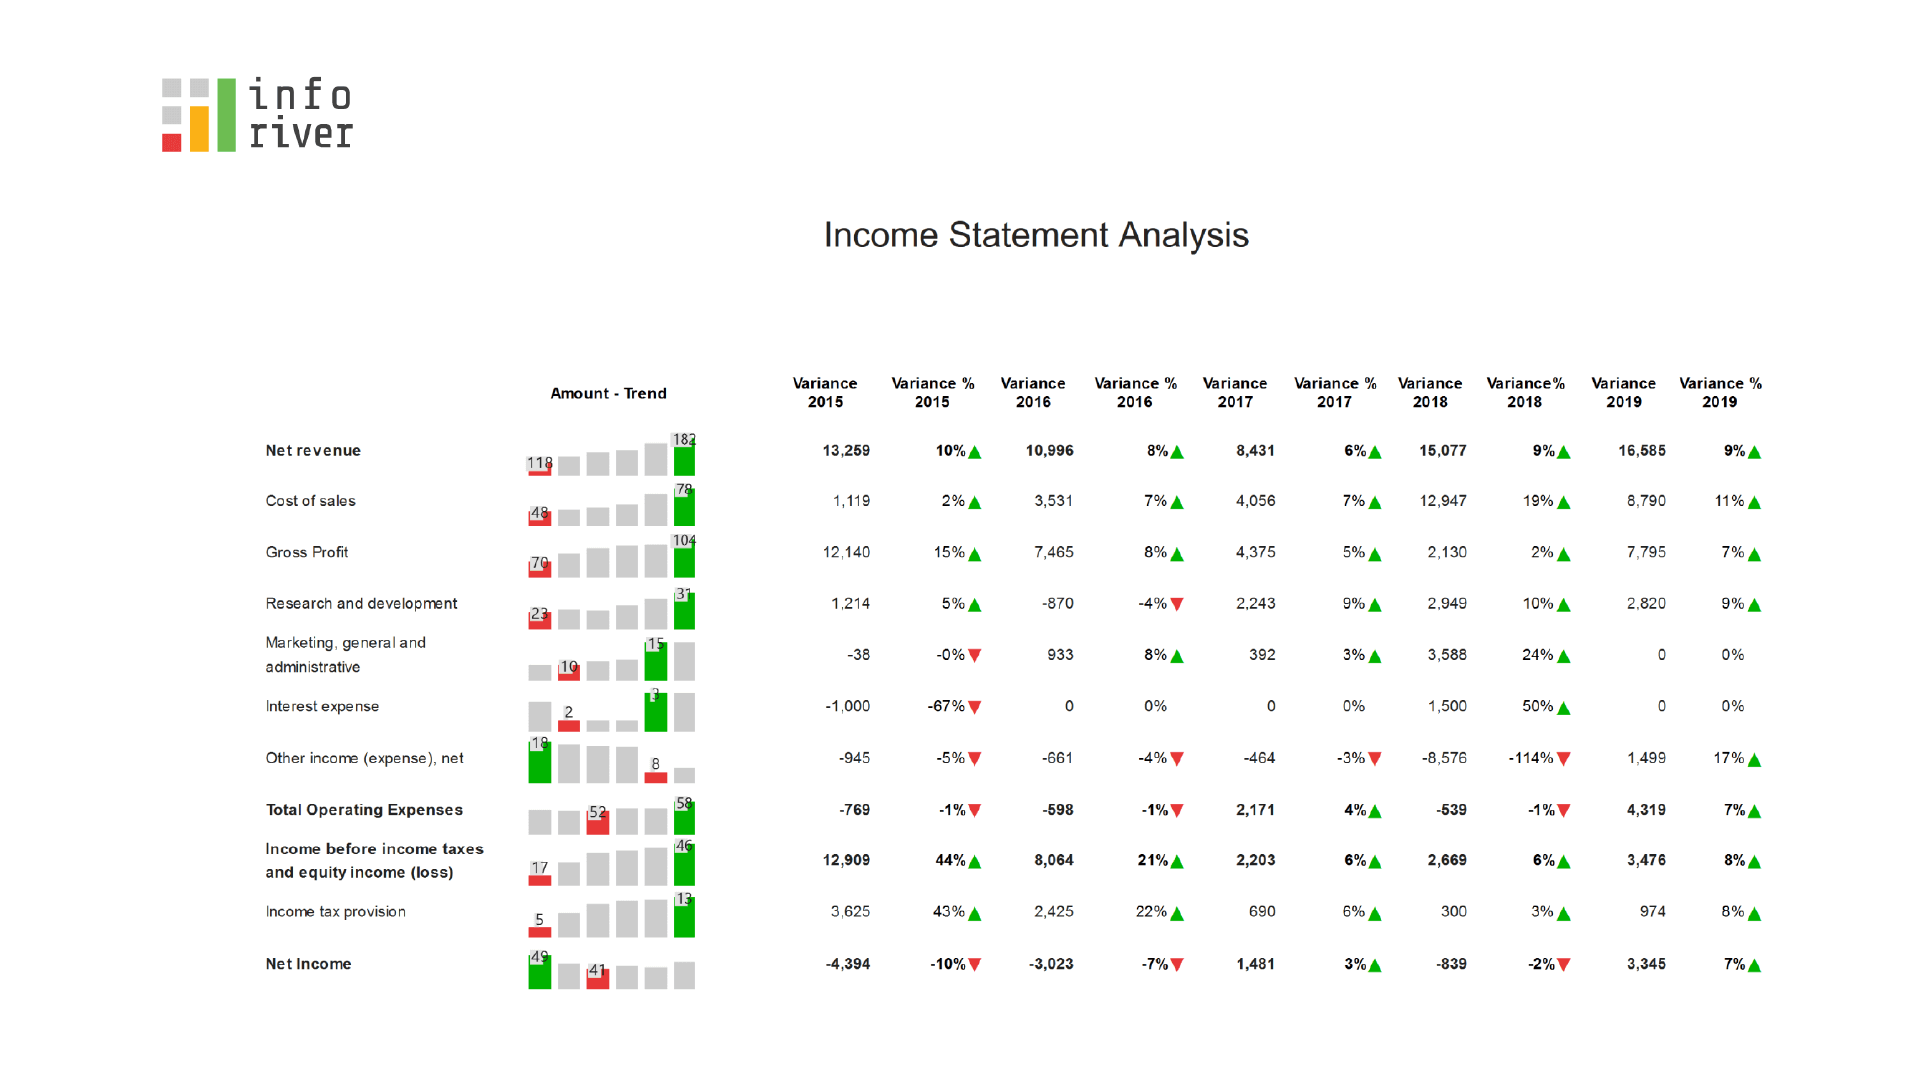
Perform trend and variance analysis on financial statements using sparklines and advanced conditional formatting.
Create impressive dashboards using Inforiver's wide array of charts and functionalities without the need for other visuals.
Create vibrant dashboards using Inforiver's dark mode feature, bullet charts and icon based conditional formatting.
Utilize a variety of bullet charts such as IBCS Bullet, Conditional Bar, Comparative Bullet, Stacked and Percentage Stacked Bars.
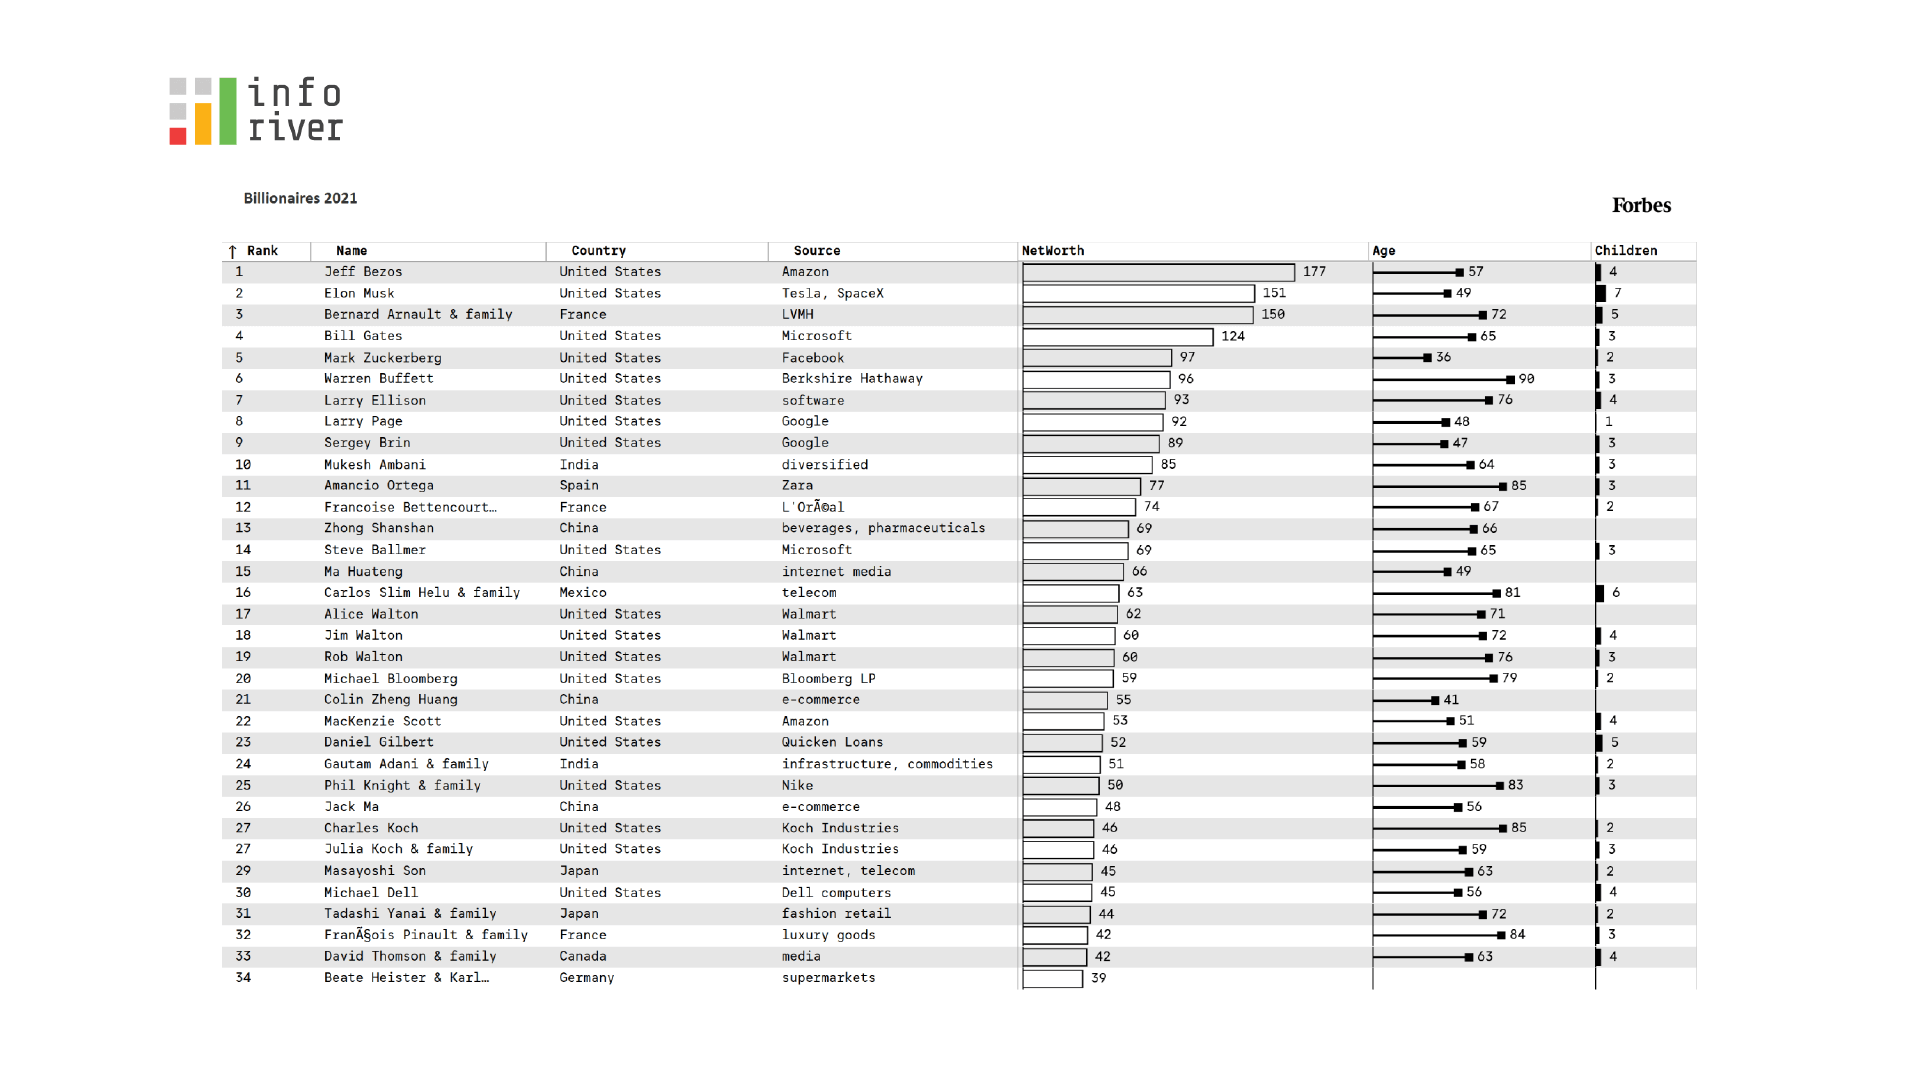
An analysis of the Forbes billionaires using cell level bar charts, pins and extensive formatting options.
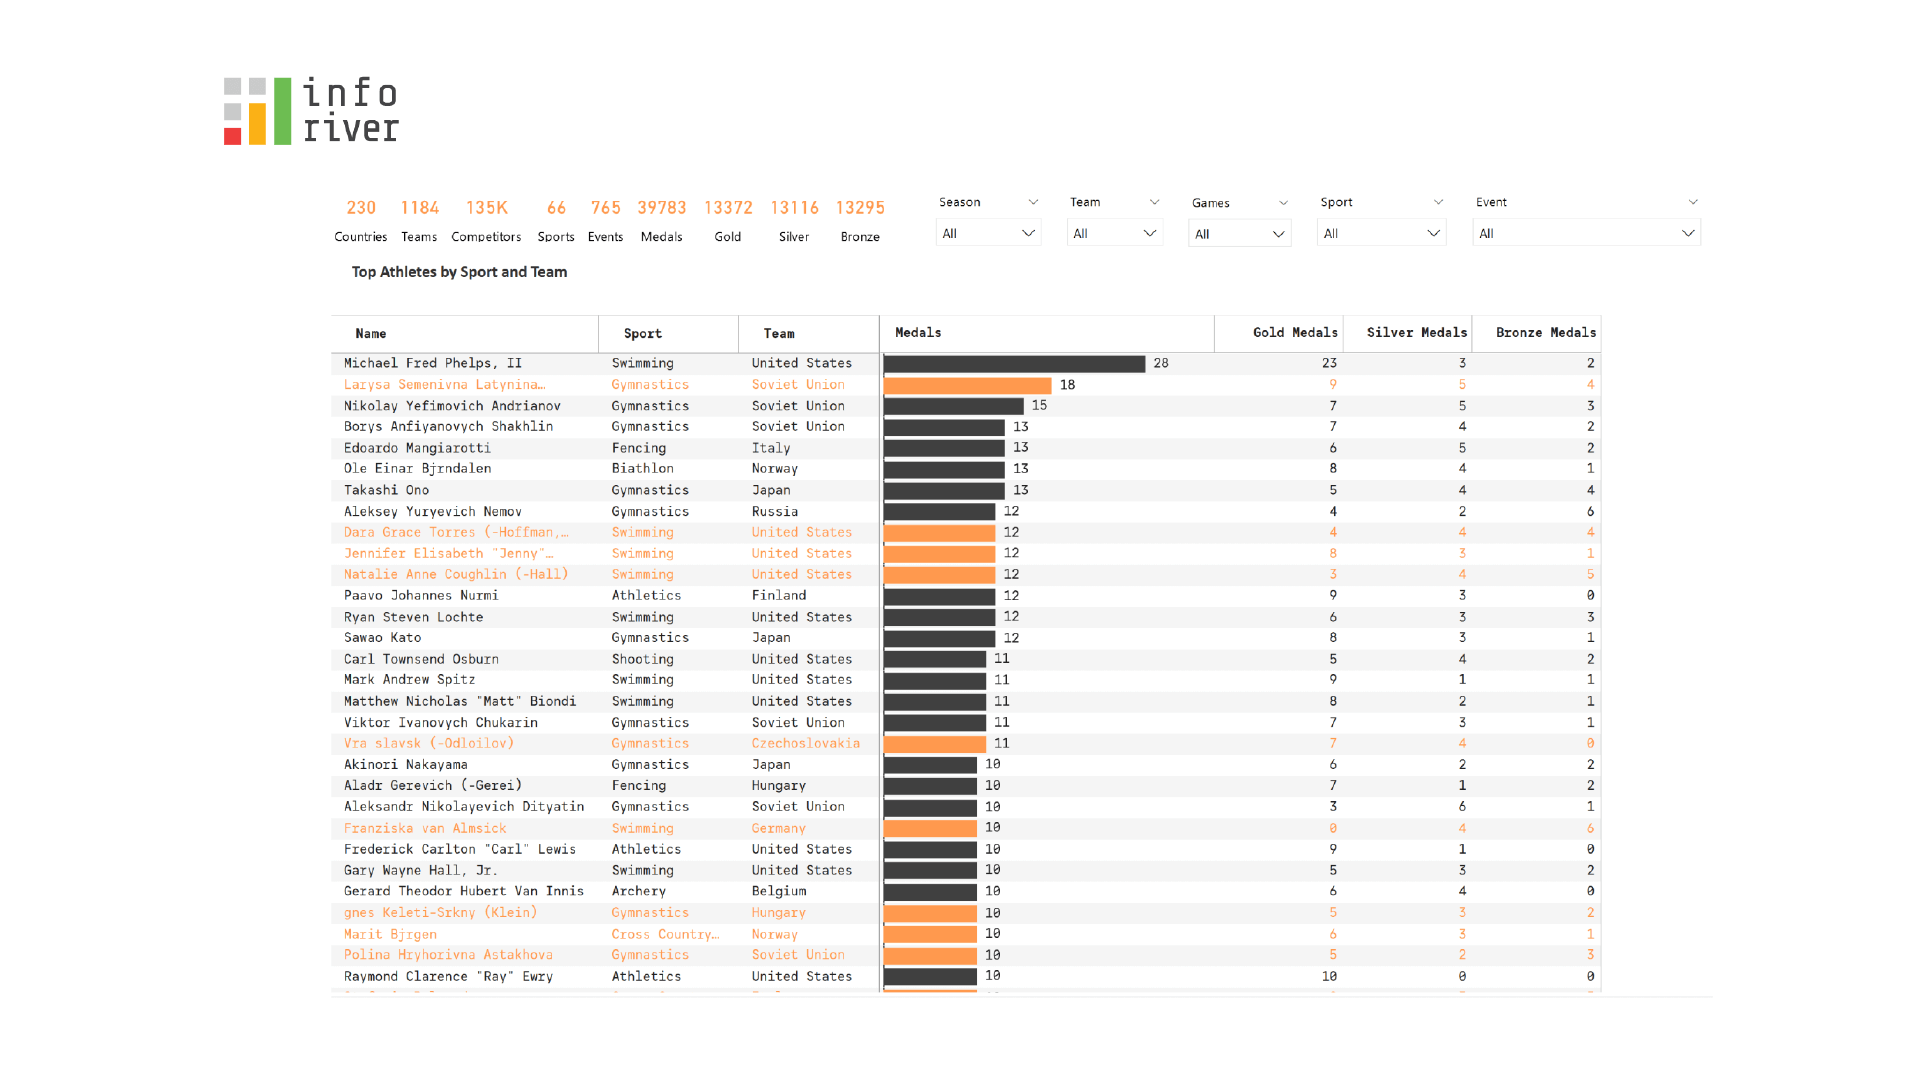
Analysis of 120 years of Olympics history using features like top n + others, segmentation and sparklines.
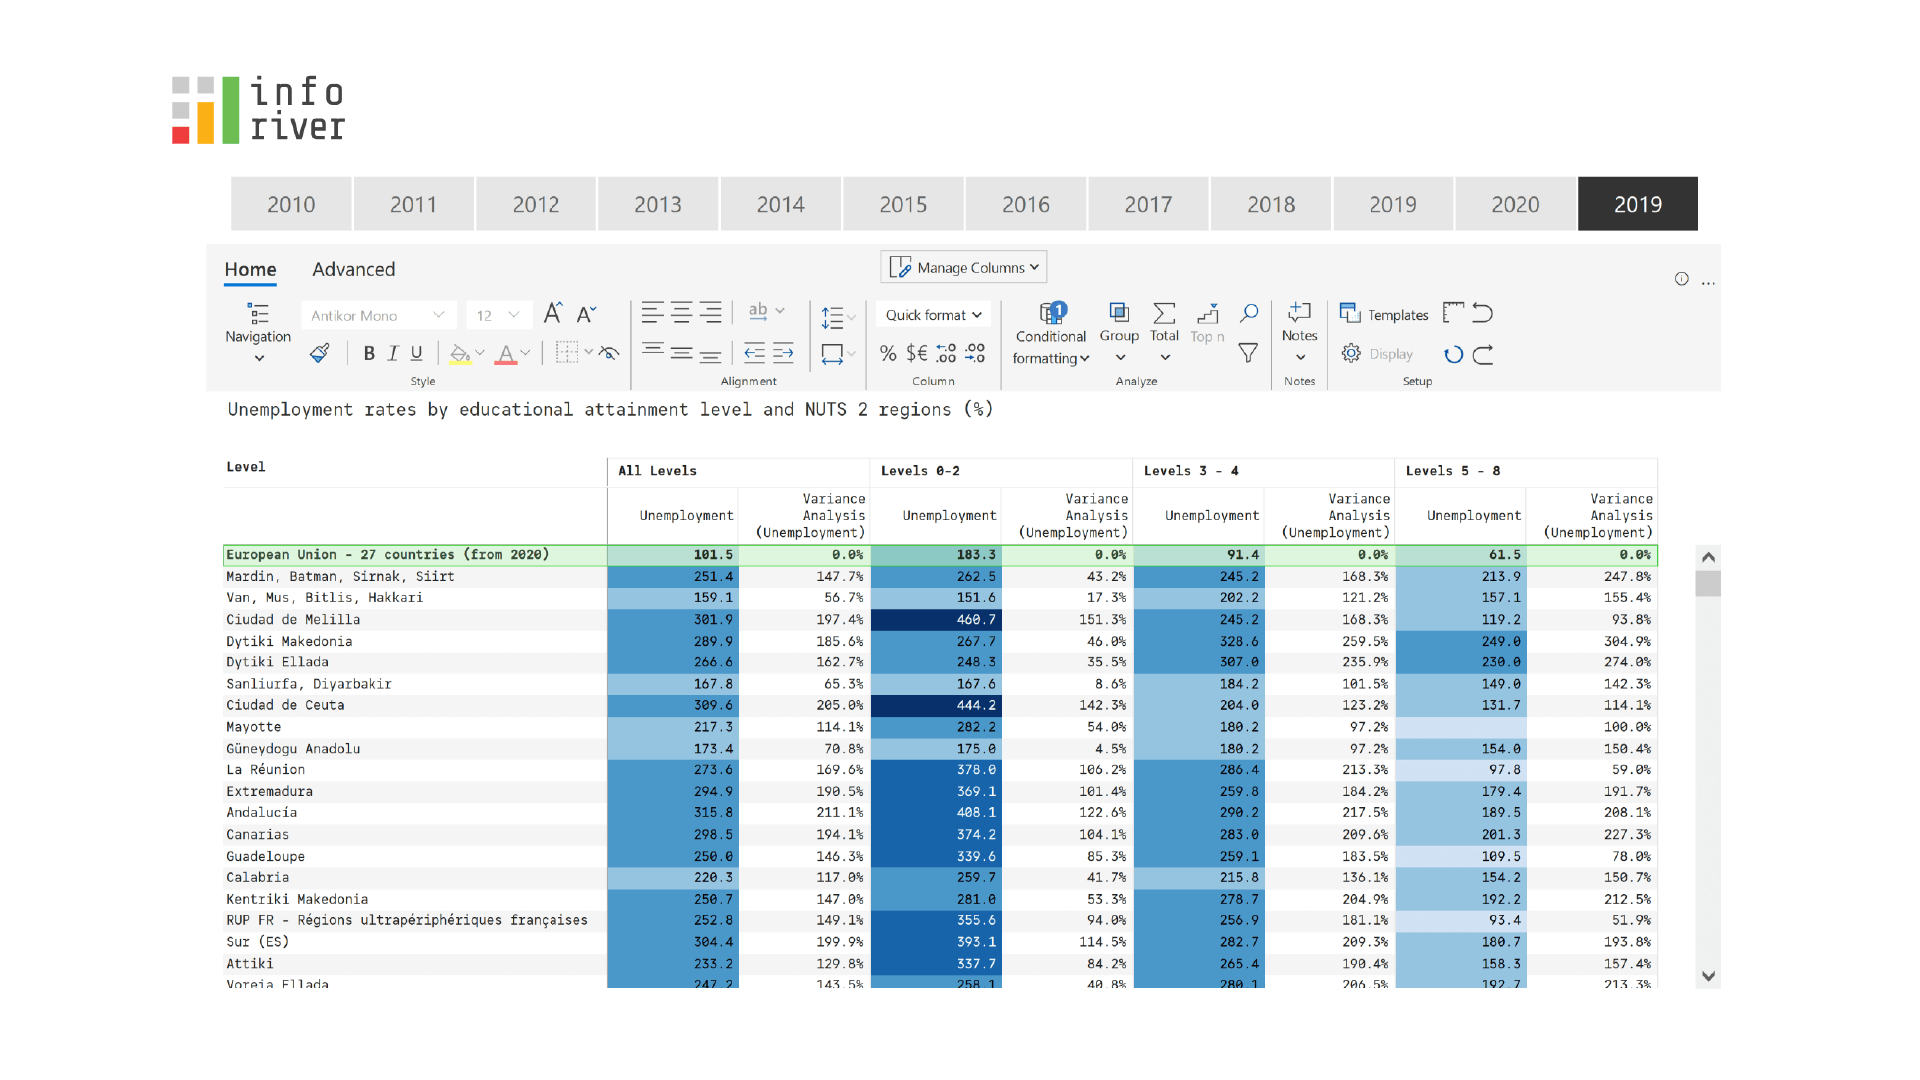
Use advanced conditional formatting features such as segmentation and heat maps; perform sorting and variance analysis.
Leverage features such as icon-based conditional formatting, blended columns and stepped layout.
Employ in-built templates, top and bottom n + others analysis, cell level sparkline and bar charts.
Perform region-wise profitability analysis by comparing actuals with plan and forecast across different time periods.
 In this webinar, learn how to leverage one-click IBCS report templates to deliver stunning and engaging visualizations in Power BI. Register today to learn more!