
Upcoming webinar on 'Inforiver Charts : The fastest way to deliver stories in Power BI', Aug 29th , Monday, 10.30 AM CST. Register Now
Upcoming webinar on 'Inforiver Charts : The fastest way to deliver stories in Power BI', Aug 29th , Monday, 10.30 AM CST. Register Now

A heatmap is a two-dimensional visualization of data that uses color to represent numerical values. This can be either different intensities of the same hue, or different colors from a palette.
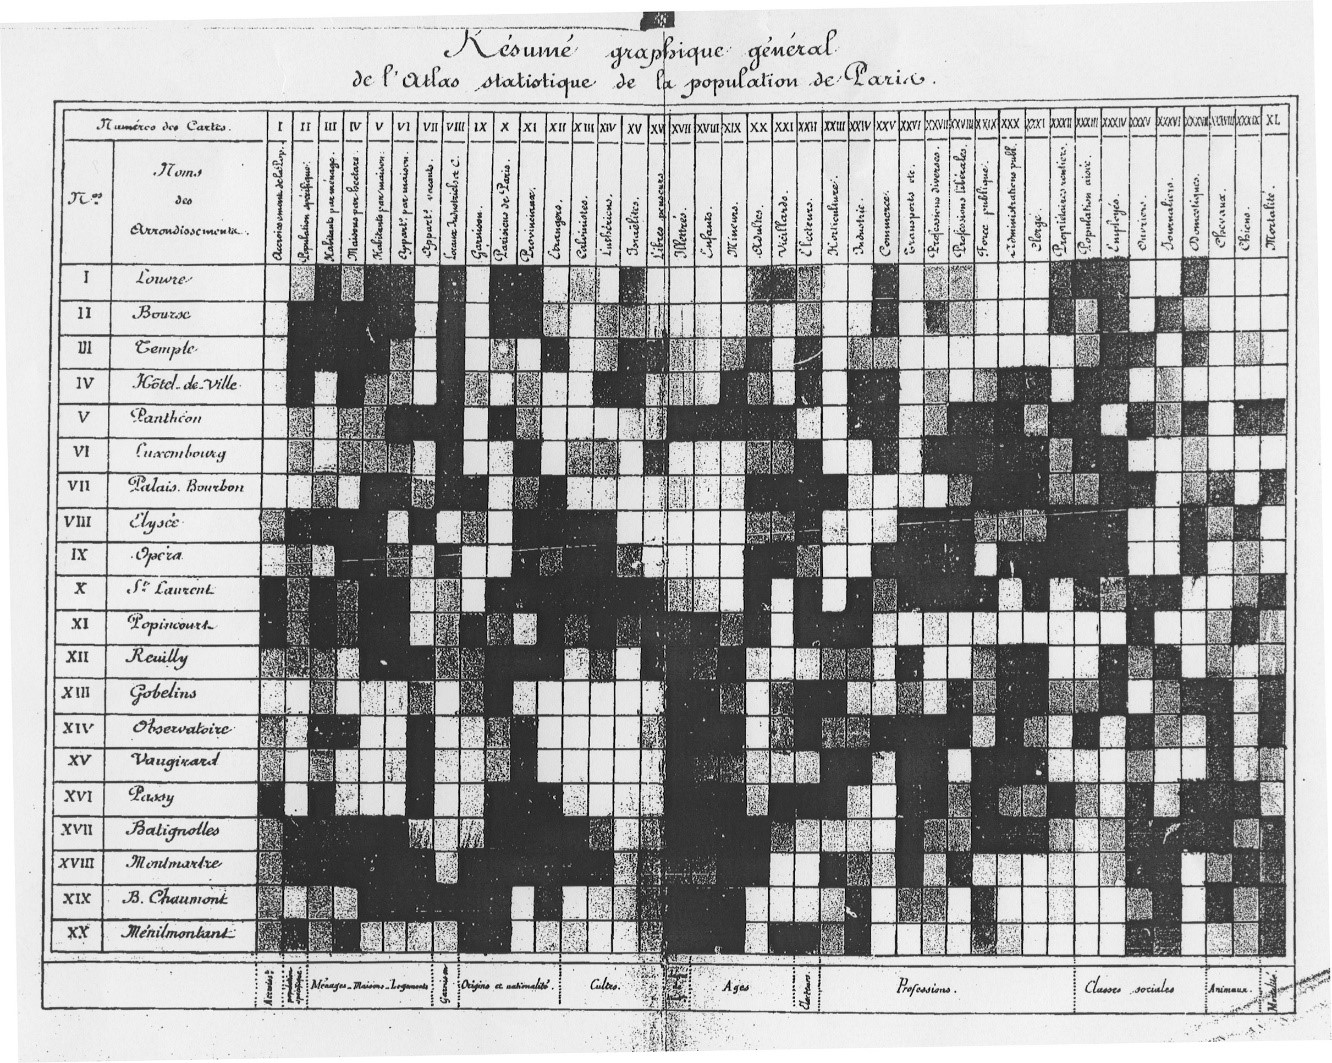
One of the earliest examples of the heatmap, made by Toussaint Loua in 1873 to track social statistics across the different quarters of Paris, is shown below. This chart uses shades of grey to represent values. If we scan a row on this chart, we see how a particular district performs across different social criteria. When we scan one of the columns, we see the values taken by a specific statistic across the city.
Heatmaps offer several advantages. They are eye-catching and draw engagement using their use of color and allow us to see data with more granularity compared to the aggregated information usually presented in a line or bar chart. Despite this granularity, they remain easy to understand and give us an overall birds-eye view of the data rather than the exact numbers.
Heatmaps, however, also have an inherent flaw in that it is difficult for the eye to discern exact numbers even when using a continuous scale. This is because our visual perception does not allow us to accurately judge intensities of different hues. Notwithstanding, they still have a place in our data visualization toolkit when used correctly.
Before we look into heatmaps, let us quickly take a look at look at color scales, which is a topic that is highly relevant to heatmaps. Since color is the primary method of communicating value in a heatmap, it is important to choose the right type of color scale for your data.
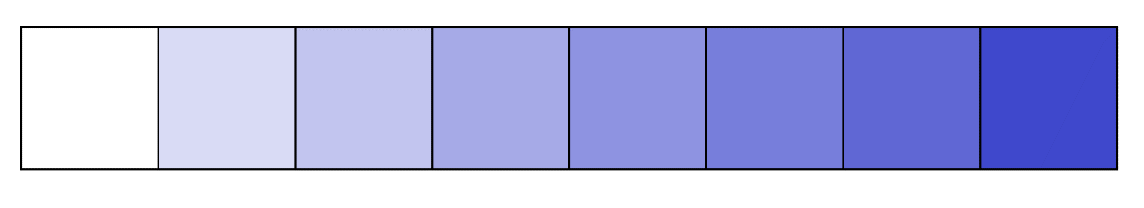
Sequential scales like the ones below use gradients that move in one direction only, usually from lighter to darker, representing continuously increasing values. They are used for values that are either all positive or all negative. For example, the population of an area is a measure that cannot fall below zero.


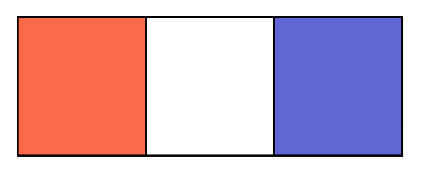
A diverging palette, like the one shown below, is used for data that includes a zero value and has both positive and negative values. Examples include temperature, which can be both positive and negative, or profits, where negative values represent losses.

The scales used can also be continuous or binned. Binned scales are used for values that are divided into intervals, such as age classes, or for discrete values, like customer satisfaction ratings, while continuous scales are used for values that do not need to be divided into intervals.

Binned diverging palettes can also be used to visualize qualitative values, such as bad, satisfactory and good.
Let us now examine the different types of heatmaps and discuss what they can be used for.
There are many types of heatmaps that are commonly used, but they can all be classified into two primary classes – spatial variations and grid variations. Each of these are used for different purposes, as we shall see below.
Spatial variants visualize values over a 2-dimensional area that is usually a map, or a surface that does not necessarily contain geospatial information, but still contains locations, like the webpage below which has text, images or buttons in specific locations.
The standard spatial variant uses color coded areas overlaid on a 2-dimensional space (often a map) to show variations in the values of a numerical variable. This space is often divided into isopleths, or areas with the same values, each of which are shaded differently, to allow us to see the contours of our values as in the first image below. These maps can be used for several purposes:
1.a. Track metrics for geospatial data
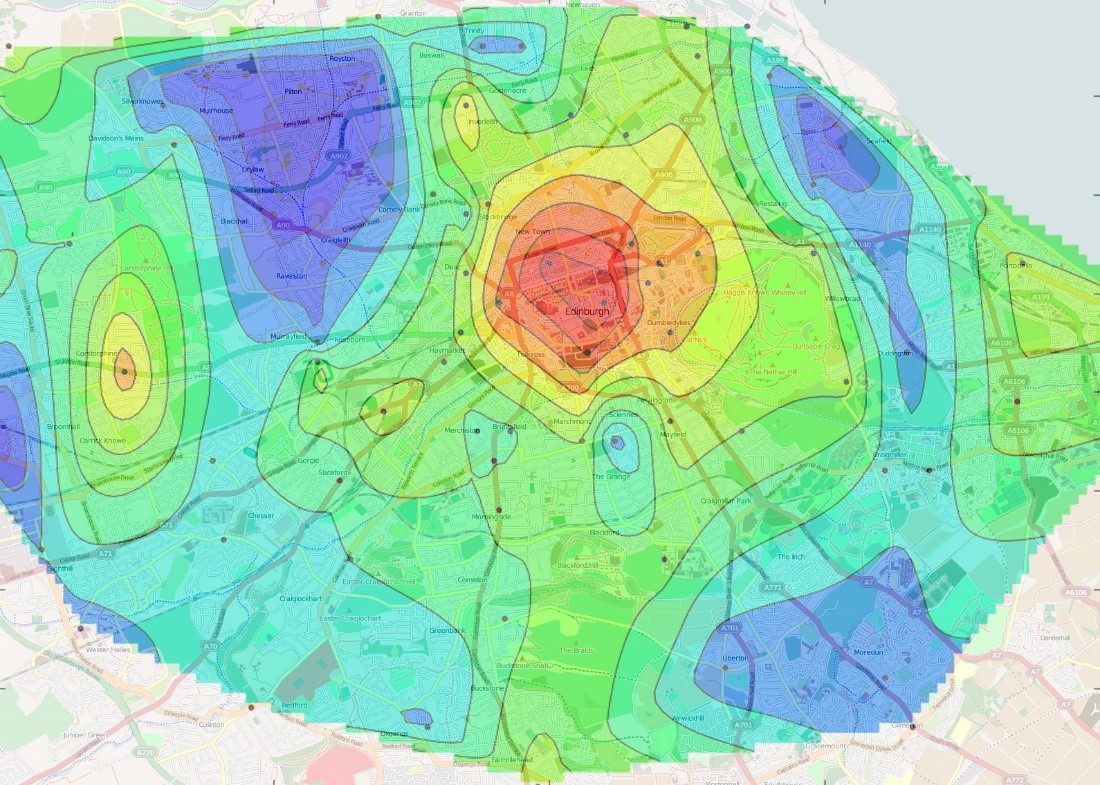
We may use heatmaps to track how different locations perform with respect to a particular metric. For example, the following chart shows the most photographed areas of the city of Edinburgh, with red indicating areas that are highly photographed, petering out to blue indicating less photographed areas. Notice how the historic center of the city, covered in red and orange, is among the most photographed areas, with other places receiving less attention.
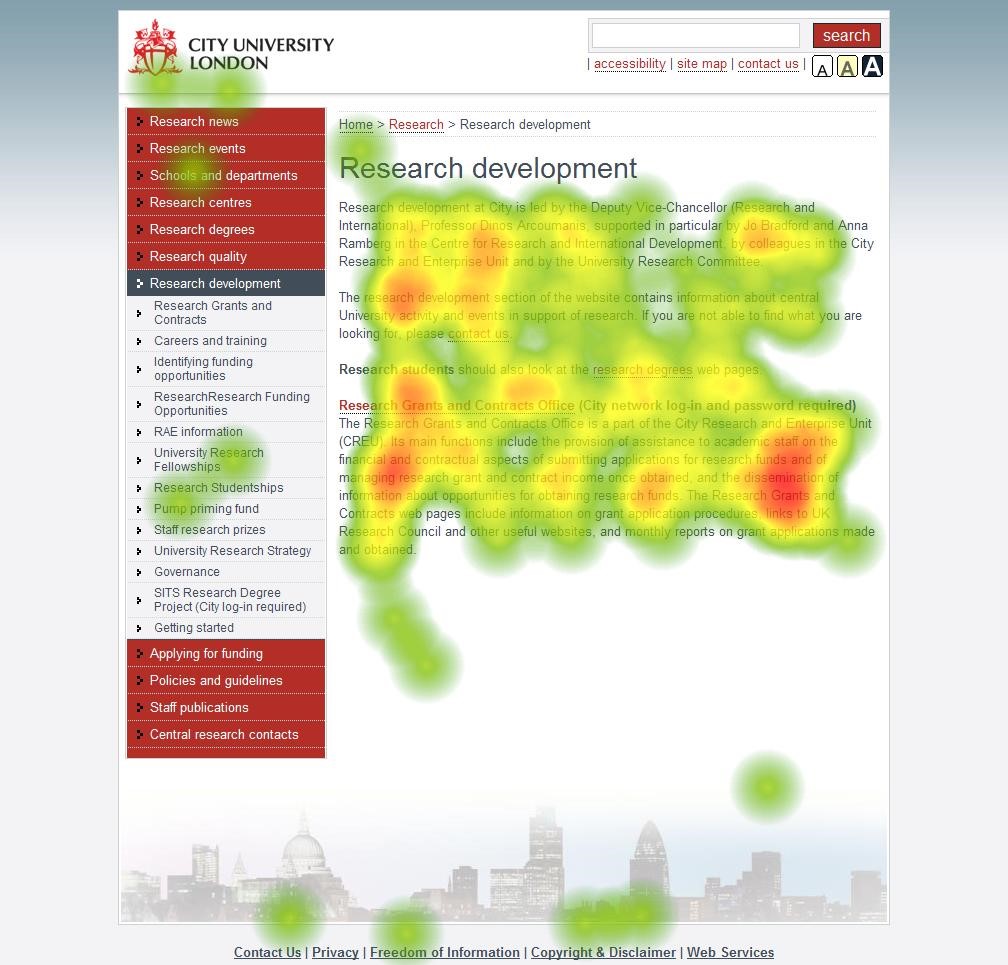
1.b. Website analytics
Heatmaps can also be used to create engaging and user-friendly webpages that convey the right message. We may use mouse tracking, eye tracking, or the number of clicks to understand which parts of a page draw the most attention. This can be represented as shown in the image below displaying a page from the website of the City University London. This can help us understand and improve the reach and readability of a website.
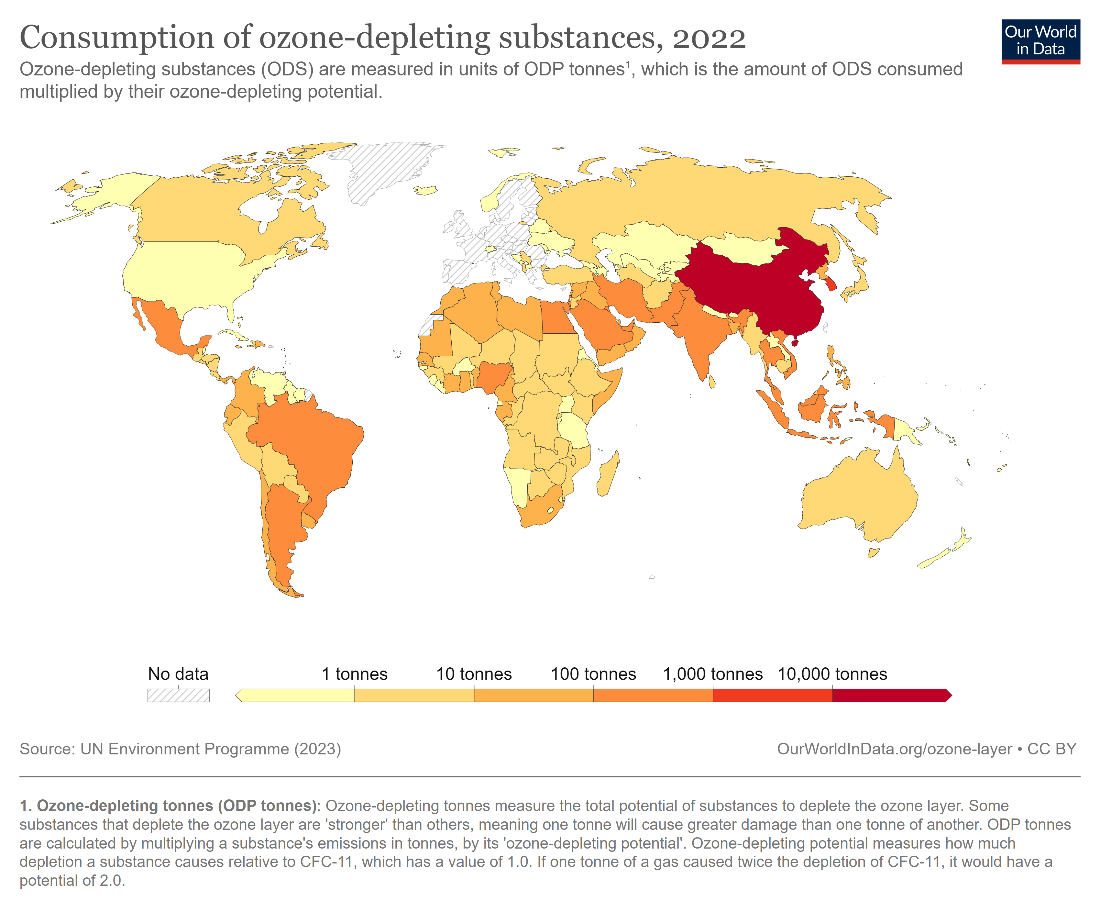
Choropleth maps show us how values change across geographical or political boundaries, rather than molding continuous areas according to value, as in the charts discussed above. The chart below, for example, shows the consumption of ozone-depleting substances by country. Higher consumption is shown in darker shades of red, and we see how values vary across the world.
The grid variation is a 2-dimensional data matrix with the cells colored according to their value. This type does not use maps or locations as in the spatial variations, but uses a grid which can be read like a table – the value of each cell is determined by its row and column location.
The standard grid heatmap is used in a variety of contexts:
1.a. Time series data
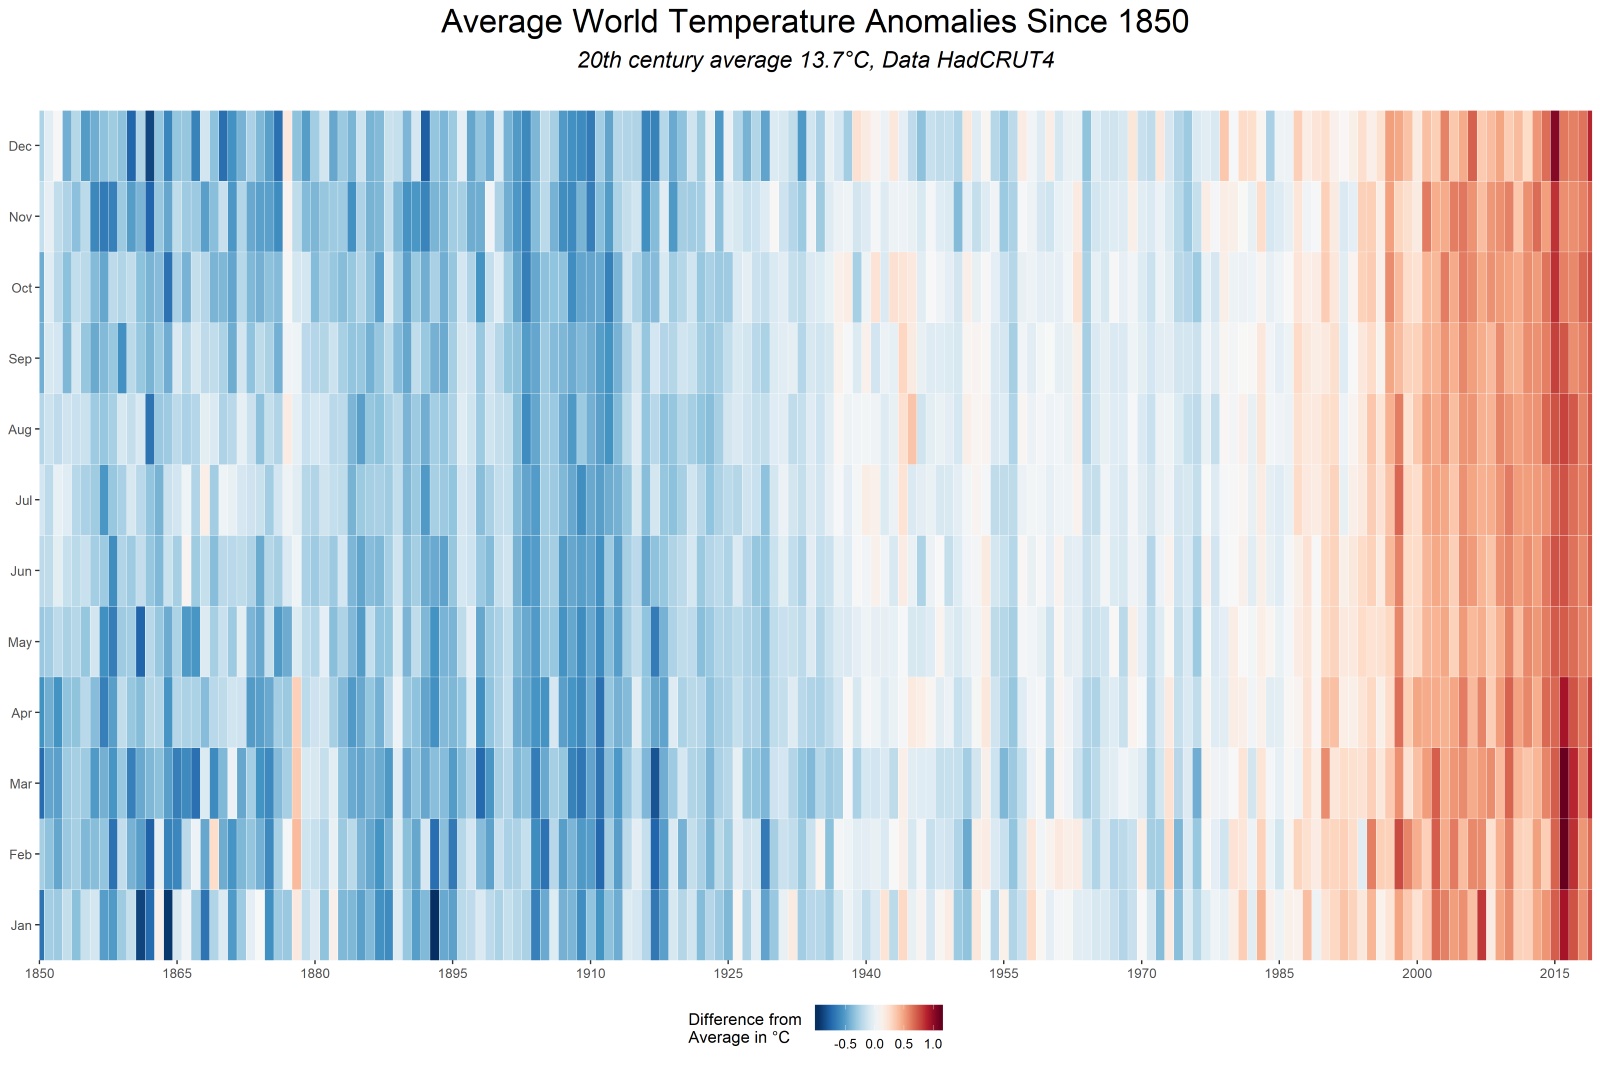
Heatmaps can effectively visualize changes over time, and provide an eye-catching alternative to the line chart. While they lack the precision of a line chart, heatmaps give us an overview of the broad patterns in the data and can provide more granularity depending on how they are used. The following chart visualizes average global temperature anomalies from 1850 to 2018, with the vertical axis showing the months of the year. It allows us to see how anomalously high temperatures have become more and more common with global warming.
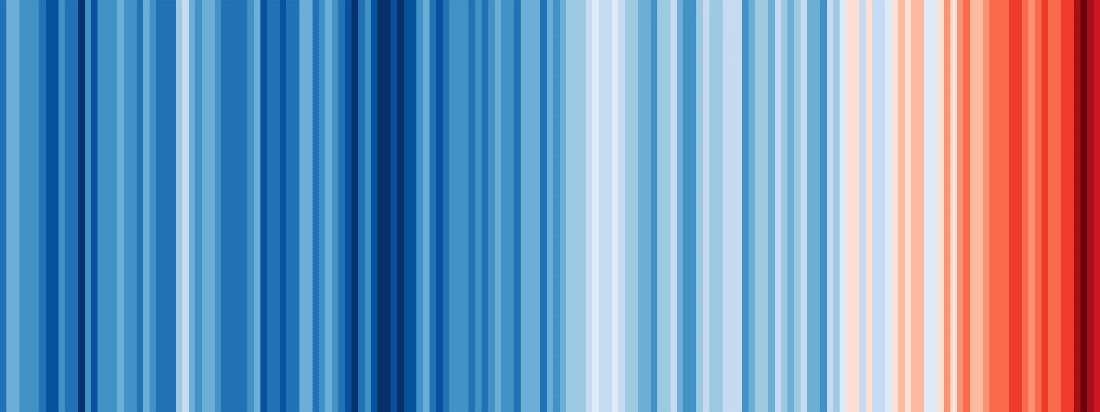
The above chart is a variation of one of the most popular charts to visualize global warming – the “warming stripes” map made by climatologist Ed Hawkins. This chart does not divide each year into months, but instead shows the average temperature as a stripe to form a barcode-like pattern. This chart was adopted internationally to become a symbol of the ongoing climate crisis.
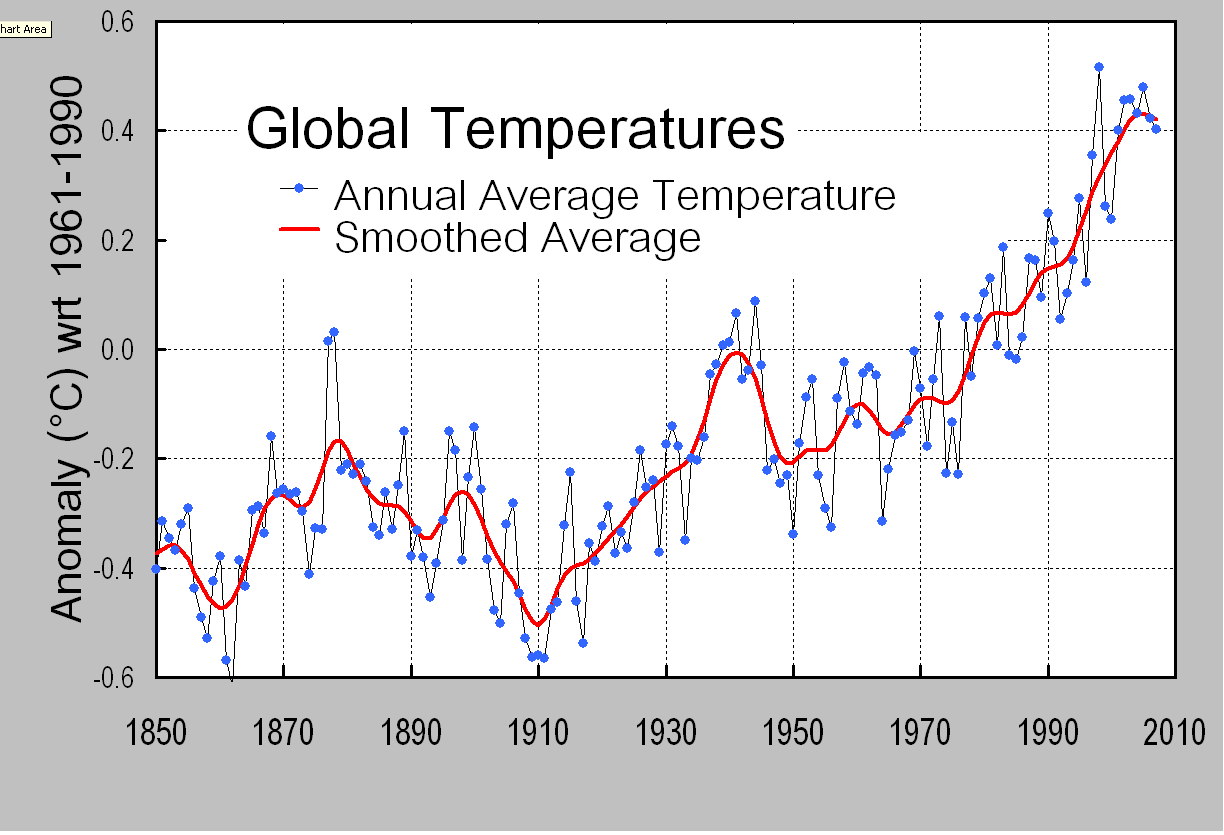
We may visualize the same data in line chart form, which is the traditional choice for time series data, as seen below. This chart clearly does not have the same appeal as the stripe plot above, though it gives us a more accurate picture of the exact numbers.
1.b. Put the spotlight on exceptional values
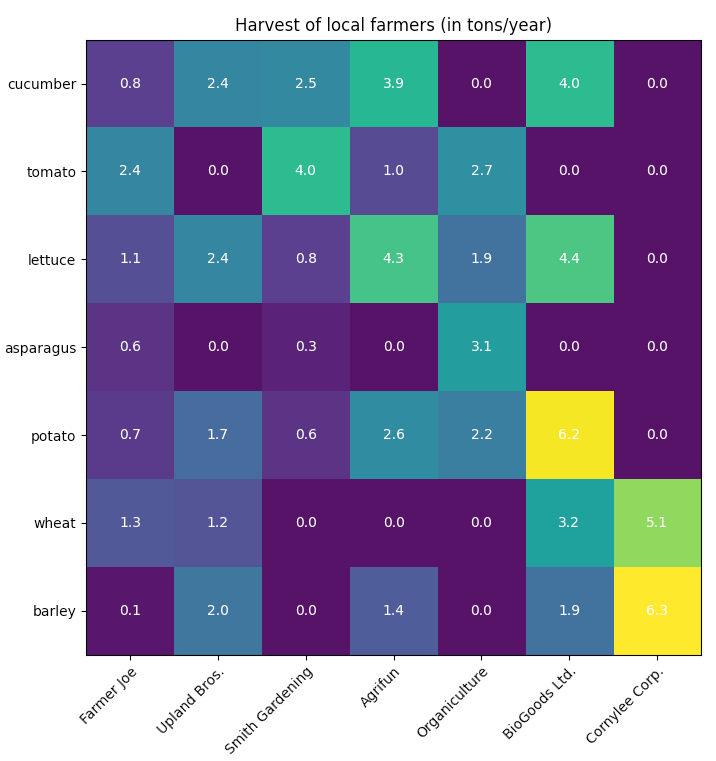
Color can be the perfect tool to immediately draw the reader’s attention to outlying values. The following matrix shows the harvest quantities of various vegetables from different farmers. Notice how the two yellow squares – BioGoods Ltd.’s exceptional harvest of potatoes and Cornylee Corp.’s harvest of barley – stand out sharply against the background of lower values.
1.c. Better insights into tables
Heatmaps can also be useful in providing richer insights into tables. Sometimes, we may want to see the numbers themselves instead of aggregated information in the form of charts. In these cases, we may use grid heatmaps to quickly understand “hot” and “cold” areas, or areas that have performed well or need attention. This is a useful feature in marketing and financial analysis to present information on current performance, projected numbers and areas for improvement.
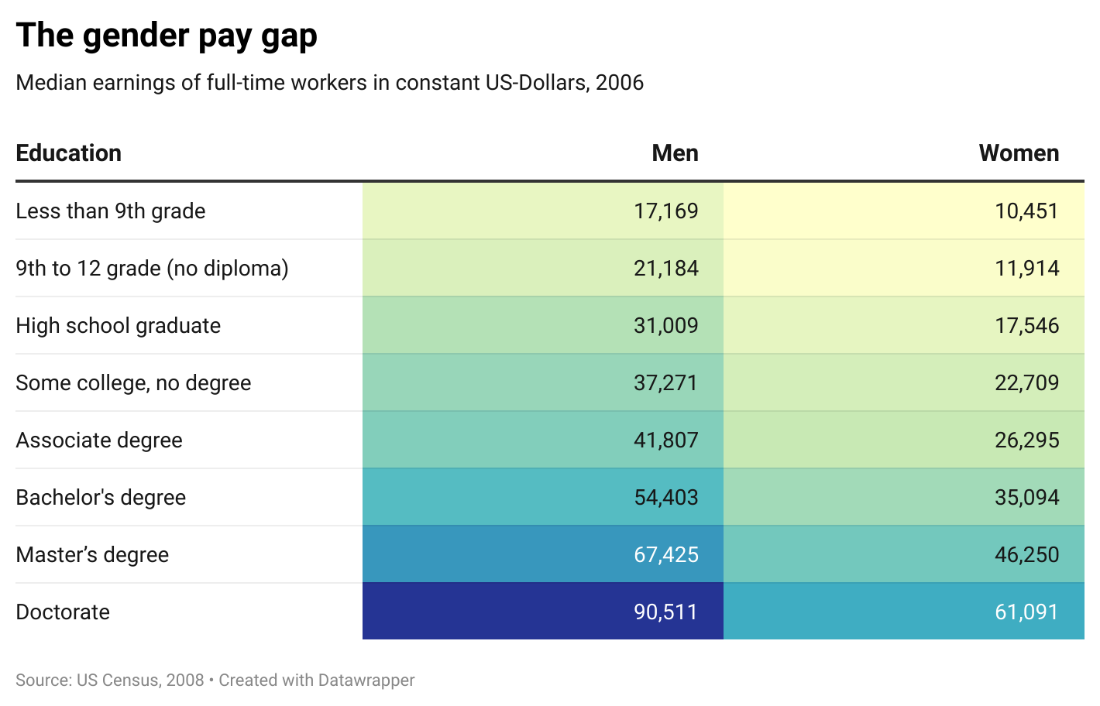
The following chart shows us how heatmaps provide a richer understanding of tables. This chart visualizes the pay gap between men and women in the US in 2008 by showing us the median earnings of each group. Notice how the column for men shows darker colors, indicating a higher median income, for every level of education compared to the equivalent level for women. We also see the gradient of color from lower to higher levels of education for both groups, indicating that a higher level of education leads to better income. This chart shows both of these trends at a glance using only color, and the exact numbers become secondary in how we read the chart.
1.d. Reveal seasonal patterns
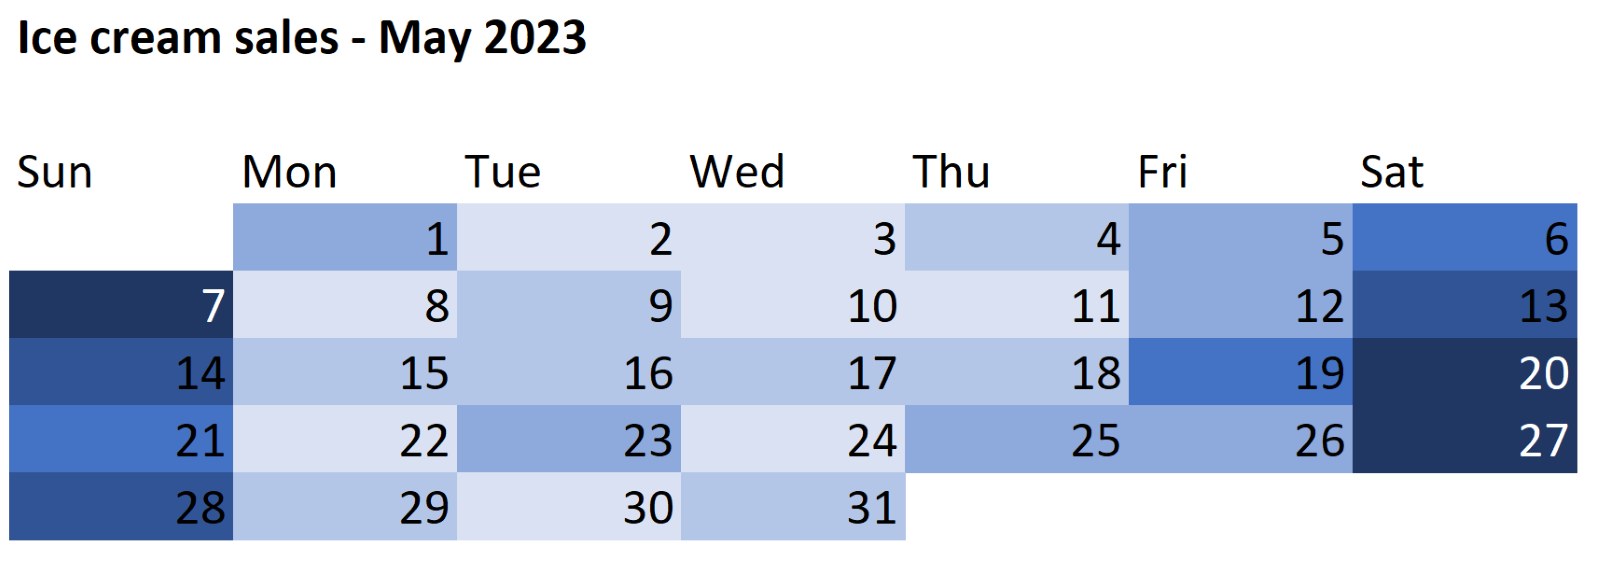
Heatmaps can also be used to understand patterns like seasonality in time series data. The following chart shows ice cream sales for the month of May for a fictional ice cream shop. We clearly see that sales on the weekend are higher on average than sales during weekdays. This type of seasonality can be harder to see in a line chart, especially one tracking long periods of time.
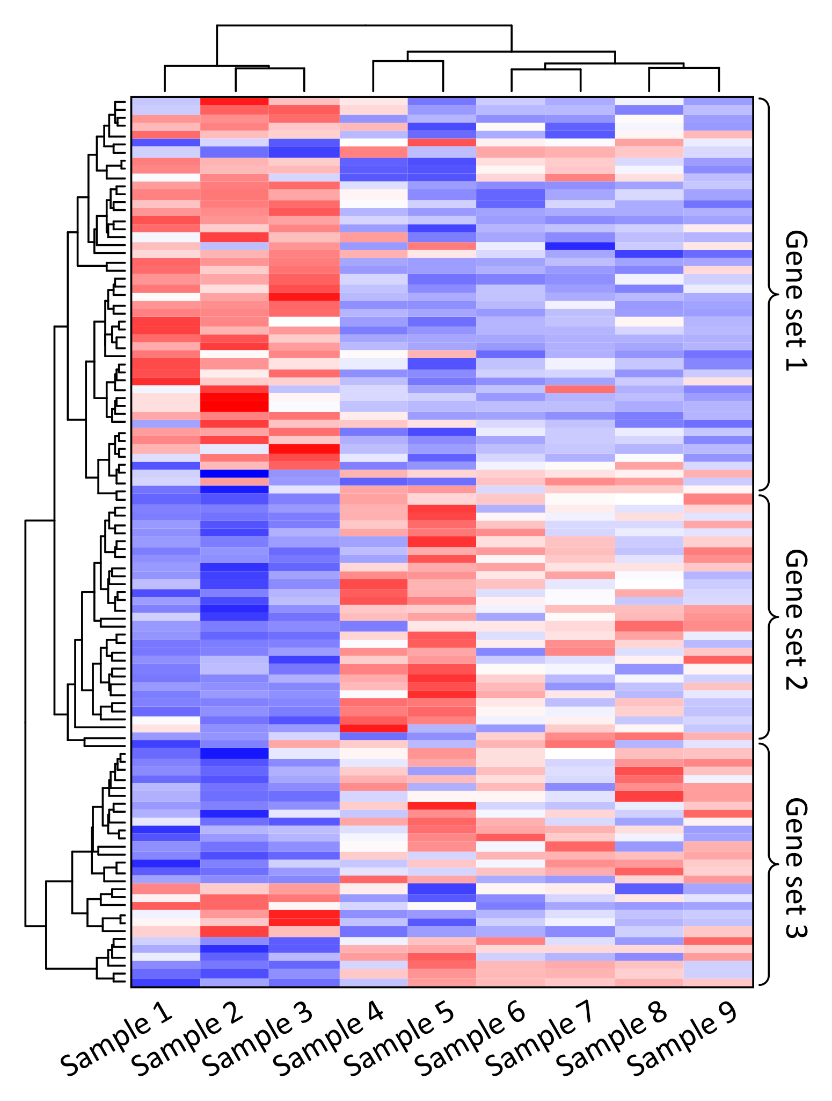
Clustered heatmaps are a variant of the standard grid heatmap where hierarchical information is represented in addition to the usual numerical values. The numerical value of each cell is once again encoded by a color scale, but the rows and columns are sorted by their relationships to each other, and a tree is added to show the hierarchical links between the rows and columns. These types of charts are often used in the biological sciences to show relationships in genetic data, as in the chart below.
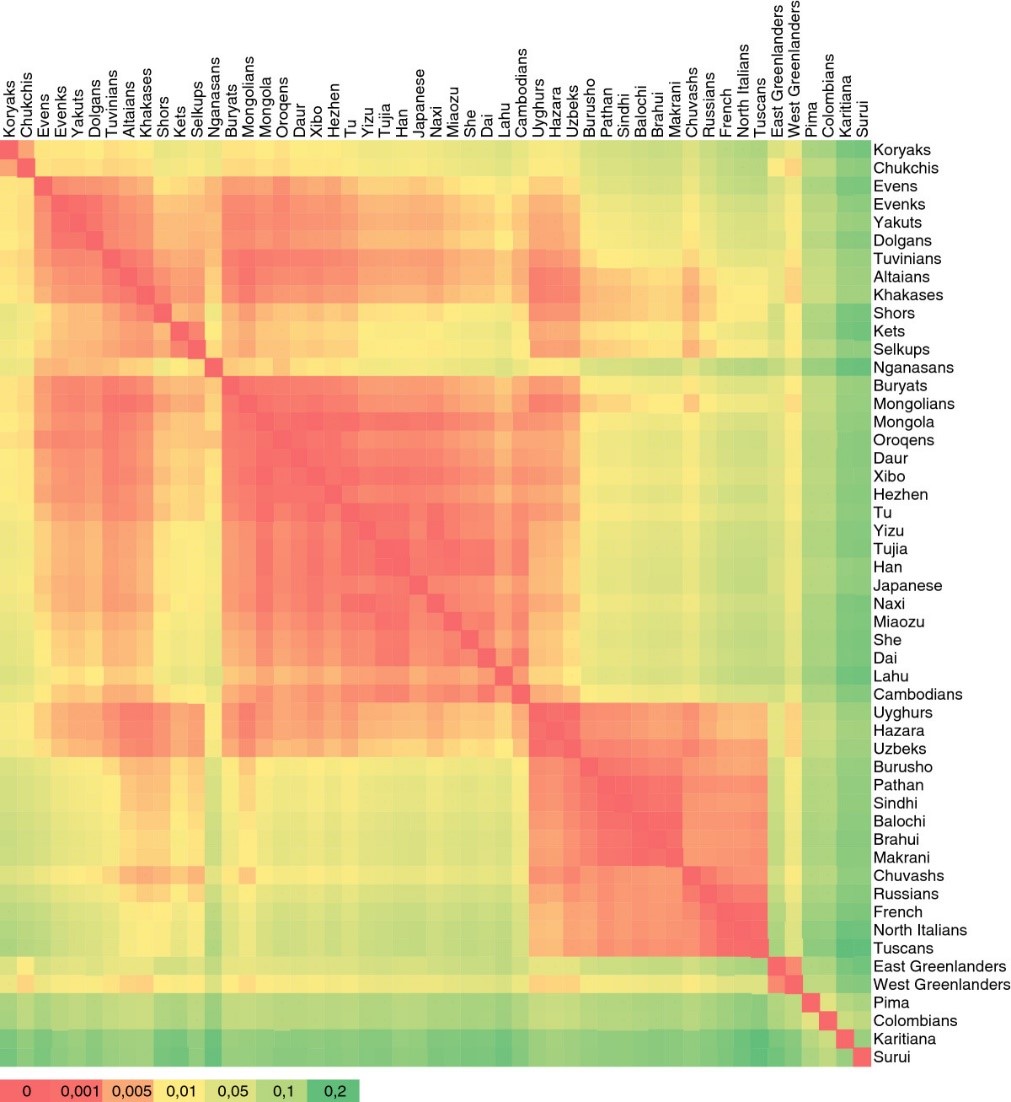
A correlogram is a type of grid heatmap that plots the same categories on the horizontal and vertical axes. This forms a matrix which visualizes the correlations between all combinations of categories using their row and column location. The following correlogram, for example, shows the genetic relationships between different ethnic groups. The “hot” areas indicate a high degree of correlation and the “cold” areas indicate a low degree of correlation. In this case, the hot areas in red show us which ethnic groups are closely related to each other, and the cold areas in green show us distantly related groups. The diagonal is the brightest shade of red as each group is perfectly related to itself.
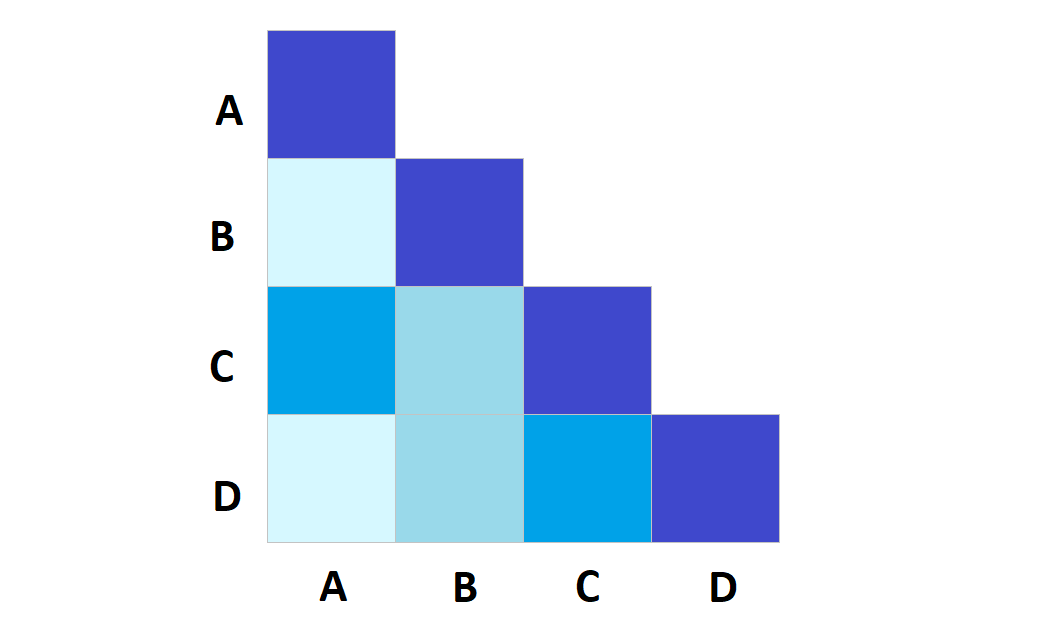
Notice how the above chart is symmetric around the diagonal because column A and row B gives us the same combination of ethnic groups as column B and row A. This makes one half of the chart redundant, and thus correlograms are often represented as triangles like in the illustration below.
In conclusion, use heatmaps to understand the relationship between two variables, or to represent geospatial data. Choose the right type of color palette by examining the numerical or qualitative variable that you are interested in visualizing, and choose the type of heatmap according to your data structure.
Build Heatmaps in Power BI — Try Analytics+
- By Hamsini Sukumar
11 Pie chart alternatives and when to use them

Inforiver helps enterprises consolidate planning, reporting & analytics on a single platform (Power BI). The no-code, self-service award-winning platform has been recognized as the industry’s best and is adopted by many Fortune 100 firms.
Inforiver is a product of Lumel, the #1 Power BI AppSource Partner. The firm serves over 3,000 customers worldwide through its portfolio of products offered under the brands Inforiver, EDITable, ValQ, and xViz.