Upcoming webinar on 'Inforiver Charts : The fastest way to deliver stories in Power BI', Aug 29th , Monday, 10.30 AM CST. Register Now
Upcoming webinar on 'Inforiver Charts : The fastest way to deliver stories in Power BI', Aug 29th , Monday, 10.30 AM CST. Register Now
Bullet charts offer rapid and precise evaluation of performance across metrics, but their full potential often remains unexplored because of their reputation as a difficult chart. However, they can be easily understood and offer a wide range of applications. Let’s explore the versatility and power of this fascinating chart and enhance our own data analysis and visualization techniques!
Whether you love data, work in analysis, or are a business pro, this guide will teach you everything you need to know about bullet charts.
A bullet chart is a concise and efficient data visualization tool that compares a single measure against a target. It also incorporates qualitative ranges, offering a clear and compact view of performance. They can also be used to compare past performance against current numbers in year-to-date comparisons or used with more than one comparative measure for multiple simultaneous comparisons. Bullet charts provide a data-rich and efficient display of several measures. Their compactness makes them ideal to use in dashboards where several charts can be stacked in a relatively small area. This allows for individual assessment as well as quick comparison between metrics.
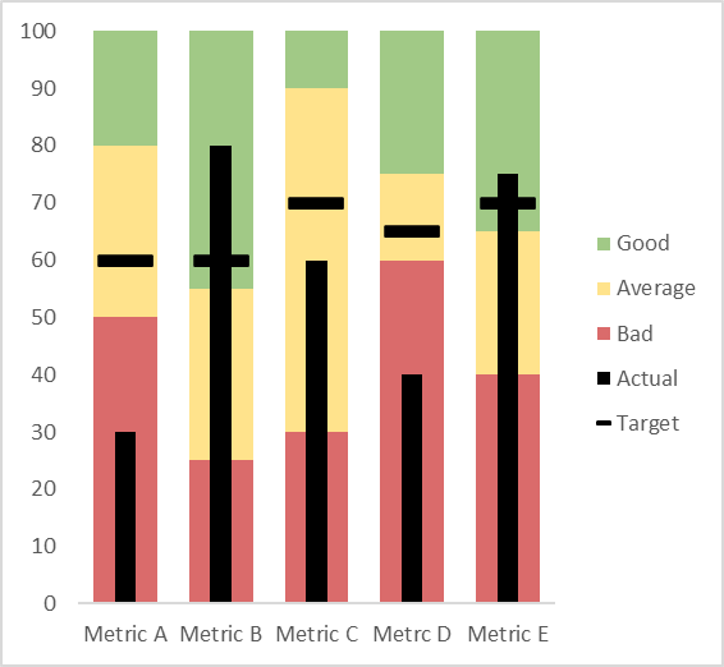
Bullet charts are bar charts showing a performance metric evaluated against a target represented by a marker. Qualitative bands to make judgements like good, fair, or bad are also sometimes added to provide additional context to judge the performance.

This simple structure means that they have a wide range of business applications and are an indispensable tool today in the visualization arsenal of every analyst, report developer, or decision maker.
Bullet charts provides a clear and concise visualization of data, offering more information and detail than traditional charts. Understanding when and how to use a bullet chart can greatly enhance your ability to effectively communicate and interpret data. Let us discuss some use cases below.
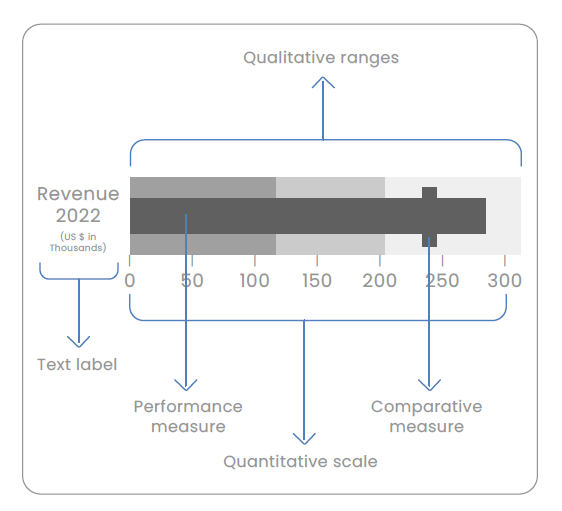
Bullet charts are used when we want to compare a primary measure (called the performance measure) against another quantitative value (called the comparative measure). The comparative measure can be a target, a forecast, a prior year comparison, or an expectation.
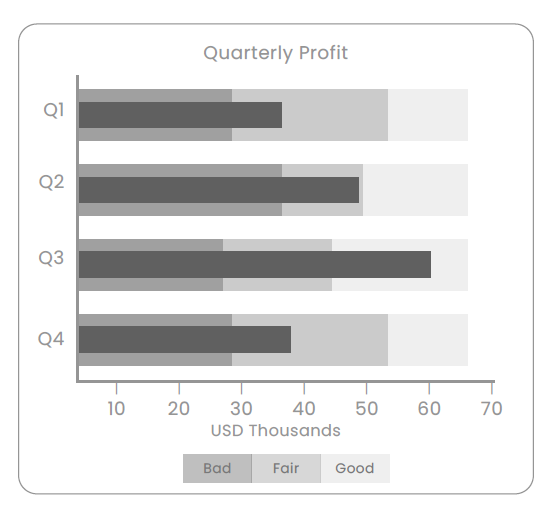
One of the biggest advantages of using a bullet chart is that it allows us to make qualitative judgements, such as “good,” “fair,” “satisfactory,” or “bad,” of our performance measure. This is indicated by the qualitative ranges set behind the main measure.
Bullet charts are an excellent choice when we want to add context to understand a measure better. A bar chart that plots a revenue of $3.2 million does not actually tell us whether this is a good outcome or not. However, a bullet chart can provide the following type of context to evaluate the revenue:
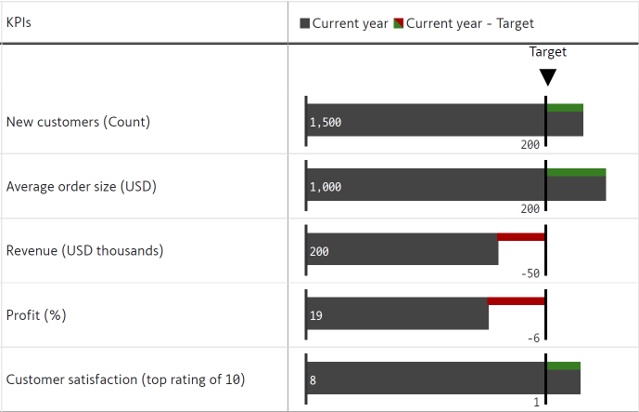
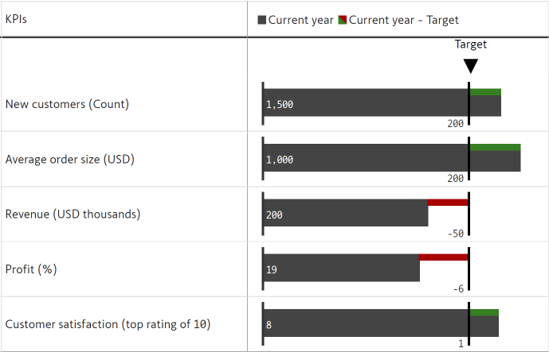
While bullet charts are well suited to showing metrics that are directly comparable, they are also popular in dashboards where multiple KPIs are presented to executives. To make KPIs of different ranges and proportions readable, we may normalize the bullet charts so that their targets are set to 100% as shown here.
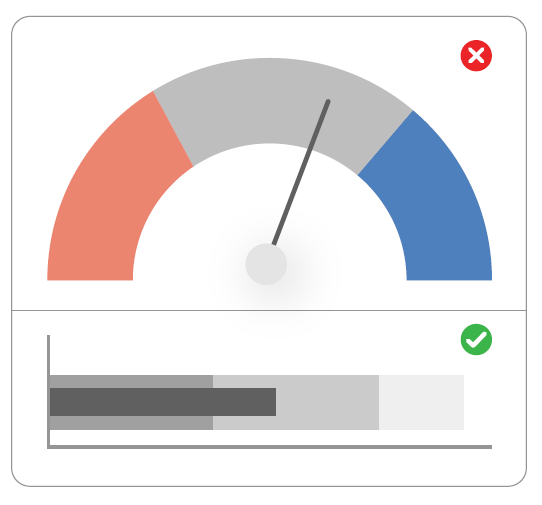
Bullet charts excel at packing large amounts of information in a small space. They make much more efficient use of the chart space than gauge and meter charts, which they were originally designed to replace.
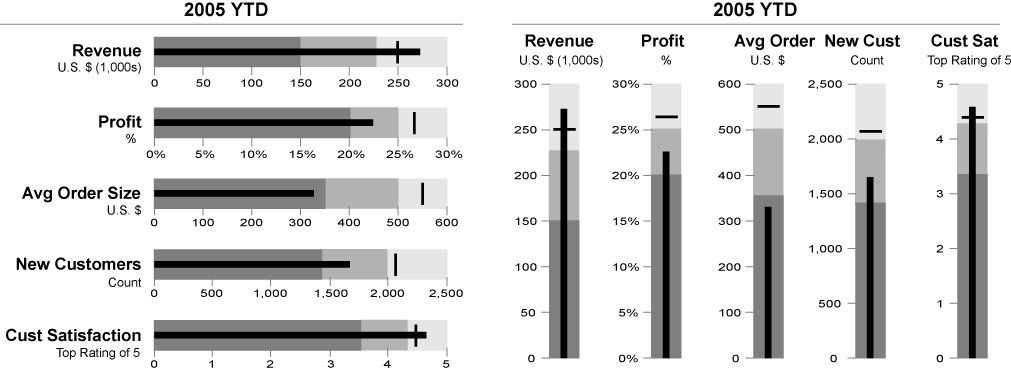
Bullet charts come in various types, each catering to different data visualization needs. Understanding the different types of bullet charts can help you choose the most suitable one for your specific requirements. Let us discuss some variations below.
There are two common variations of the standard bullet chart: vertical and horizontal.
Horizontal charts are well suited to holding long category names, while vertical charts work well for categorical data or data with a natural order, like age buckets or time series that are read best from left to right.
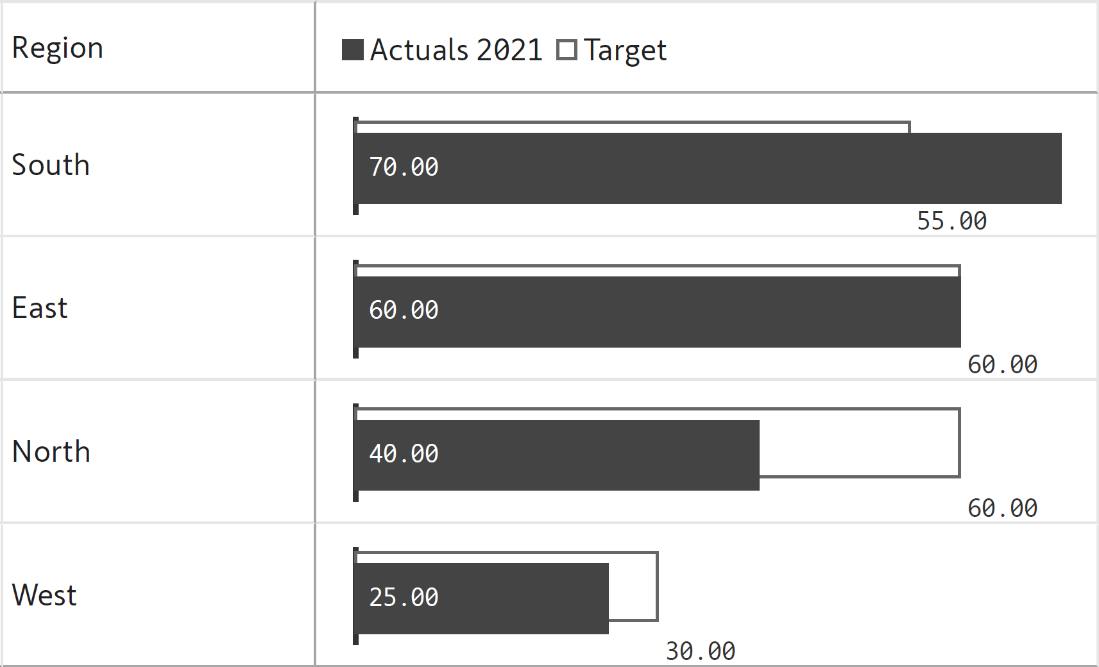
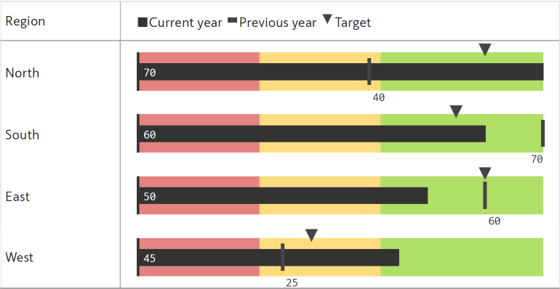
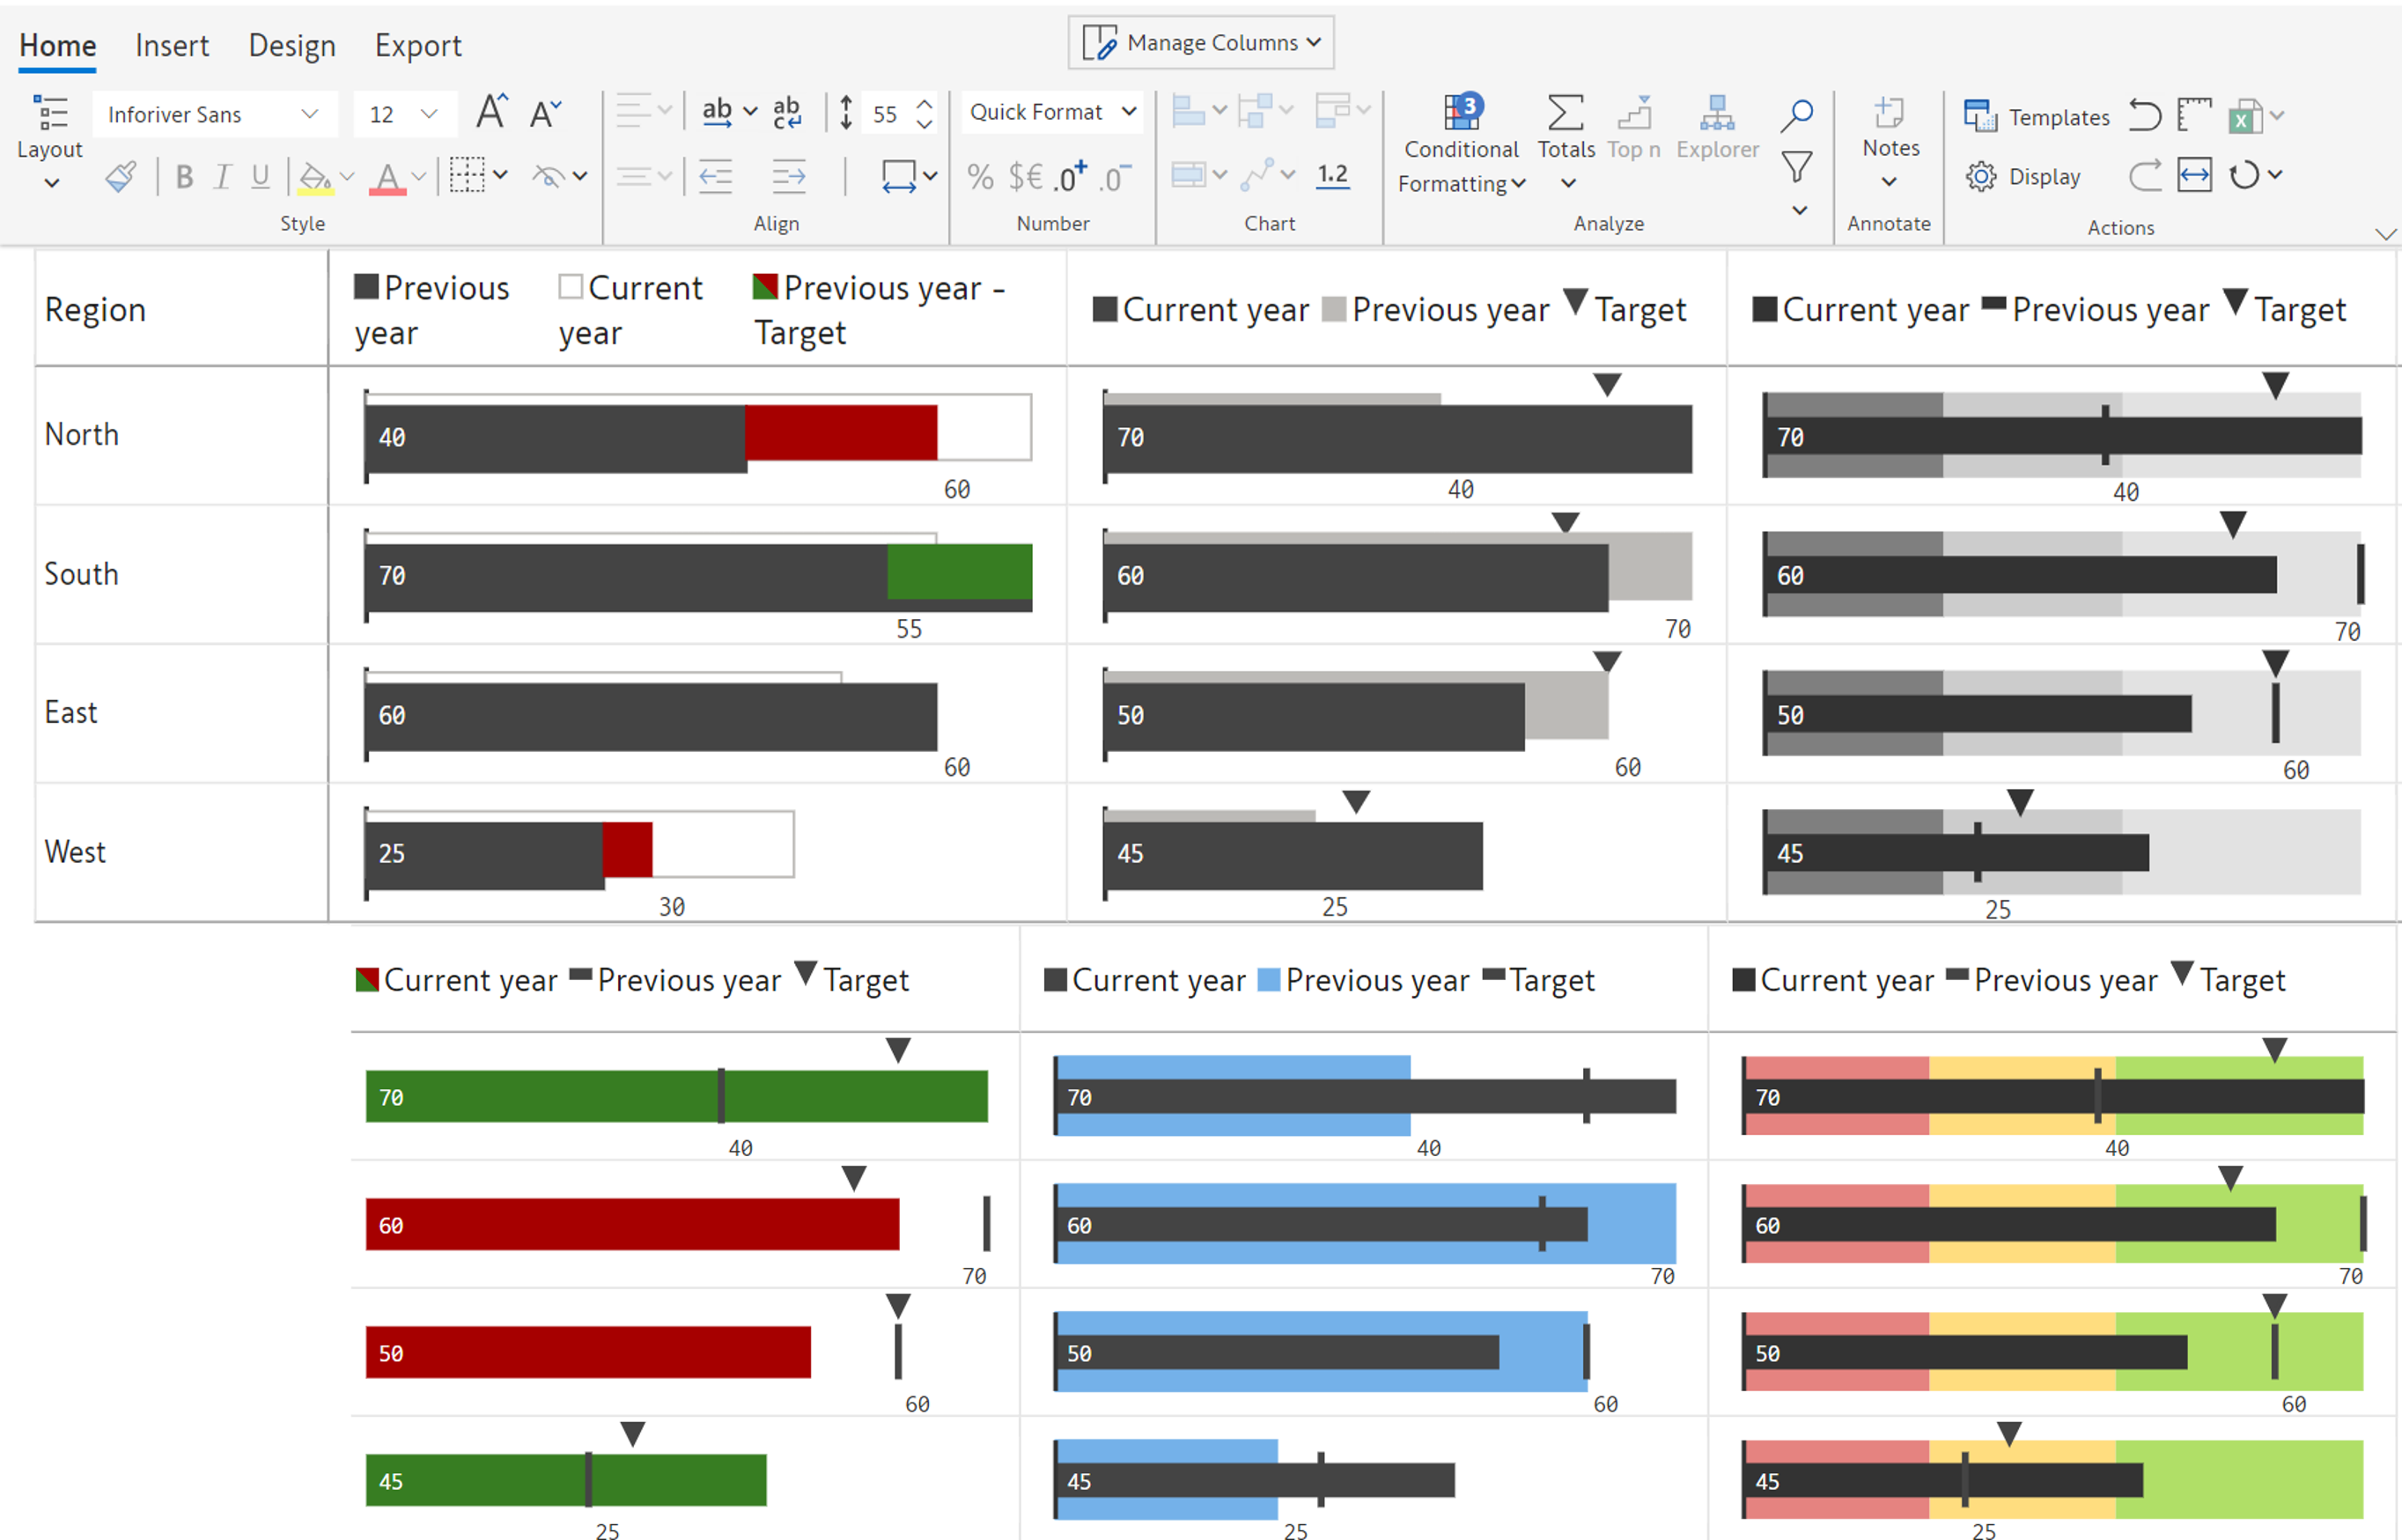
In this version of the bullet chart, the performance measure is shown as a darker bar in the foreground and overlaps a lighter bar denoting the comparative measure. This setup makes missed targets stand out, as the comparative bar overtakes the performance bar. Check out the North and West regions in the chart below for an example.
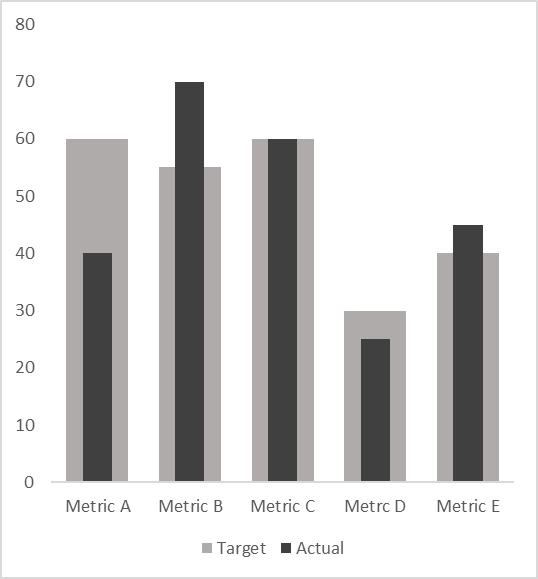
A simpler variation of the overlapped bar chart is shown below, which centers the performance measure as a thinner bar against a lighter bar showing the benchmark measure.
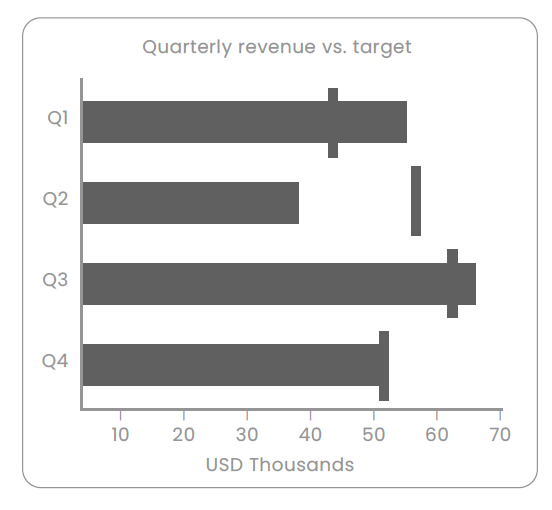
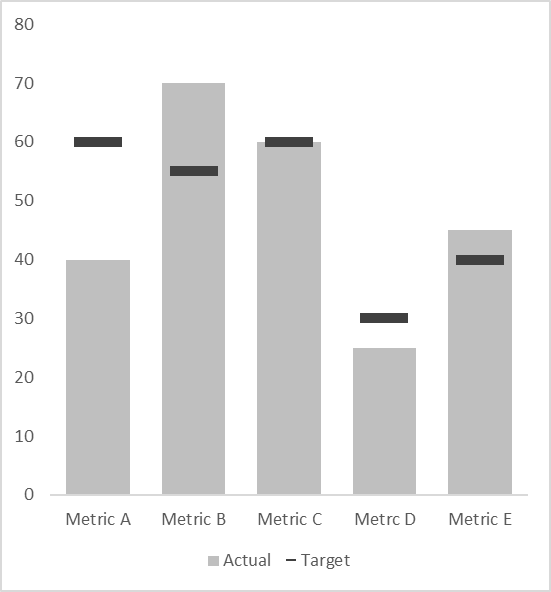
One of the simplest variations of the bullet chart combines a bar chart (representing performance) with a target marker as shown below.
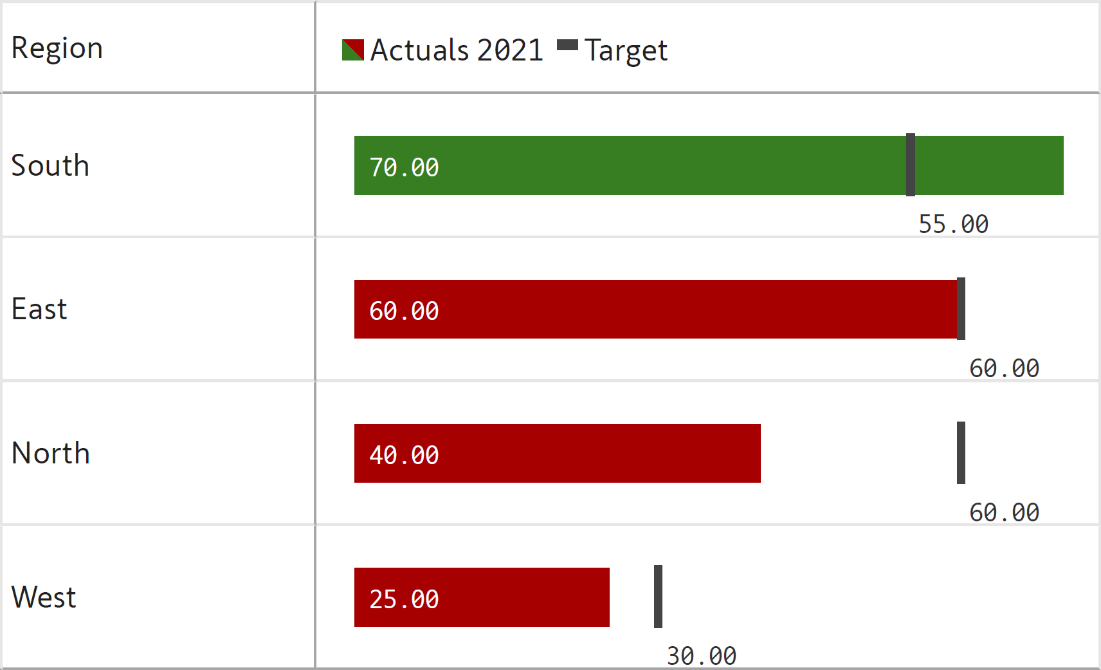
To simplify interpretation, the performance measure in the chart can be shaded green for met targets or red for missed ones. This visual cue helps readers quickly scan numerous categories, as seen below.
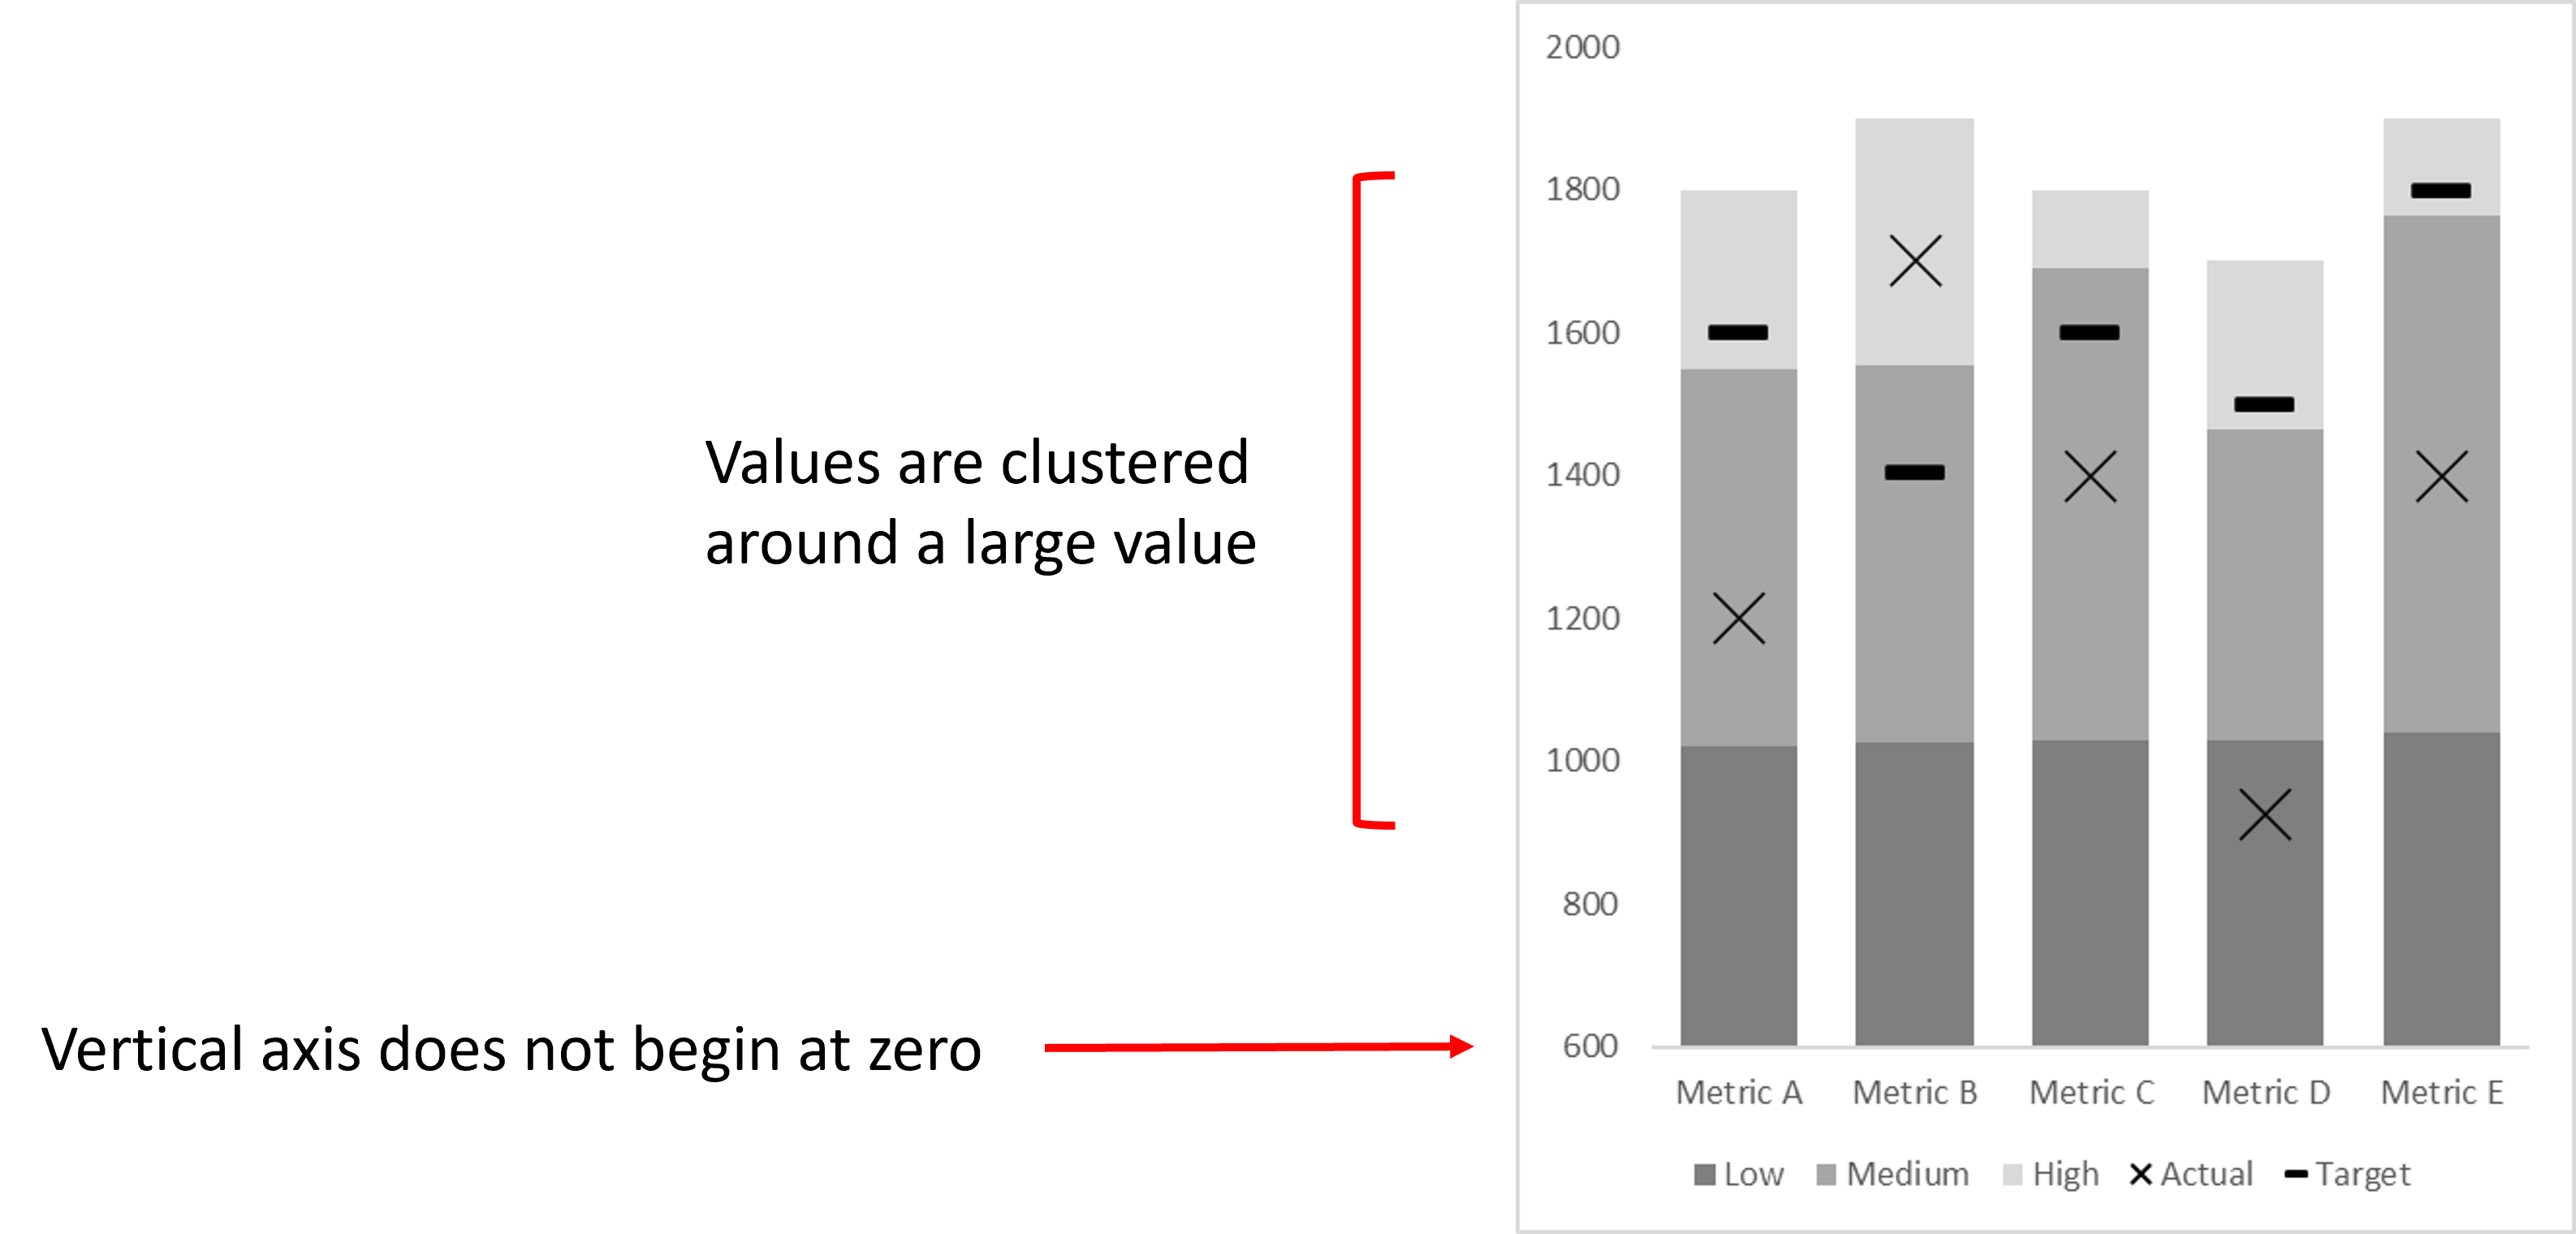
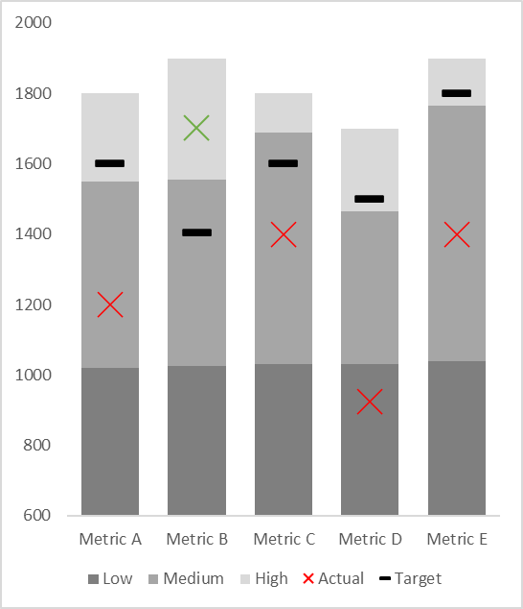
When we cannot start the Y-axis at zero (for example, when the target & performance markers are too close to each other), we may avoid truncated performance bars – which may be misleading – and instead, opt for ‘X’-shaped markers. As the performance bars rely on their height for interpretation, truncated bars in this instance can be misleading.
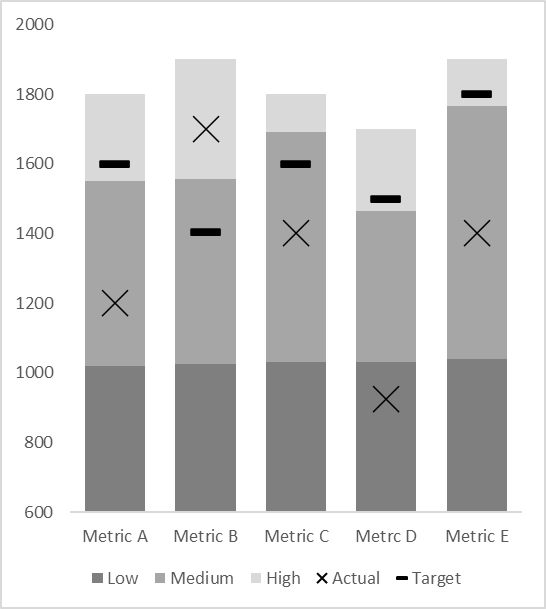
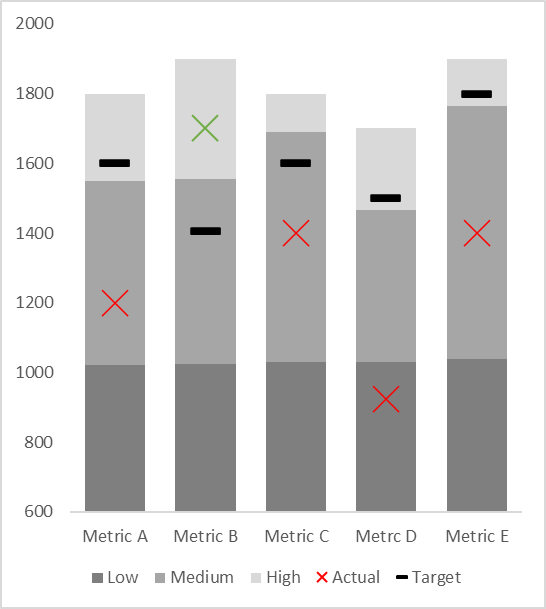
The performance markers can also be colored to help the user quickly understand which categories have performance exceeding the benchmarks. For example, the chart below immediately tells us that only Metric B has met the target.
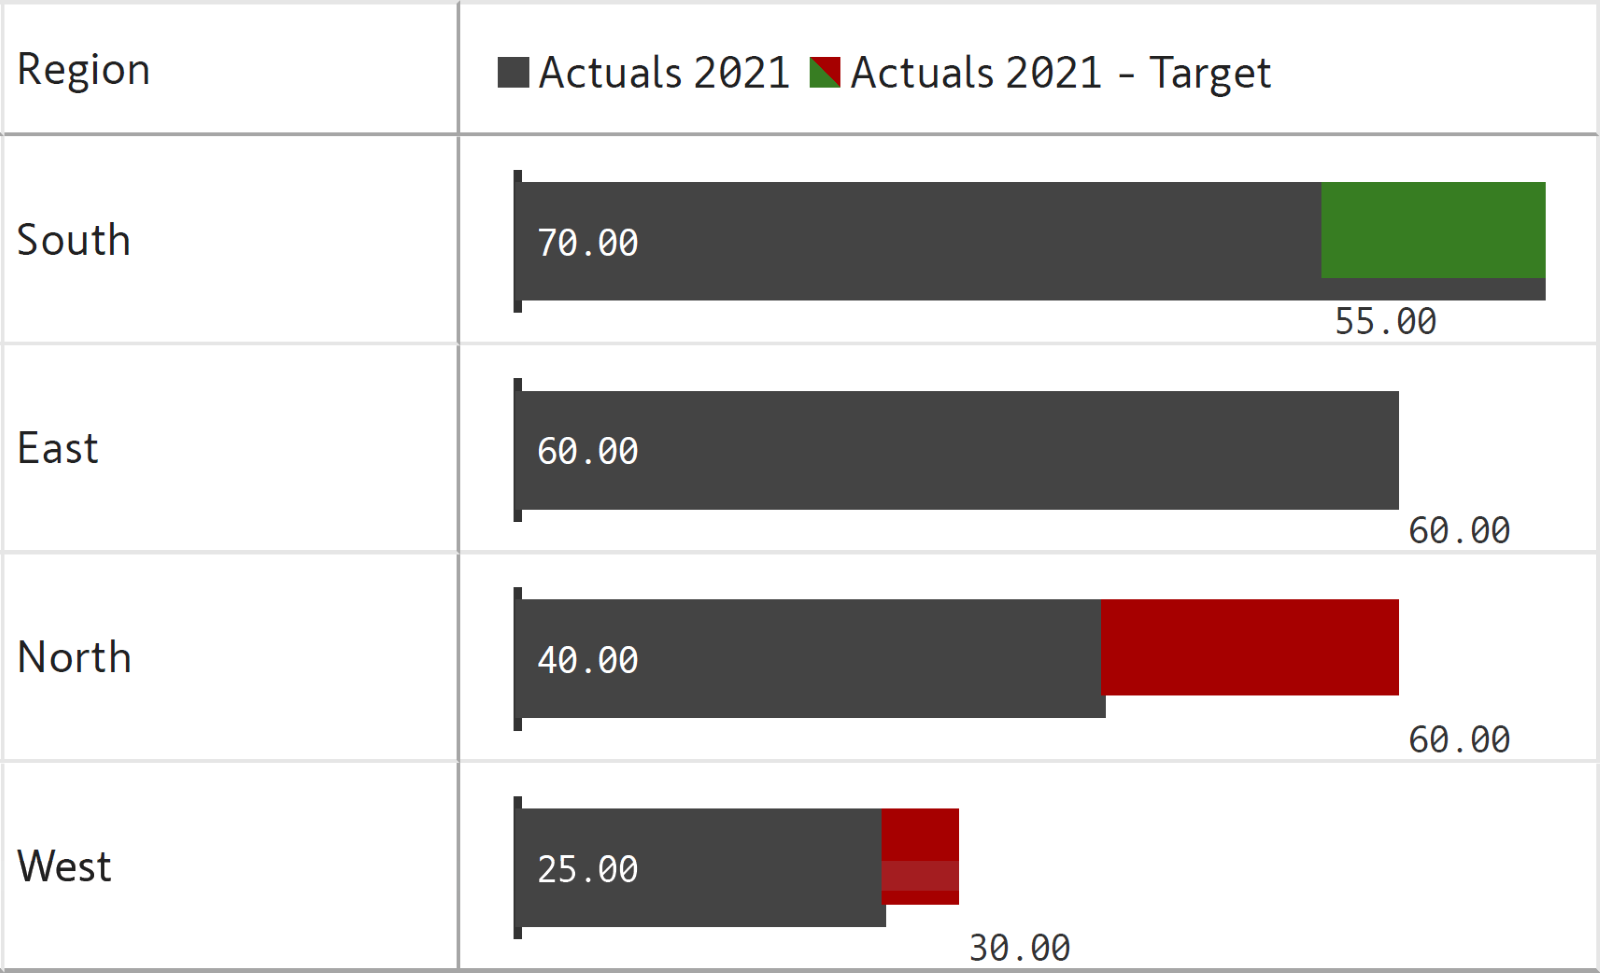
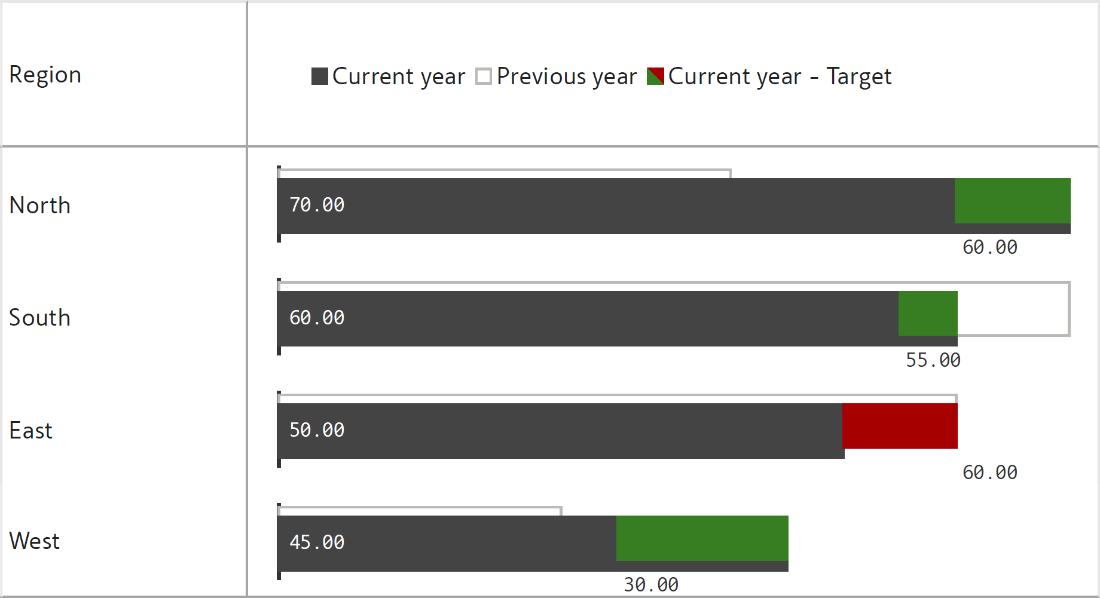
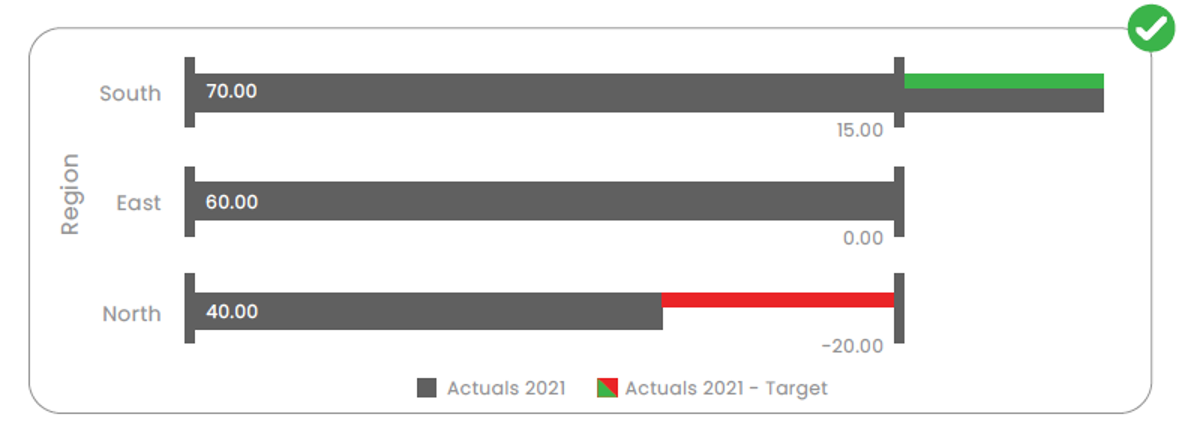
Another type of bullet chart is the integrated variance bar, which shows shortfalls (in red) or excesses (in green).
For example, in the South region below, the target of 55 was exceeded with a value of 70, shown in green. In contrast, the North region fell short by 20, highlighted in red.
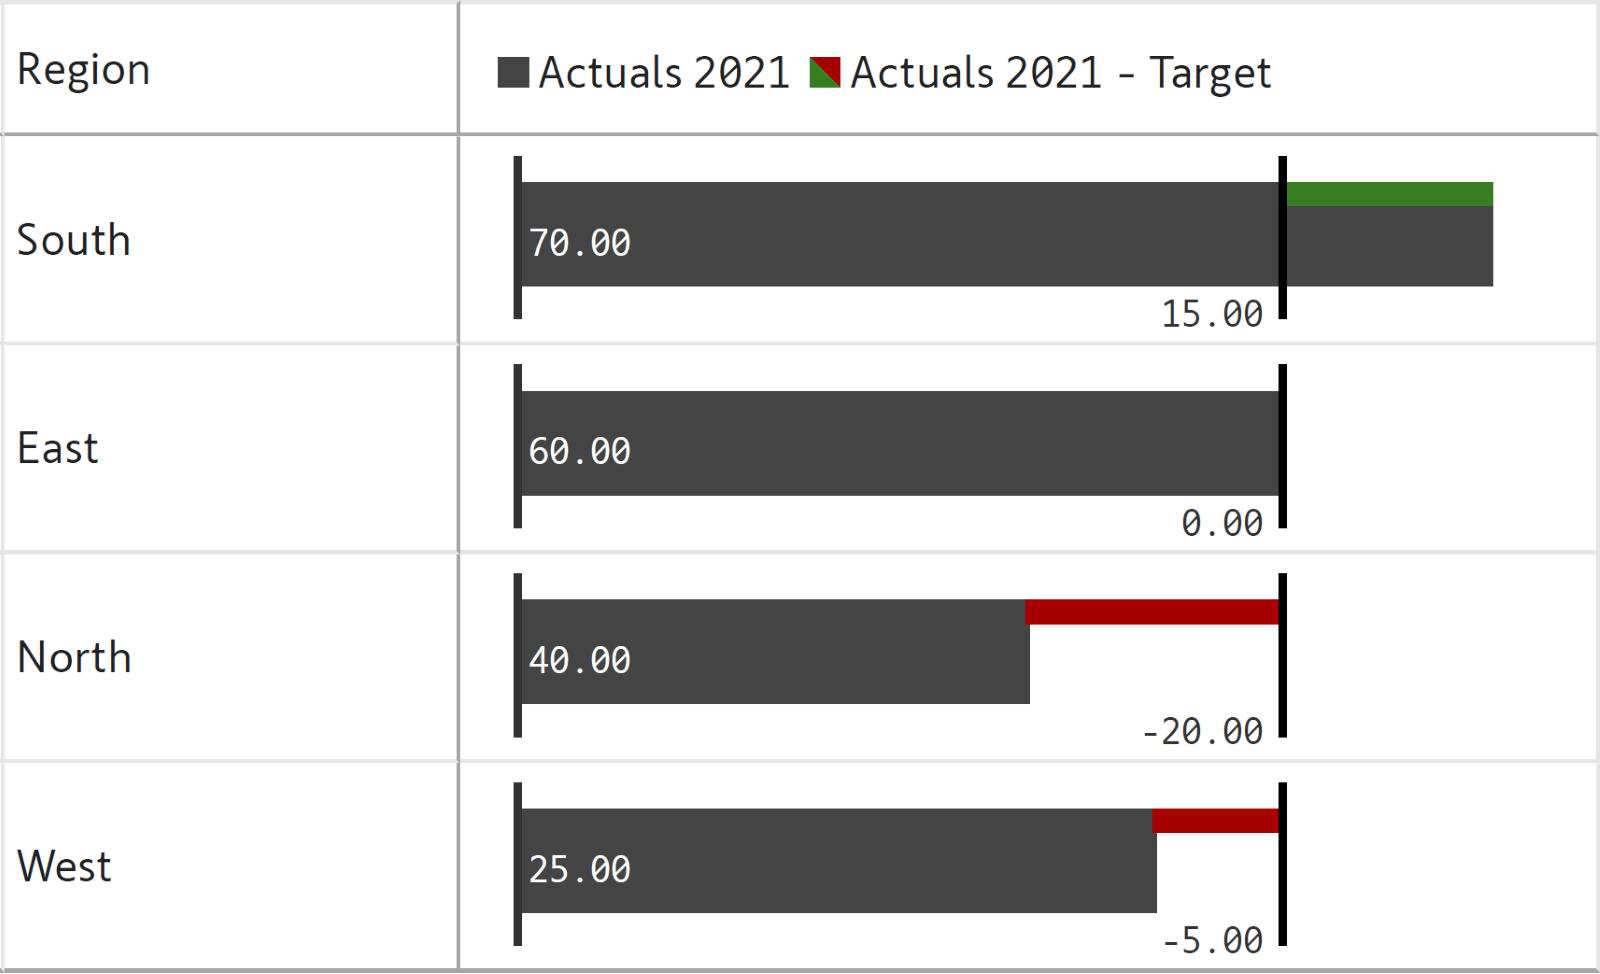
The IBCS-recommended bullet chart normalizes all targets to 100%, aligning their targets regardless of magnitude. Green and red bars are indicative of % variance or deviation, showing overachievement in green and underachievement in red.
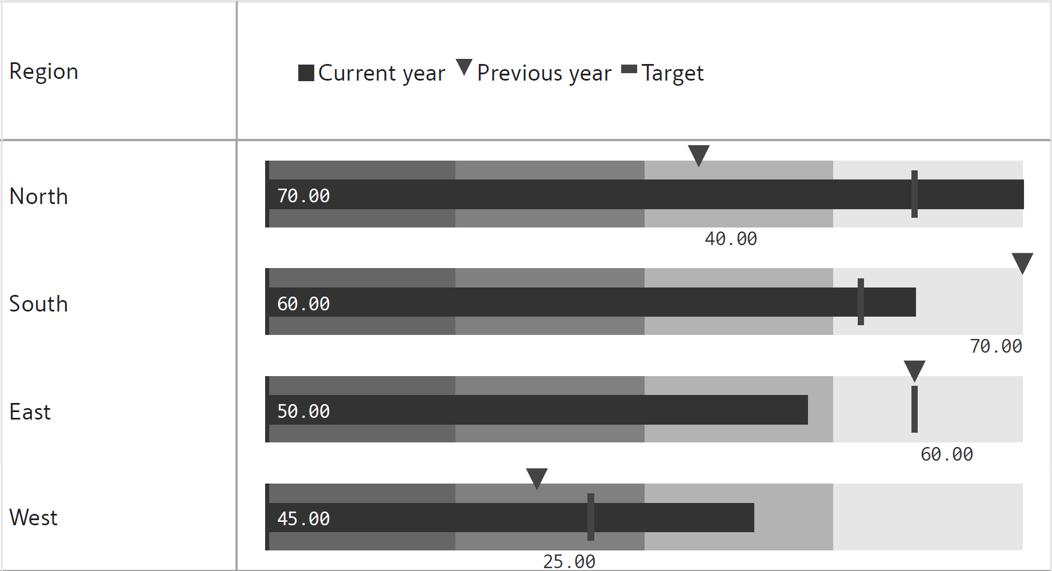
Bullet charts can display multiple comparative measures using markers of different shapes. For example, the chart below uses a triangular marker for the previous year's value and a line marker for the target.
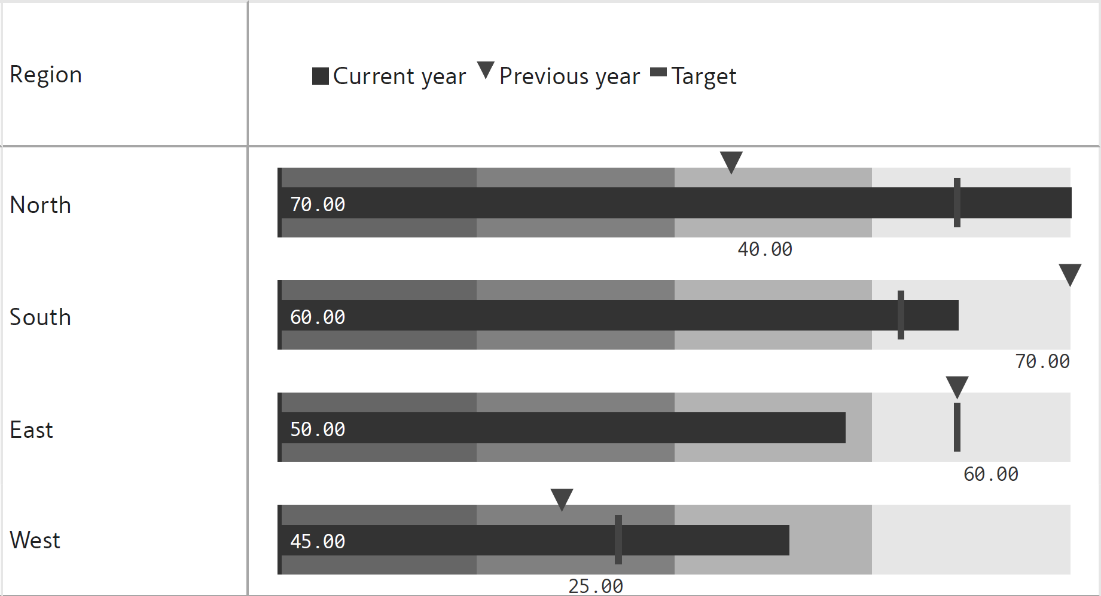
Another option to show two comparative measures is the overlapped integrated variance bar. This chart is similar to the integrated variance bar discussed above but adds an overlapped white bar representing the second comparative measure just behind the integrated variance bar.
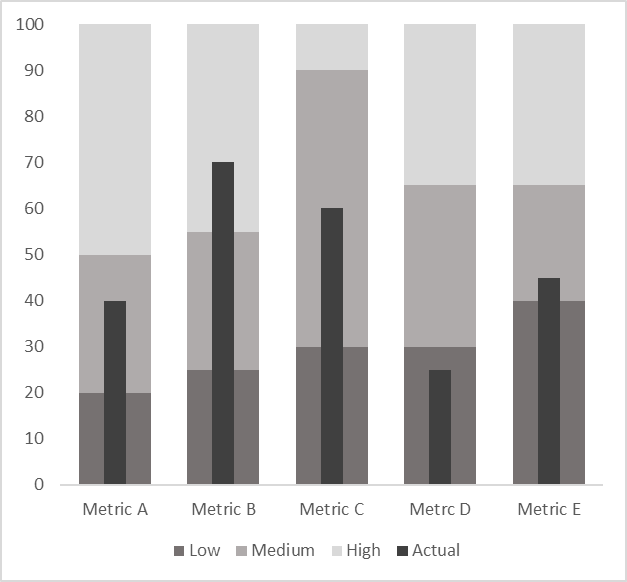
Sometimes, we assess values based on subjective criteria rather than specific targets. In such cases, we can skip the marker indicating the target and use just the qualitative bands instead.
Implementing best practices when creating bullet charts can significantly enhance their effectiveness in conveying information. By following these best practices, you can ensure that your bullet charts are clear, informative, and impactful. See some best practices below.
Look at these two charts, they show the same insights but with one crucial difference: the vertical axis starts at zero for the first chart but not for the second.
A user looking at the second chart is likely to assume that Metric B is almost three times the size of Metric A, which would be a misinterpretation of the data.
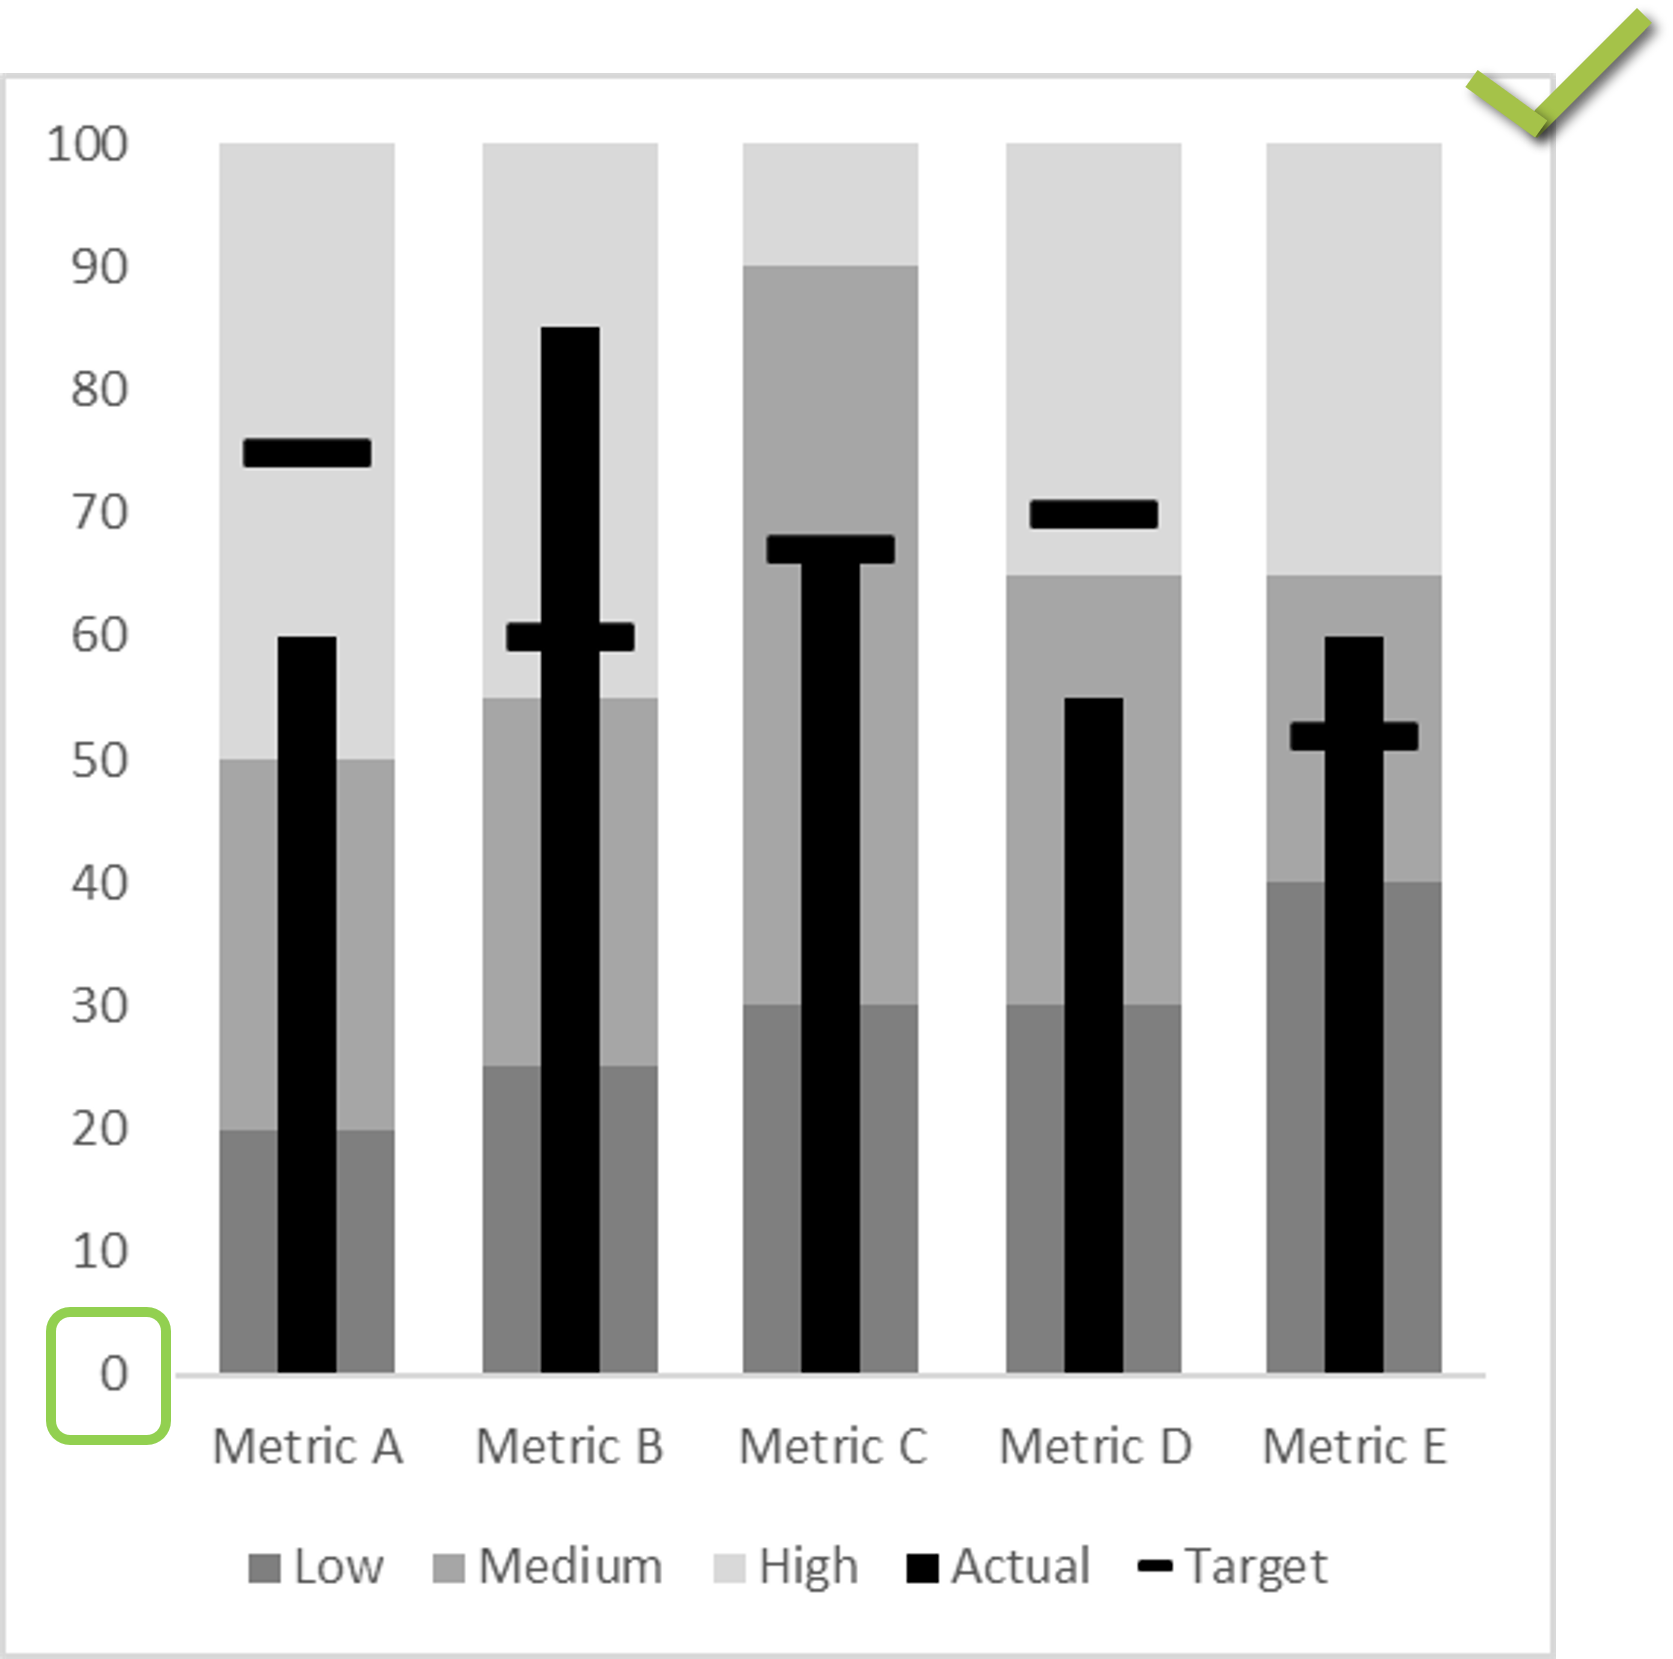
Sometimes, it is not ideal to start the y-axis at zero. For example, when we have extremely large values that are all closely clustered, we may want to “zoom in” by truncating the y-axis. In such cases, we may use markers instead of bars to denote the performance measure as seen here.
Readers then use the marker's position to read values. This helps when values are large but close together, like in the image below. Here, the “X” marker indicates the actual values.
Color helps highlight specific parts of a chart, but using too much color can be distracting.
Instead, use different intensities of the same hue, along with a legend showing what each intensity represents, as seen below.
Choose colors that clearly distinguish between the comparison bands and the performance bar. Ensure enough contrast between the bands themselves to accurately gauge their ranges.

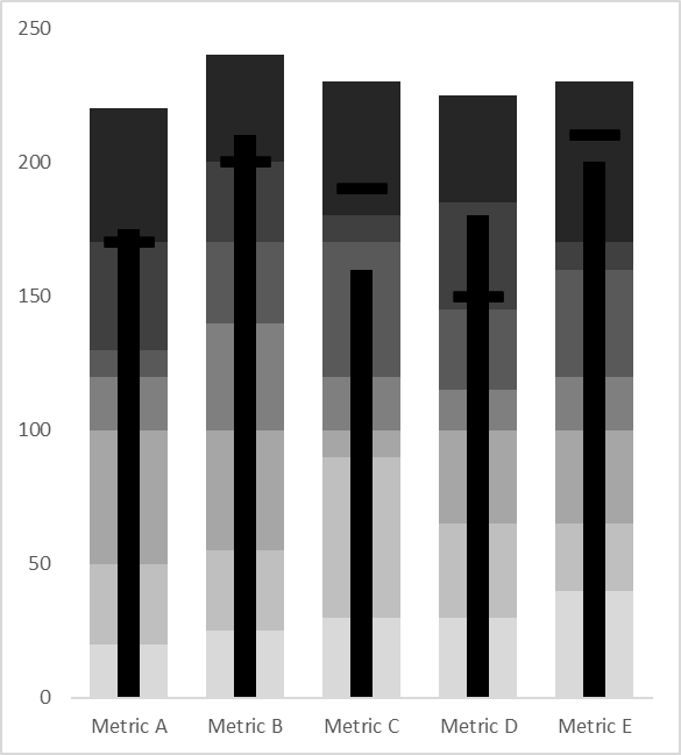
Keep comparison bands to a maximum of five. This ensures enough contrast between bands for clarity and makes it easier to see the performance bar against darker bands, as seen below.
While we try to limit our usage of color to parts of the chart, we wish to draw attention to, in cases where it is necessary to use color, consider using a color-blind-friendly scheme, like the orange and blue palette used below.

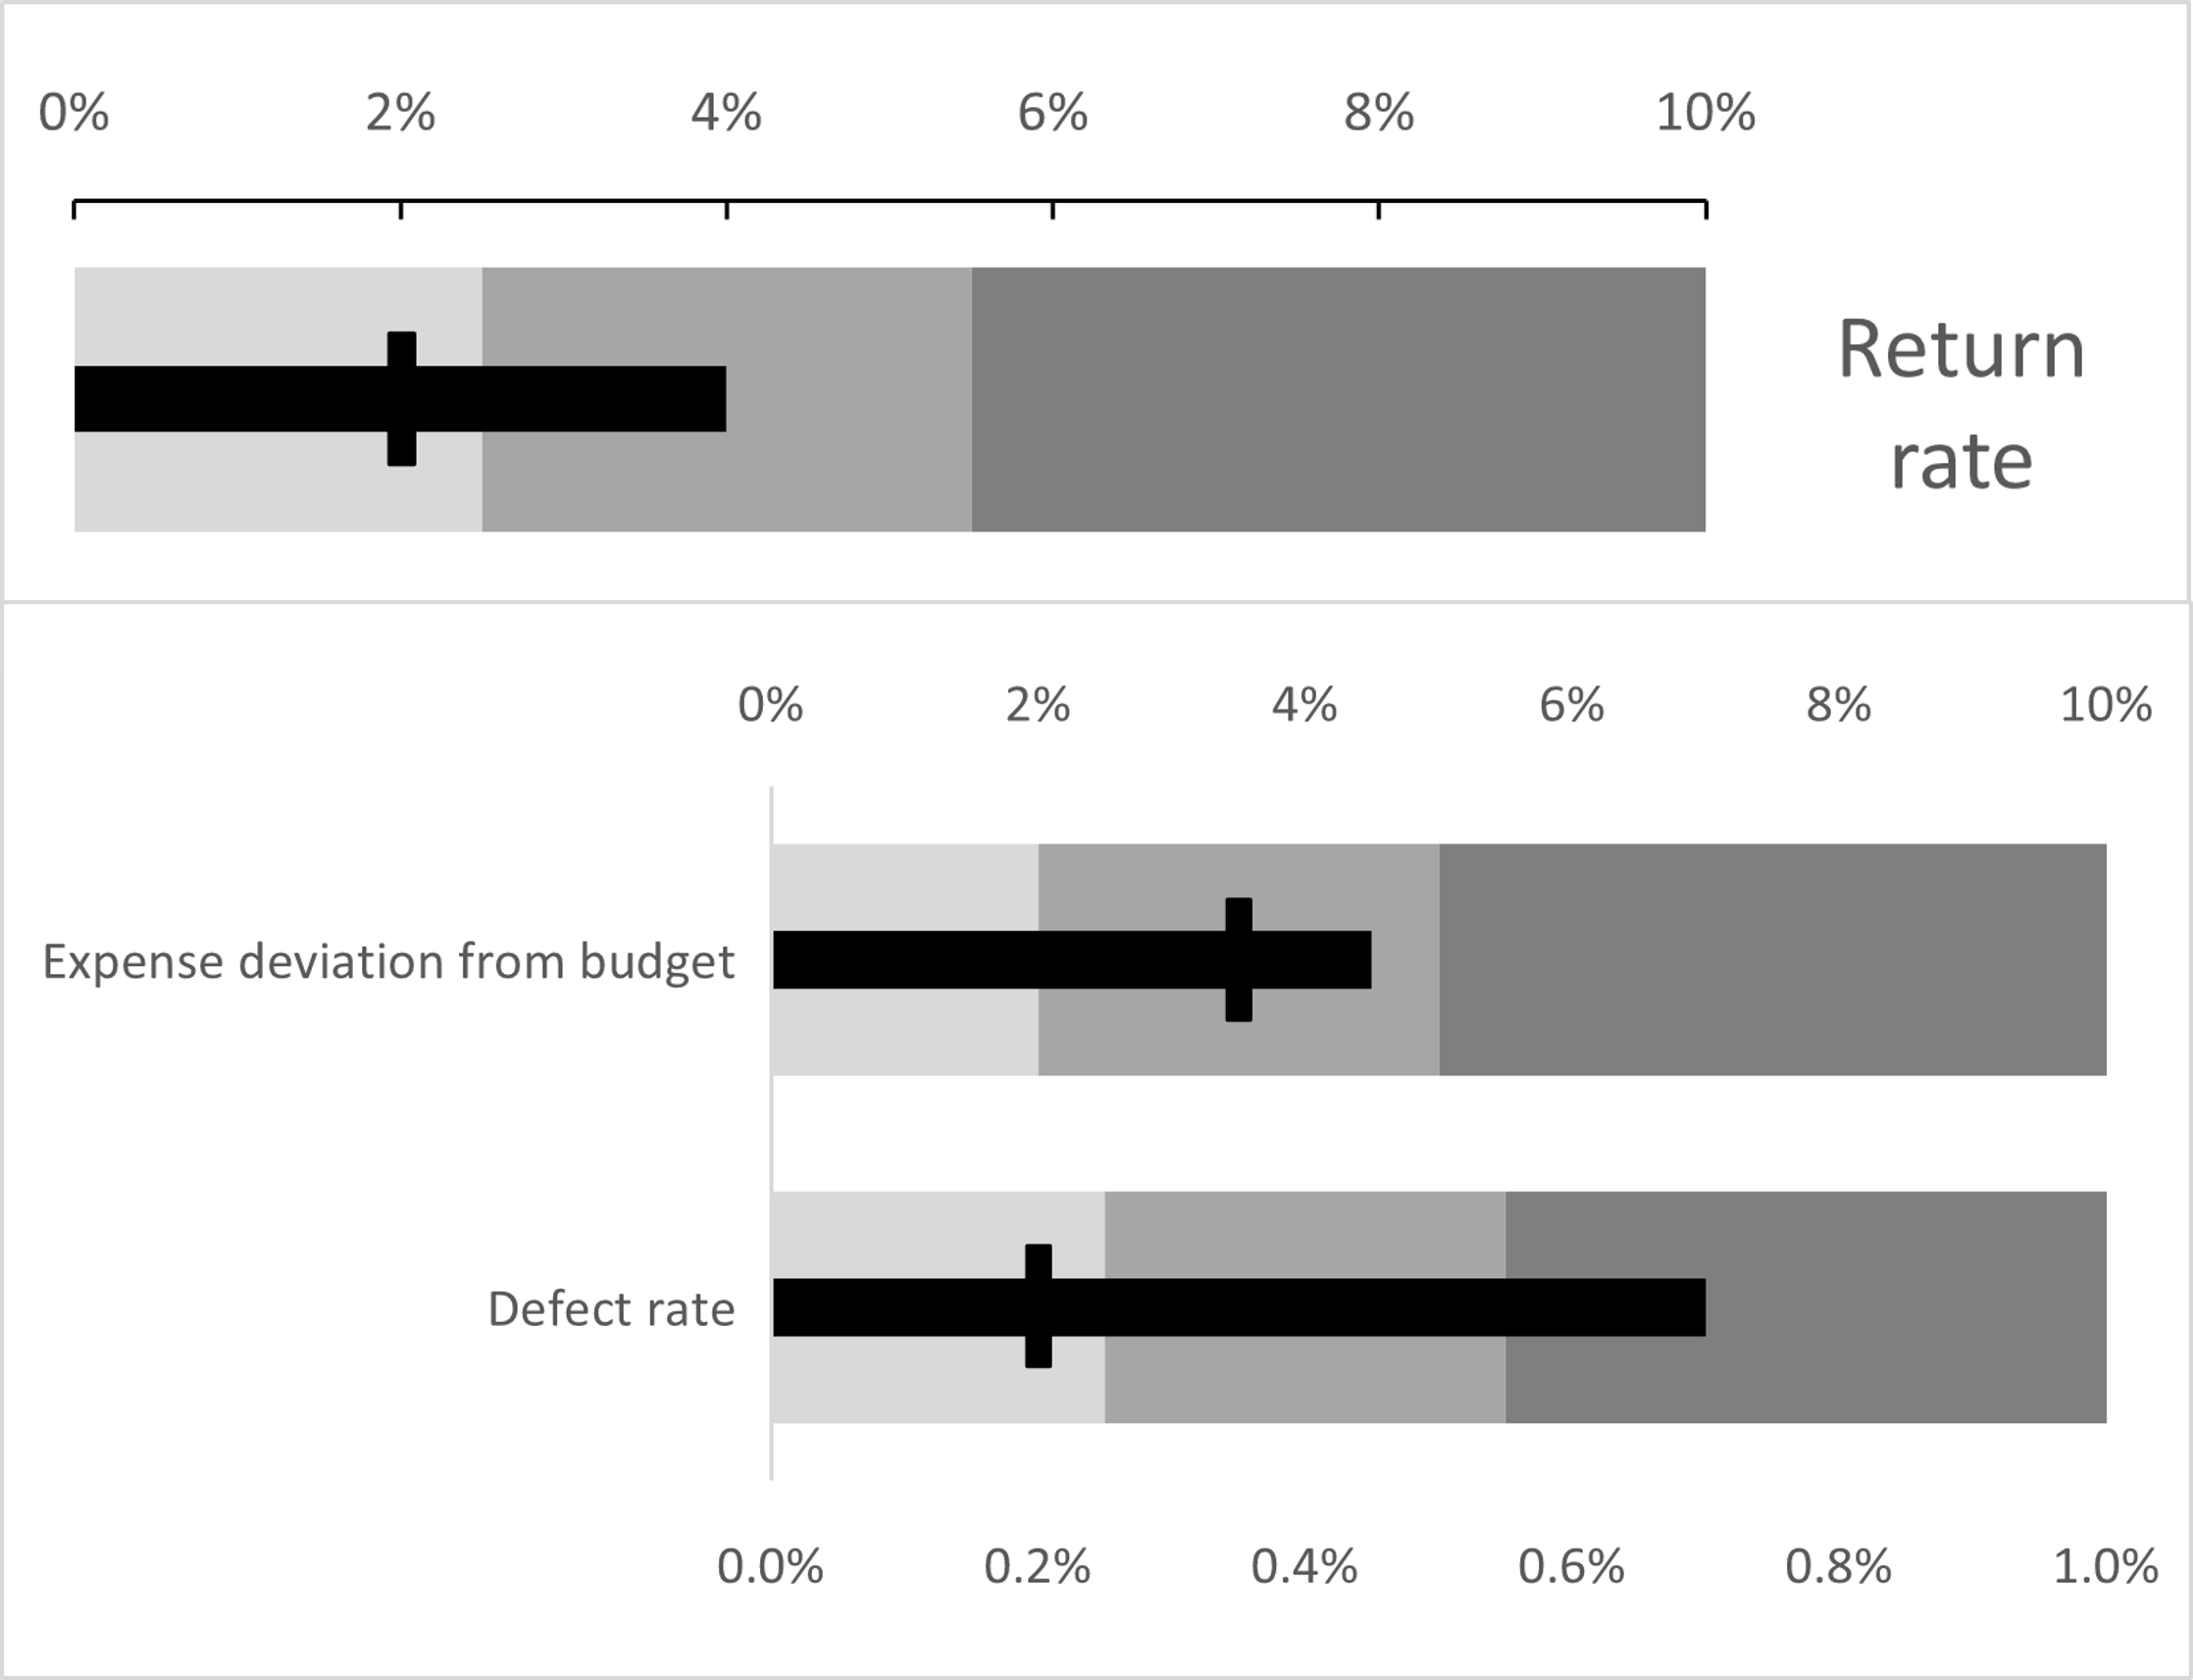
Targets aren't always about hitting a goal; they can also set upper limits, like for costs or defects. This is a case where lower numbers are more desirable, and we may reverse the qualitative scale to use lighter shades for lower numbers as shown. This is also applicable to negative figures, such as expenses.
A bullet chart lets us compare different measures, like actual values against forecasts, targets, or previous year values. We can even add a second comparison with markers like ellipses or triangles.
For example, this chart compares current year values with targets (line marker) and previous year values (triangle marker).
Normalizing target markers in KPI presentations ensures consistency, setting them at a uniform level despite varied magnitudes or units by visualizing % variance instead of absolute values.
The scaled bars allow swift comparisons, facilitating easy understanding of metrics relative to their targets, whether falling short or exceeding expectations.
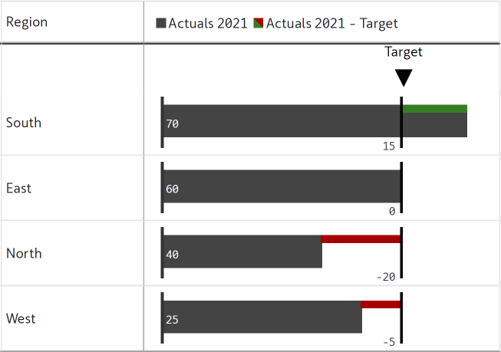
Improve dashboard clarity by using red for negative and green for positive variance in bullet charts. This color choice helps quickly understand differences, especially when scanning through multiple charts. Thinner bars also save space, making visuals clearer.
While bullet charts are effective in many scenarios, there are situations where they may not be the most suitable choice for data visualization. Understanding when to avoid using bullet charts can help you steer clear of common mistakes and choose alternative visuals instead.
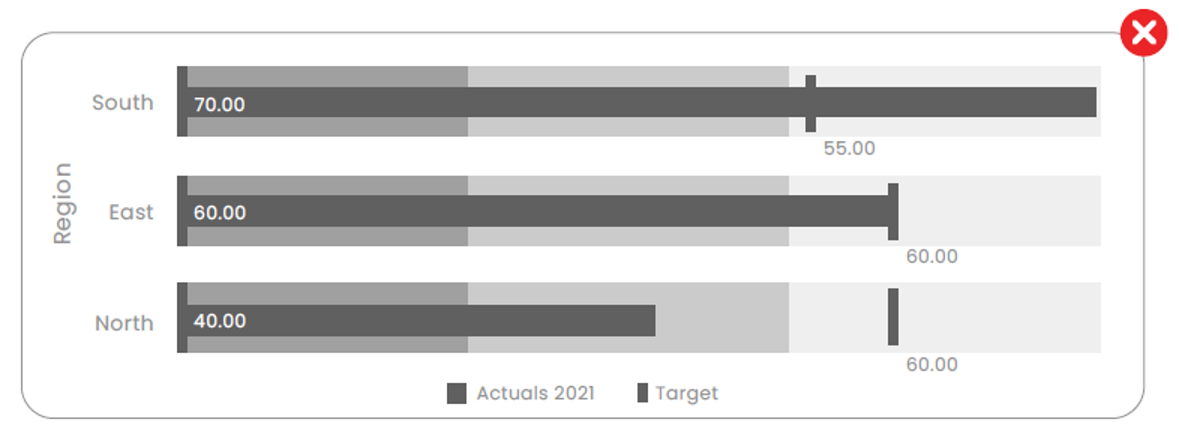
Standard bullet charts don't directly display the variance between actuals and targets. This is fixed by normalizing the target markers, enabling direct visualization of % variance, as in a 100% bullet chart.
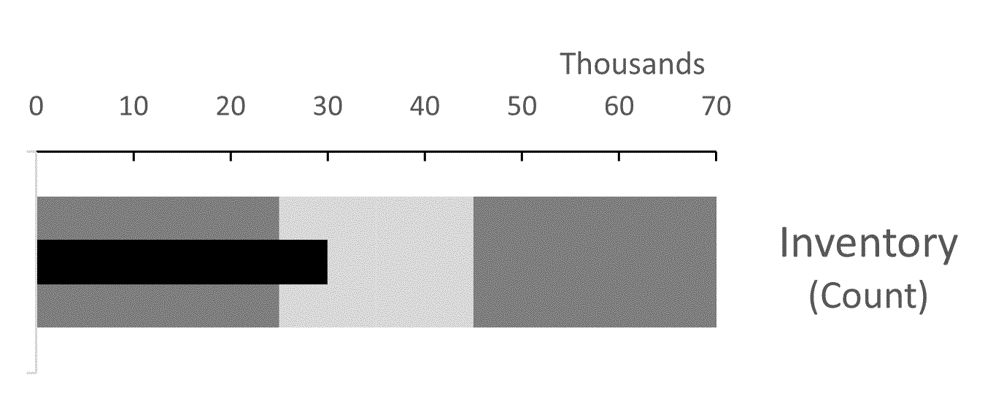
Goldilocks metrics have an ideal value range, not a specific target. It's tricky to show this in a bullet chart because values shouldn't fall short or exceed the range.
Multiple comparative measures are shown using different types of markers, but bullet charts can become difficult to read with too many measures. Consider using another chart type that is less visually complicated.

There are several alternative visualization methods that can be used in place of bullet charts, depending on the nature of the data and the specific insights you aim to convey. Exploring these alternatives can help you select the most effective visualization for your data.
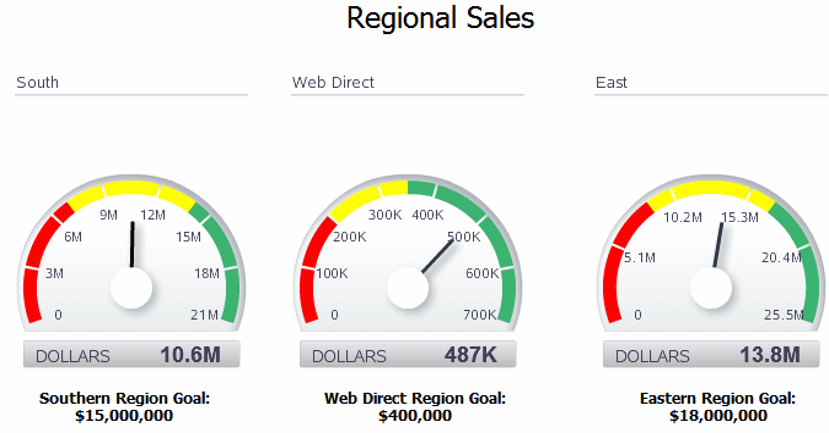
A gauge chart visually represents a single data point within a defined range, resembling a speedometer. It provides a quick and intuitive way to assess performance or progress, indicating whether the value falls within acceptable levels or requires attention.
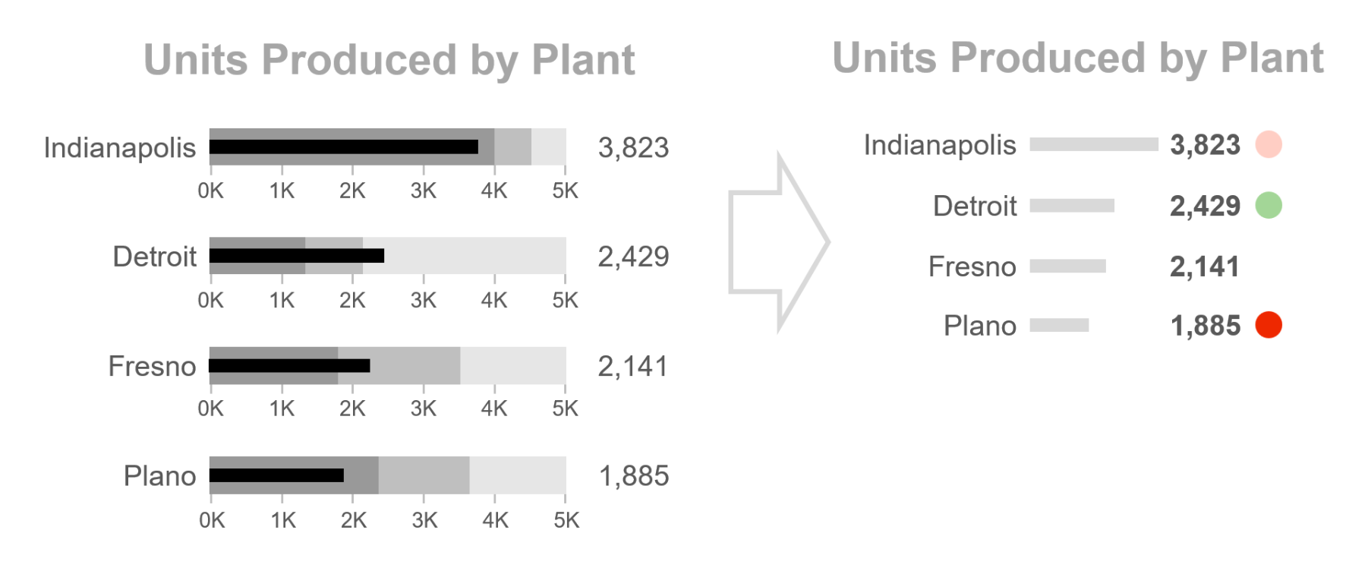
Action dots uses colored dots to indicate whether a metric needs attention. The intensity and hue of the dots changes according to the level of attention needed, which allows the reader to quickly scan large dashboards and pick out only the highlighted metrics.
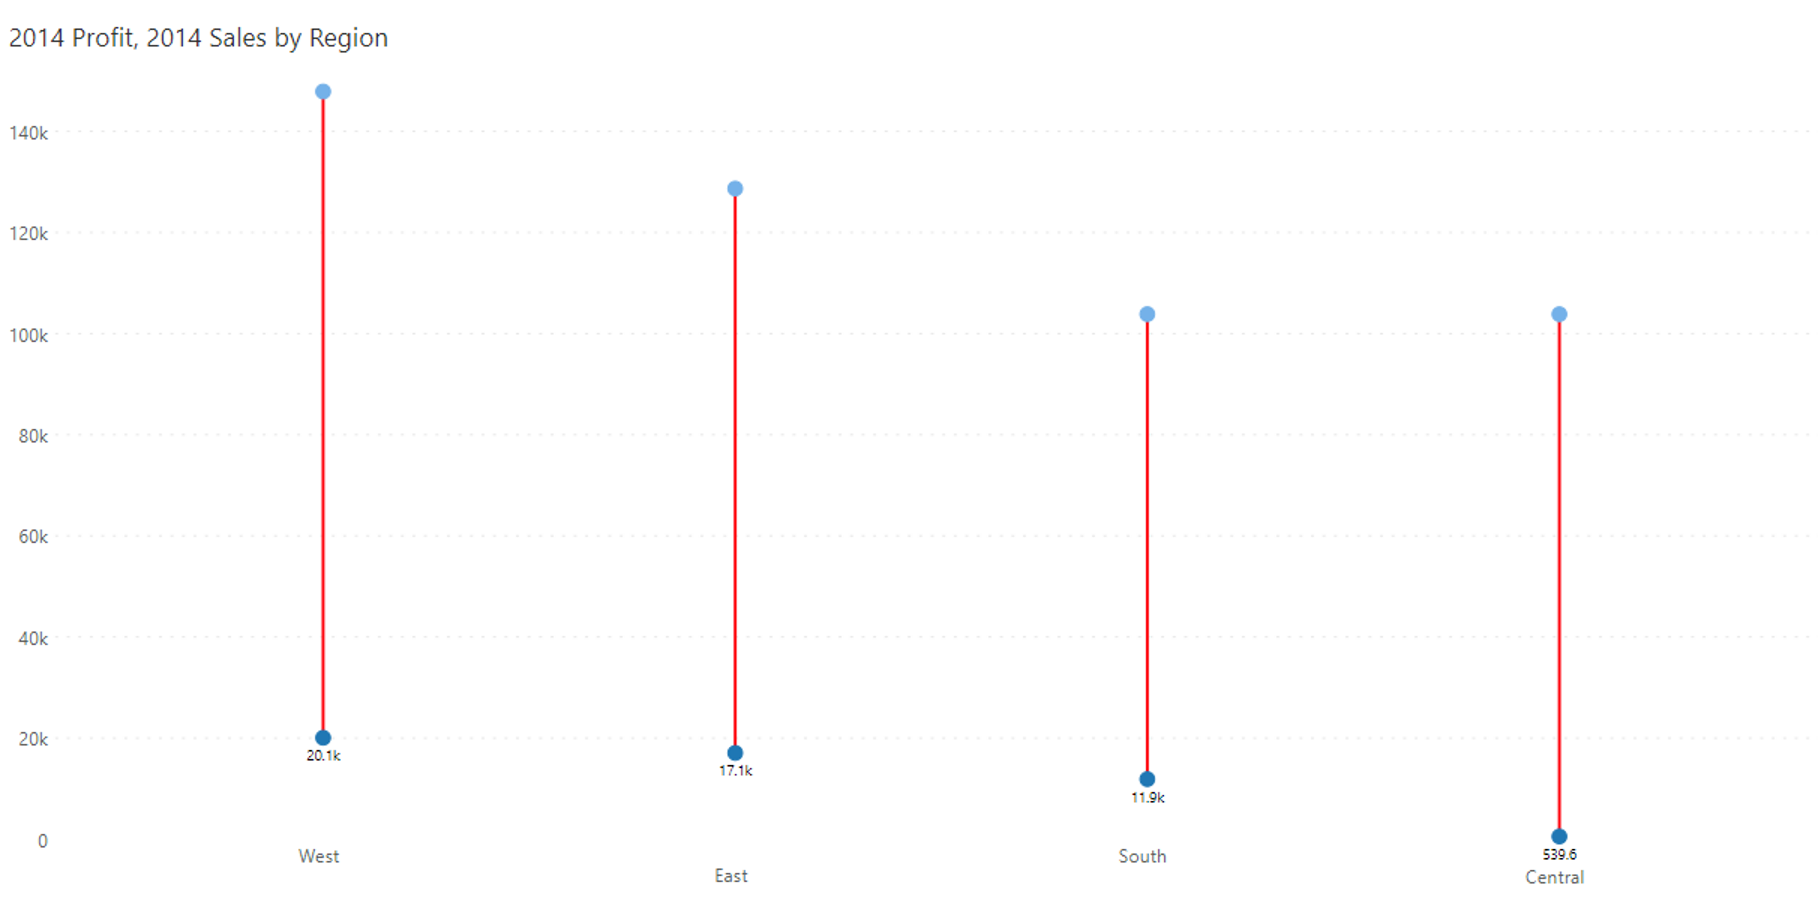
The dumbbell chart visualizes the difference between two data points with 2 end nodes connected by a line resembling a dumbbell. It effectively displays the contrast or change between two variables such sales vs profit, plan vs actual, etc.
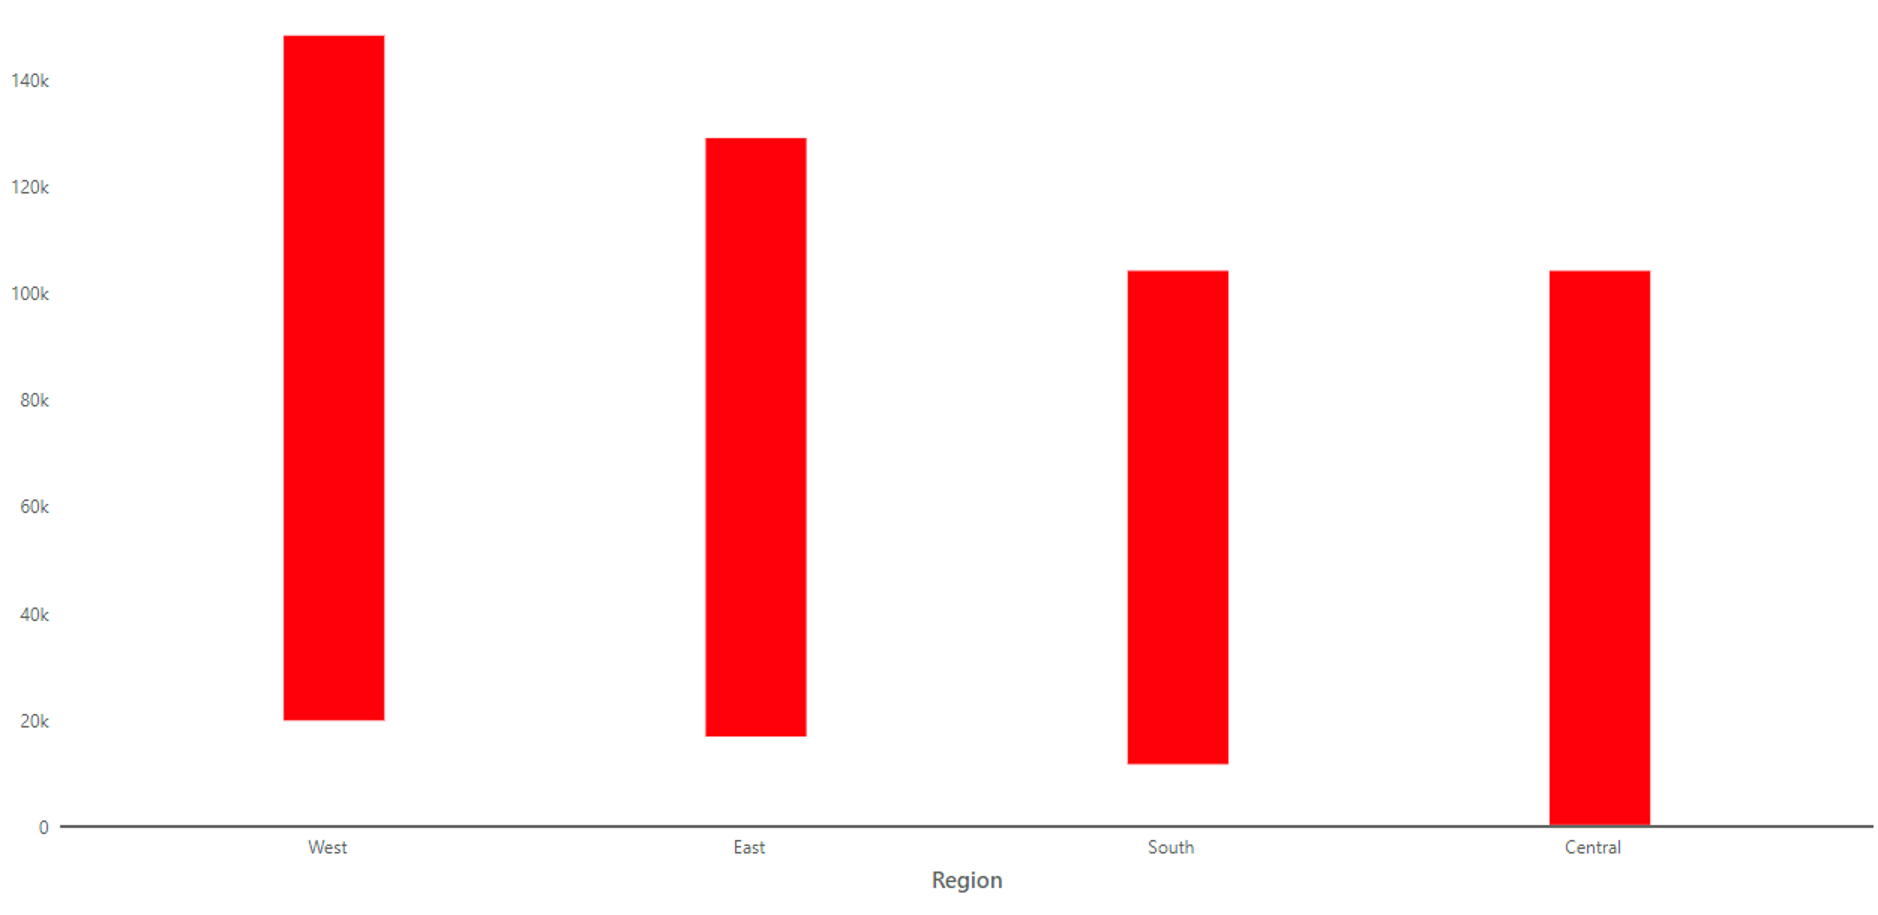
The range bar chart visually represents the range between high and low values for each data point. It provides a quick overview of variability and trends within a dataset.
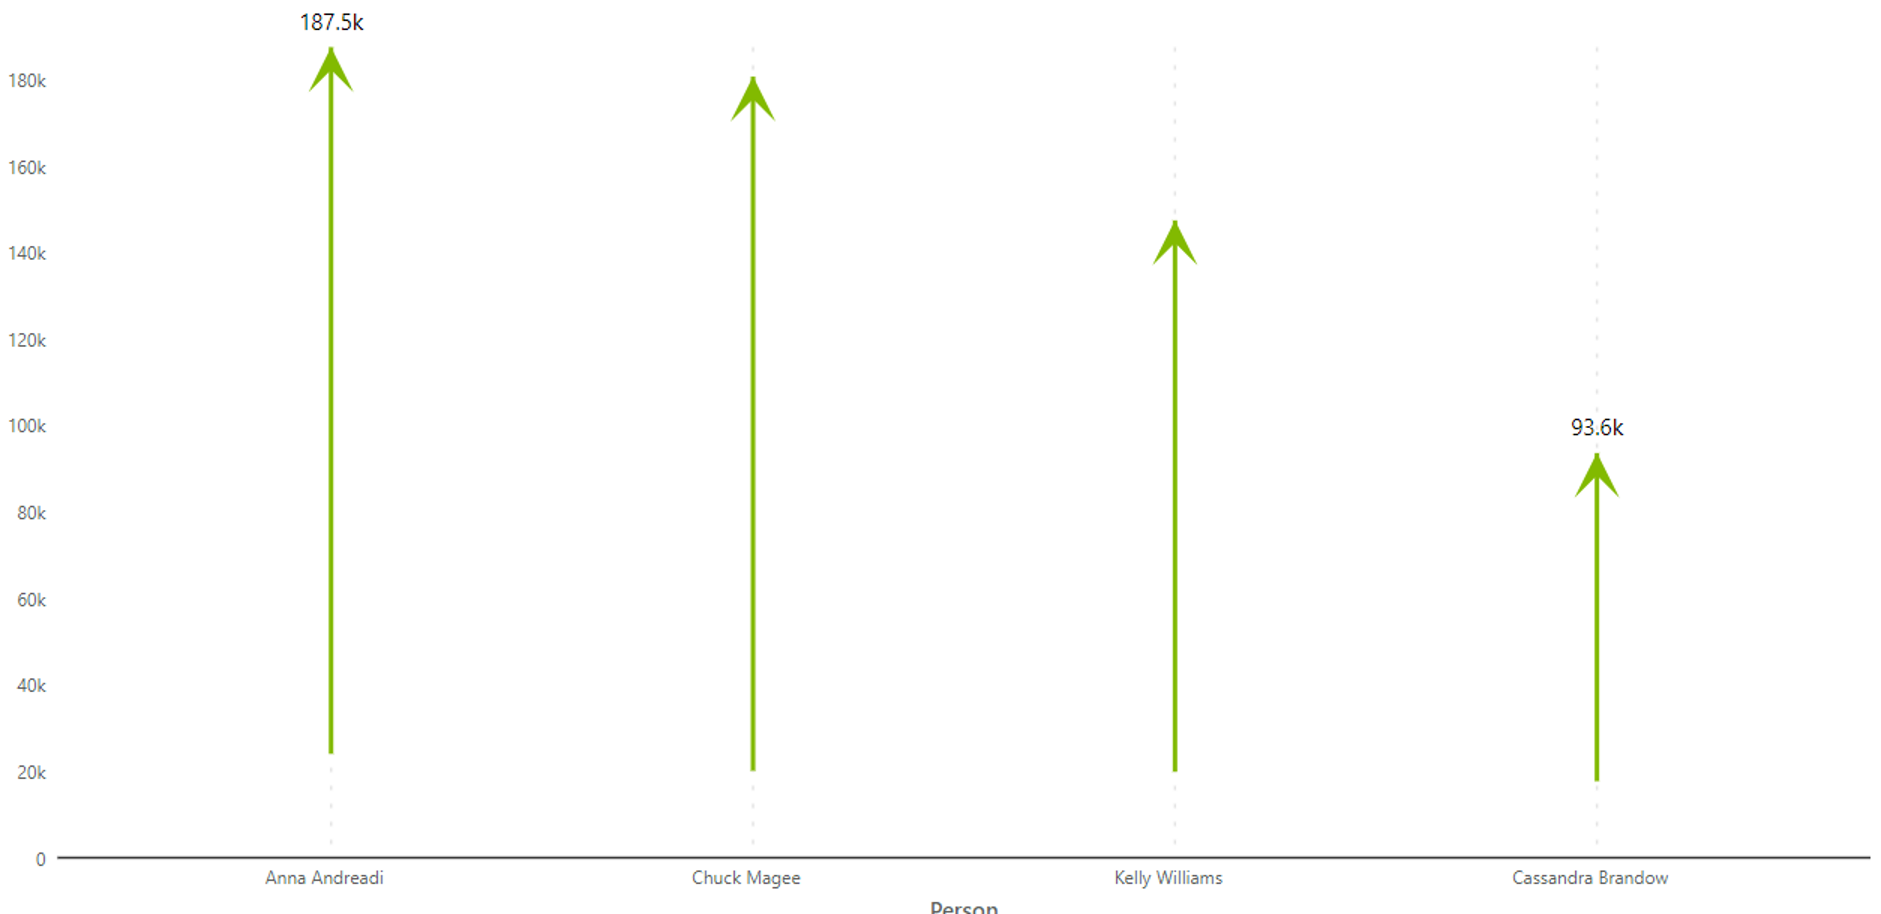
Arrow plot employs arrows to depict directional trends or changes in data. Arrows represent the magnitude and direction of these trends.
Bullet charts in Power BI, especially when using Inforiver, are powerful tools for visually comparing multiple measures in a concise and easy-to-read format. In Power BI, these charts allow for the simultaneous display of multiple measures in a single visual, making it easy to monitor progress and compare different data points. Inforiver offers various types of Power BI bullet charts, including 2-value & 3-value charts, clustered bar charts, and many more, each serving different visualization needs.
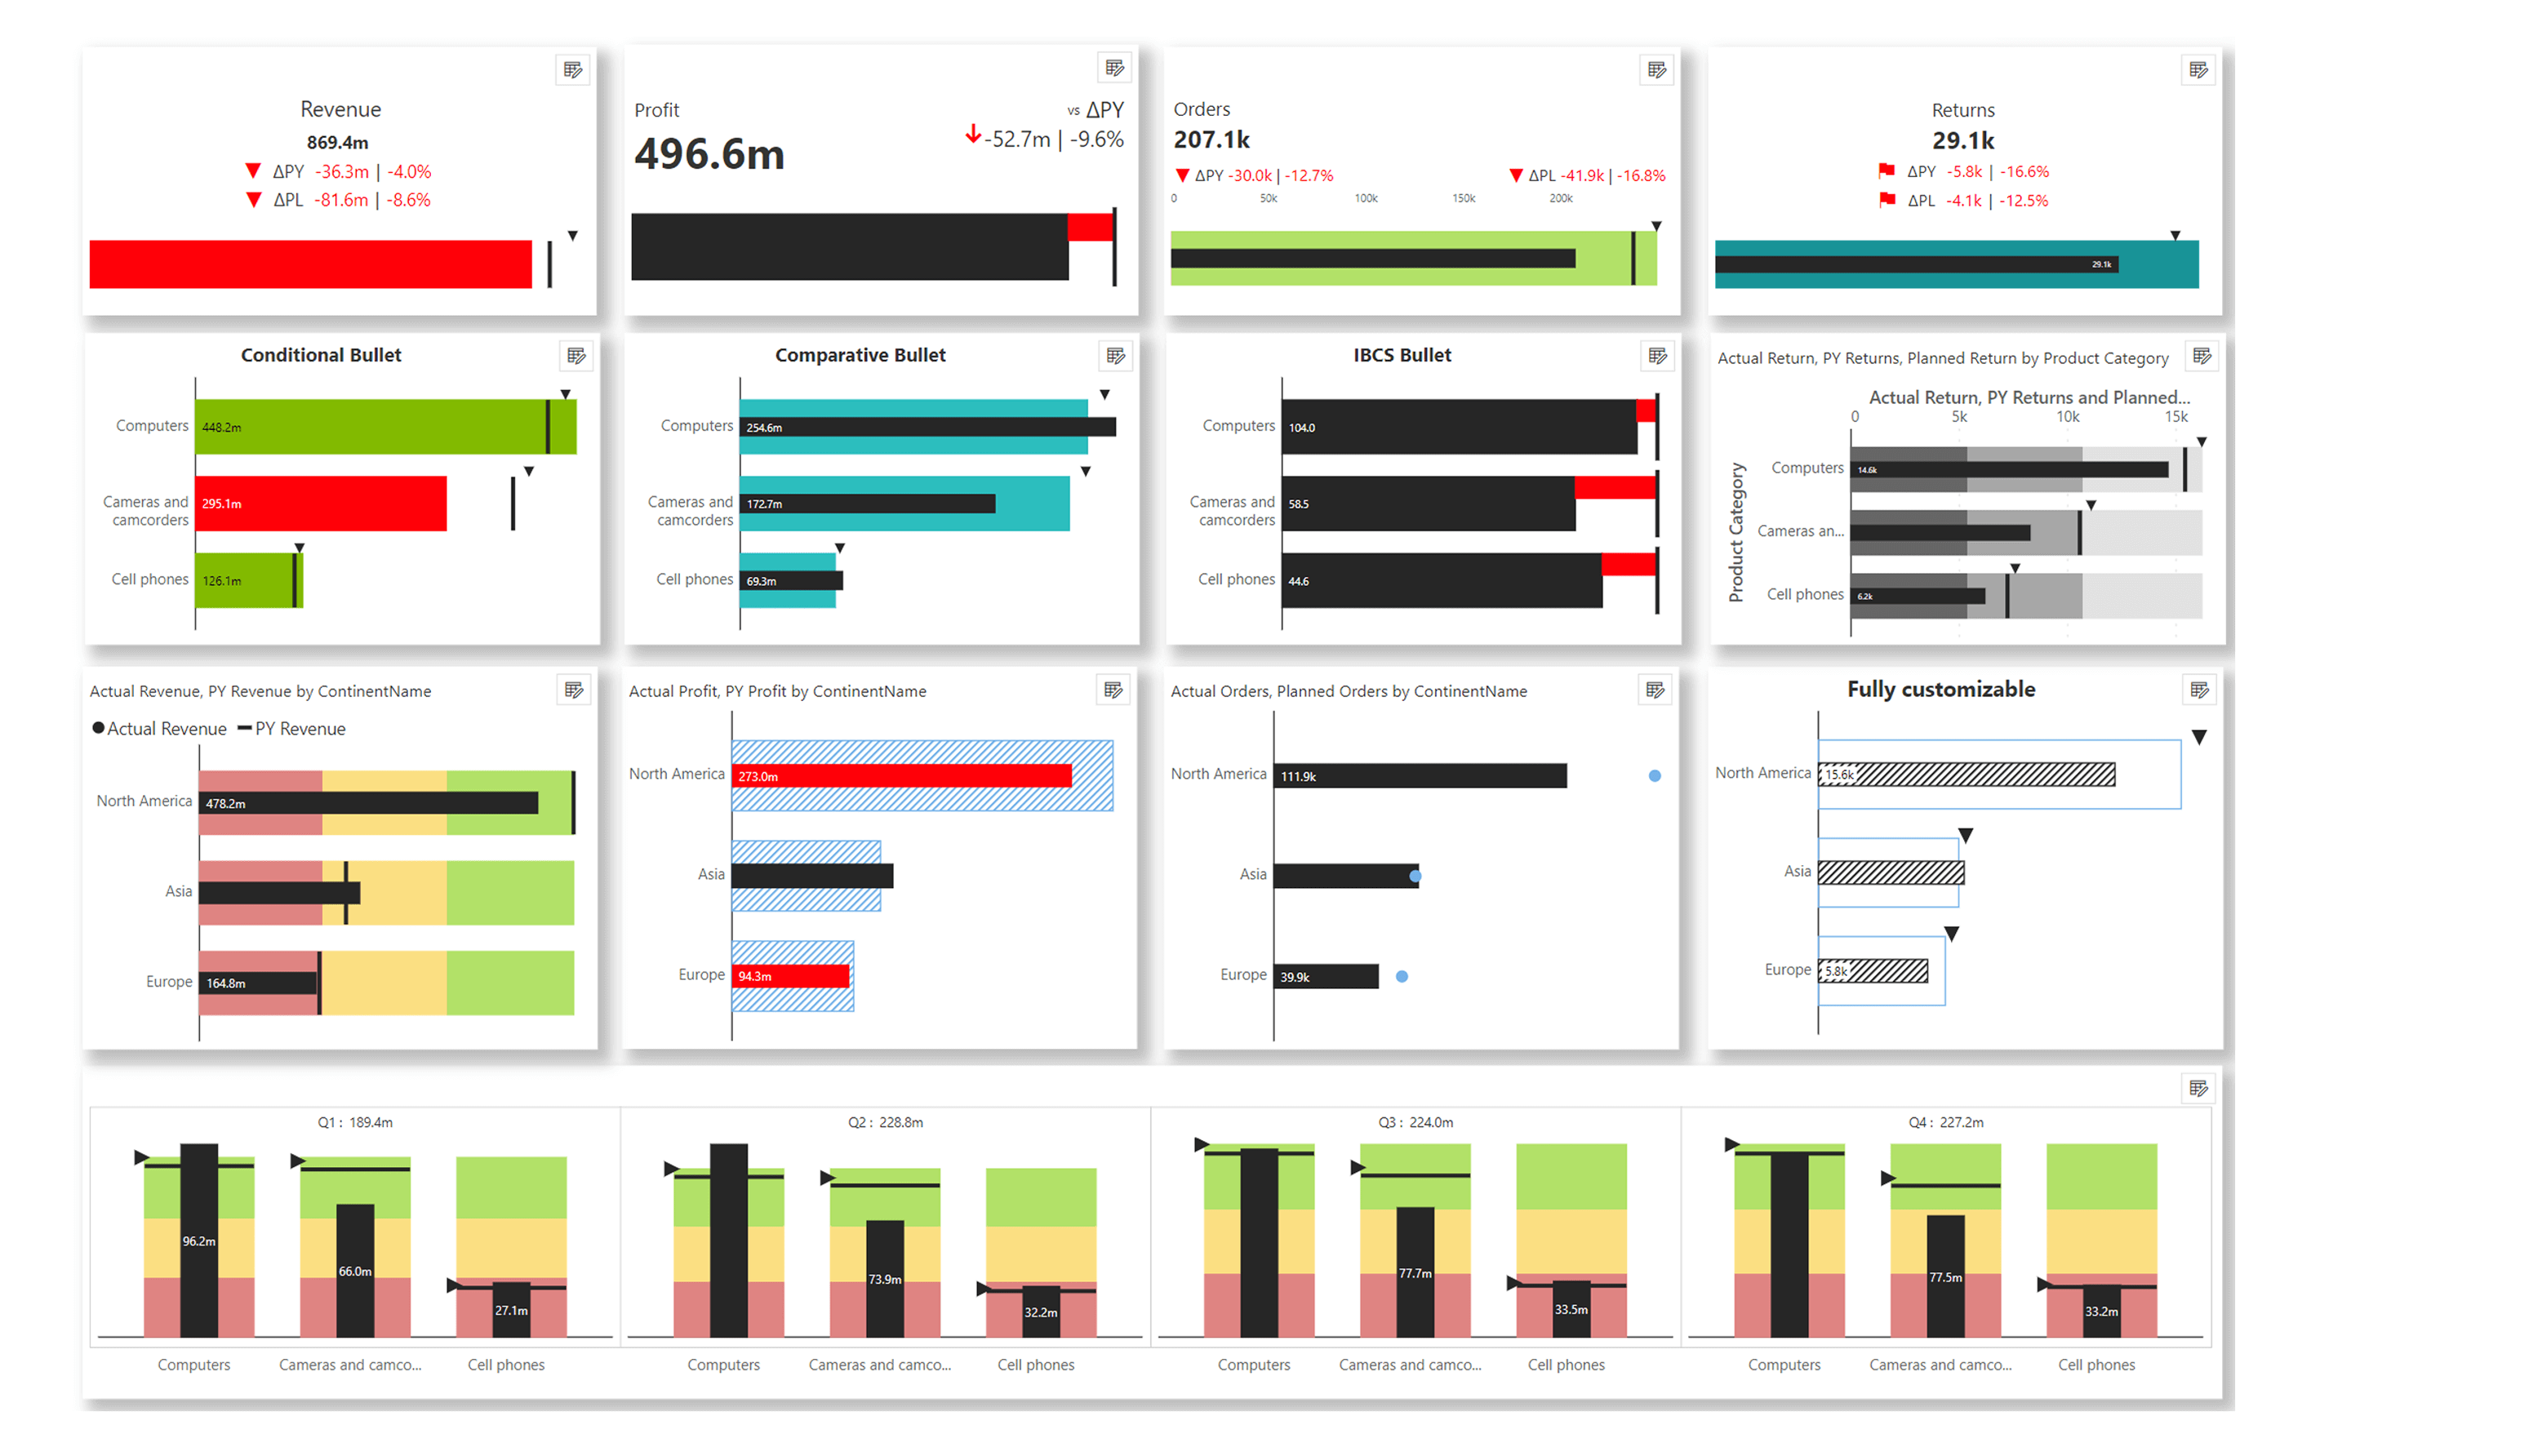
Watch the webinar replay on bullet charts in Power BI here.
Inforiver Analytics+ offers 12+ variations of bullet and integrated variance charts, clustered bars, overlapped, grouped, stacked & 100% stacked bars and columns, and visual pivot tables for three-axis data, among other features for Power BI. Check out the demo here!
It is a powerful tool for data visualization that can help you create insightful and engaging dashboards.
Inforiver helps enterprises consolidate planning, reporting & analytics on a single platform (Power BI). The no-code, self-service award-winning platform has been recognized as the industry’s best and is adopted by many Fortune 100 firms.
Inforiver is a product of Lumel, the #1 Power BI AppSource Partner. The firm serves over 3,000 customers worldwide through its portfolio of products offered under the brands Inforiver, EDITable, ValQ, and xViz.