
Upcoming webinar on 'Inforiver Charts : The fastest way to deliver stories in Power BI', Aug 29th , Monday, 10.30 AM CST. Register Now
Upcoming webinar on 'Inforiver Charts : The fastest way to deliver stories in Power BI', Aug 29th , Monday, 10.30 AM CST. Register Now
Data visualization is an important aspect of financial reporting because it can help to make complex financial data more understandable and actionable. Here are a few ways that visualizing financial data can benefit your organization:
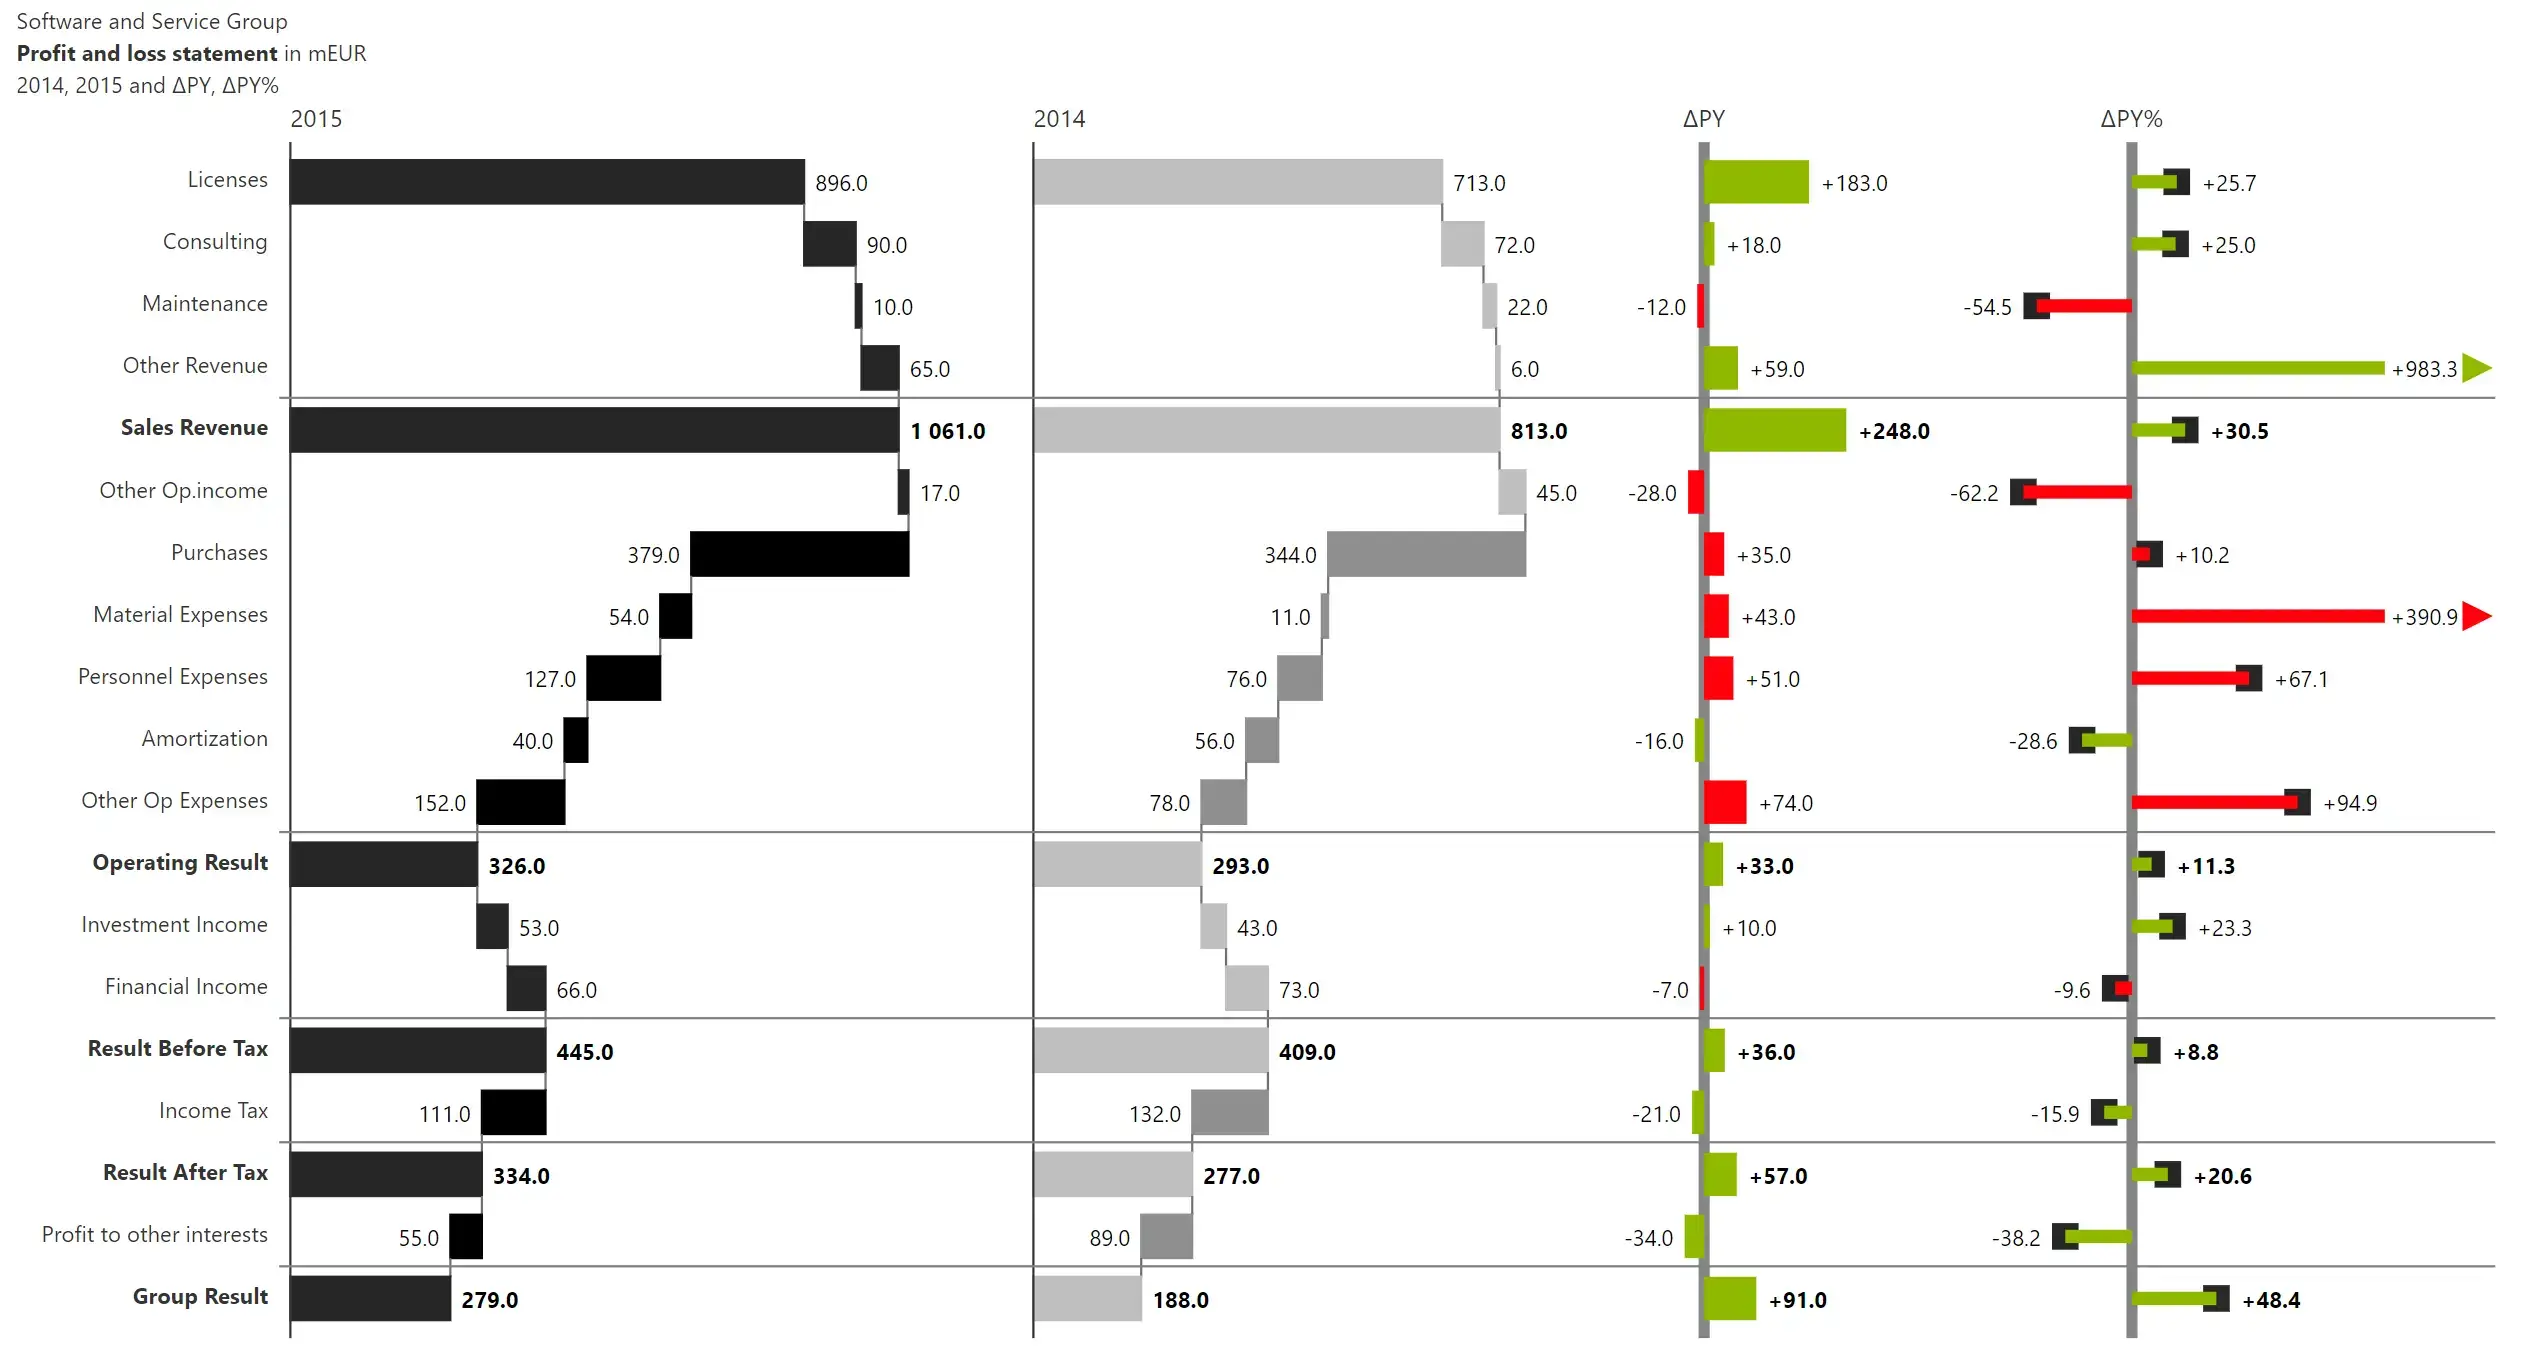
1. Drive consumption & reach of financial insights: Data visualization tools can help to communicate financial information in a clear, concise, and effective manner. By packaging insights in a consumption-ready format, one can reach out to a wider range of audience, including those who may not have a background in finance. This is one reason why annual reports increasingly have financial statements and paragraphs augmented by charts and graphs – as it makes it easier for readers to consume insights. Data visualizations also help executives communicate financial goals & objectives across the organization.
2. Enhance presentation and user engagement: Effective data visualization with right chart types, consistent formatting, and clear labels/notes enhances the overall presentation of financial reports. This makes them stand out better than raw tabular reports. The appeal and user experience can drive users to keep coming back to the reports on a periodic basis.
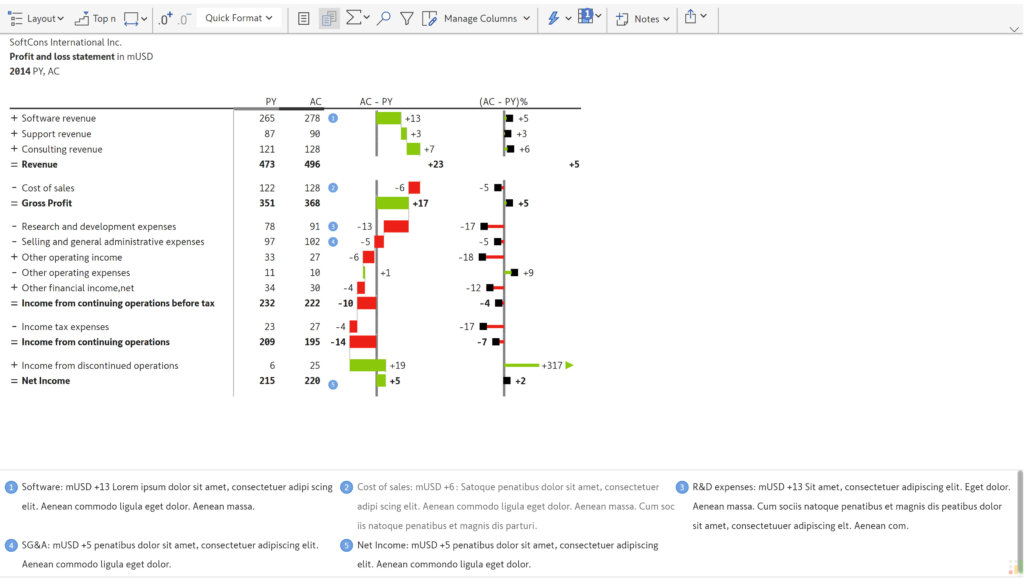
3. Tell better stories through data: While engaging with senior leadership or stakeholders outside finance, it becomes more important to retain their attention, especially when we are expecting their approval or collaboration. Visualizing financial data can be enriched by leveraging effective storytelling techniques that can guide executives and non-finance users navigate through your data and understand the underlying assumptions, risks, and constraints. You can also leverage data-level annotations to provide explanations and context or clarify on formula and calculations involved.
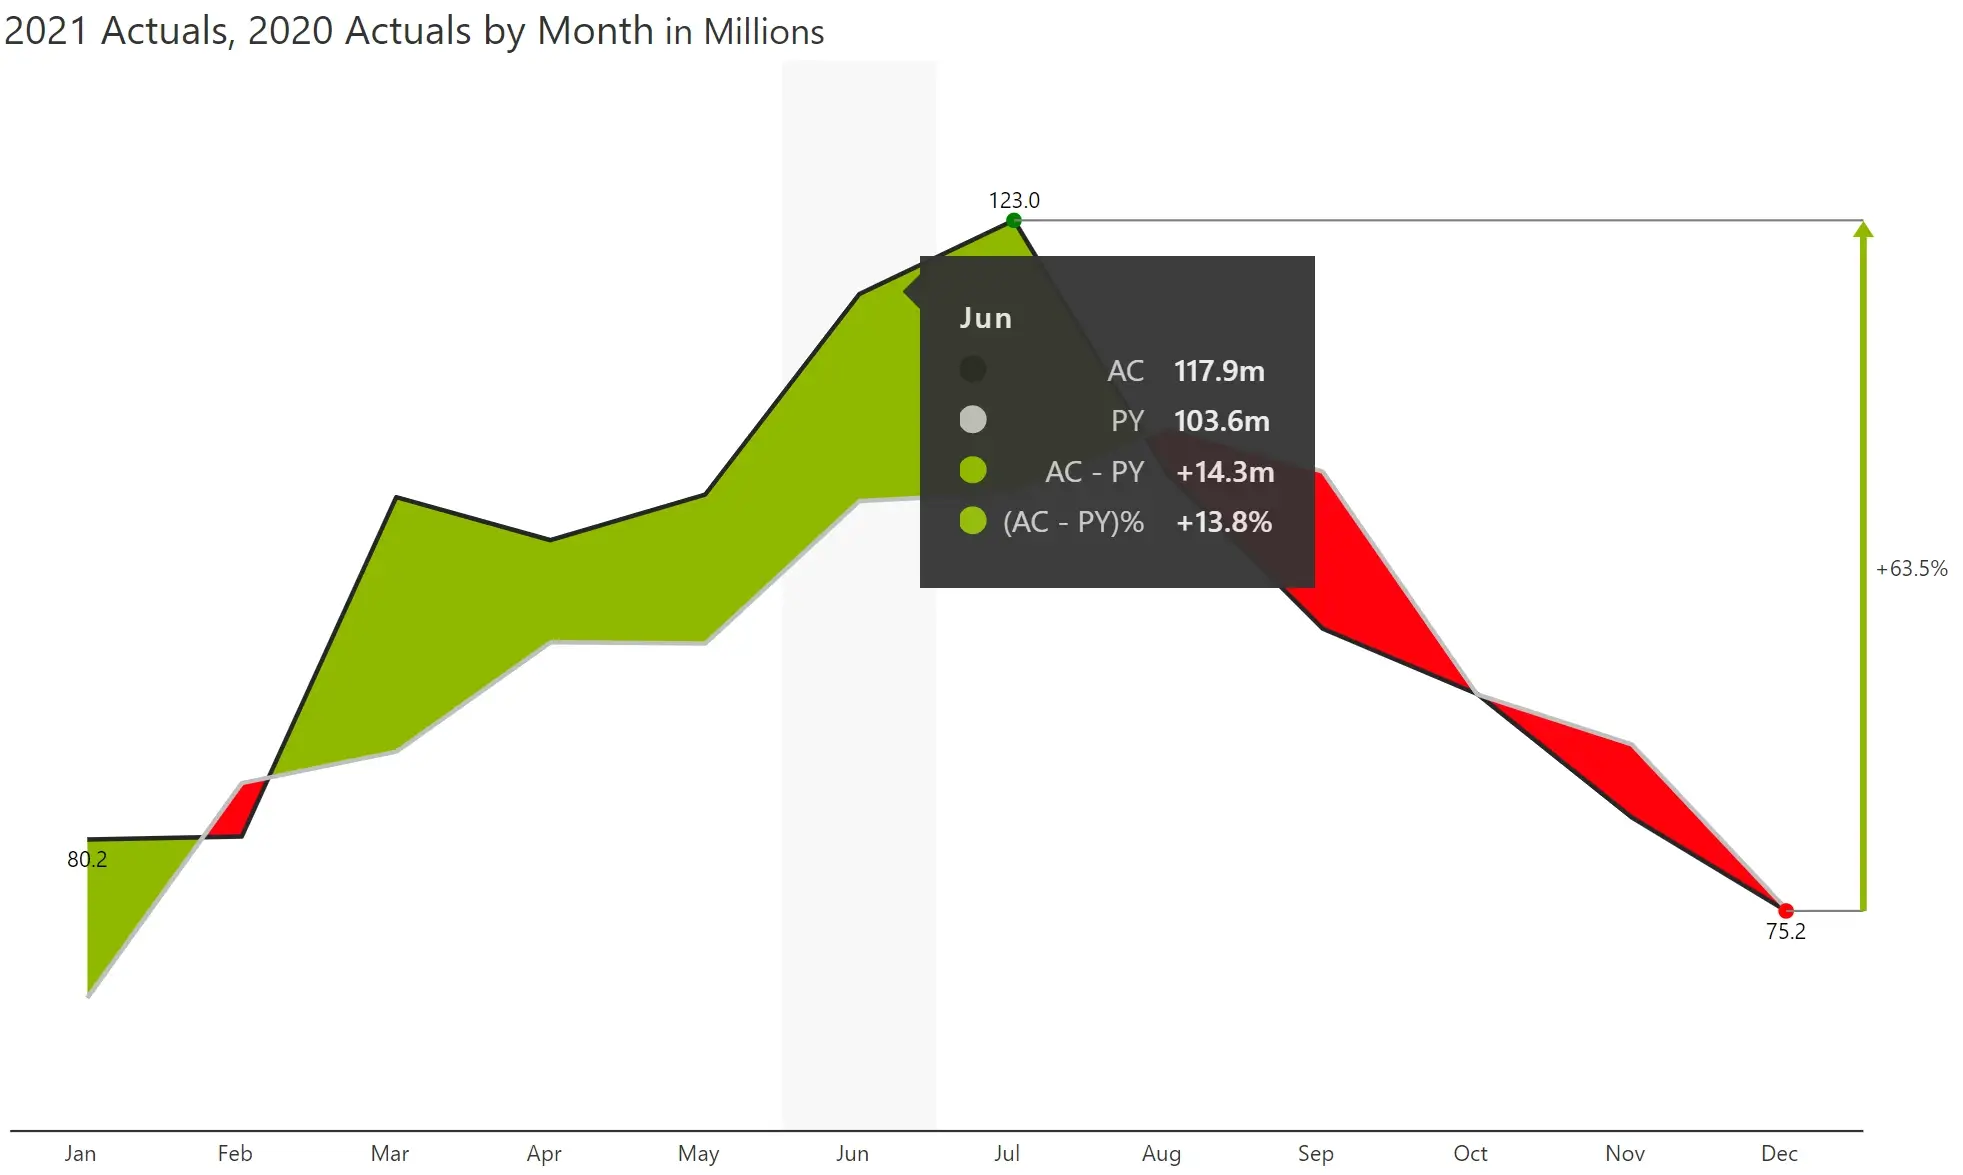
4. Understand patterns and trends easily: Visualizing financial data helps reveal patterns and trends in that might not be immediately apparent from raw tables. This can make it easier to identify opportunities and potential areas of concern. In this example below, it is immediately apparent that the performance in the second half of the year is not up to expectations. It is hard to make it out using two columns of data. Unless you would like to forego aggregated insights and show thousands of records, there is no limit to the benefits offered by visualizing data.
5. Drive productivity & decision-making efficiency: When it is easier to identify key insights and takeaways from reports, decision-makers can drive informed decisions quickly. For example, data visualizations and collaboration techniques can reduce the number of iterations required for planning & forecasting exercises, and shorten the time taken for each iteration. Similarly, when market conditions and external business drivers undergo sudden changes, visualizations help quickly communicate what has changed and how it will impact the outcomes of various scenarios and projections.
Overall, data visualizations are a valuable tool for financial reporting because they can make complex data more accessible, understandable, and actionable, which can support better decision making and drive business success.

Inforiver helps enterprises consolidate planning, reporting & analytics on a single platform (Power BI). The no-code, self-service award-winning platform has been recognized as the industry’s best and is adopted by many Fortune 100 firms.
Inforiver is a product of Lumel, the #1 Power BI AppSource Partner. The firm serves over 3,000 customers worldwide through its portfolio of products offered under the brands Inforiver, EDITable, ValQ, and xViz.