Upcoming webinar on 'Inforiver Charts : The fastest way to deliver stories in Power BI', Aug 29th , Monday, 10.30 AM CST. Register Now
Upcoming webinar on 'Inforiver Charts : The fastest way to deliver stories in Power BI', Aug 29th , Monday, 10.30 AM CST. Register Now
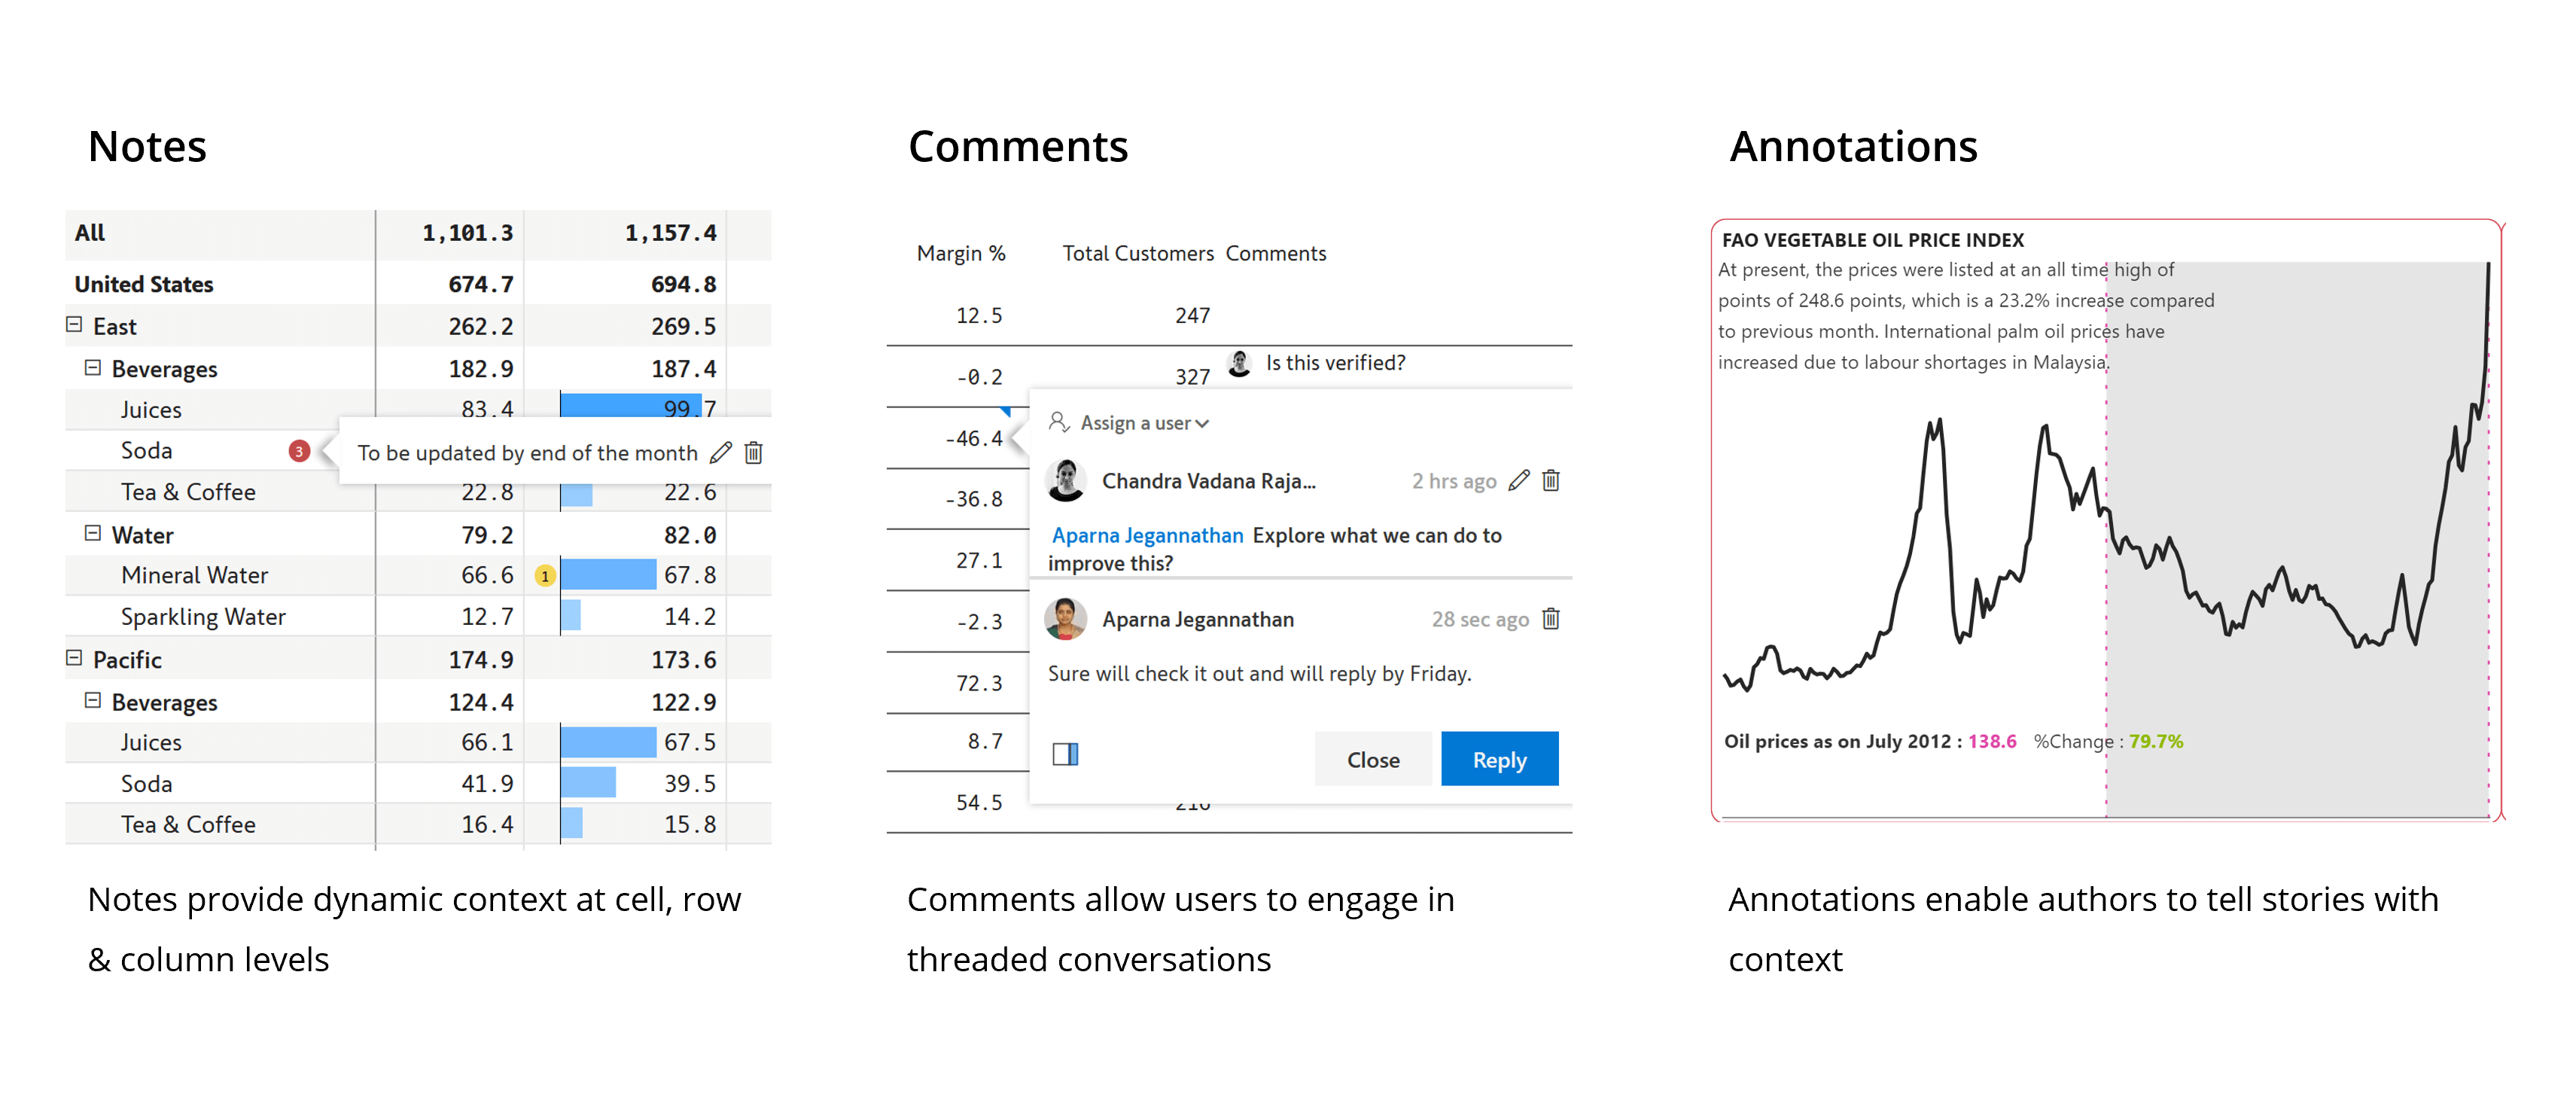

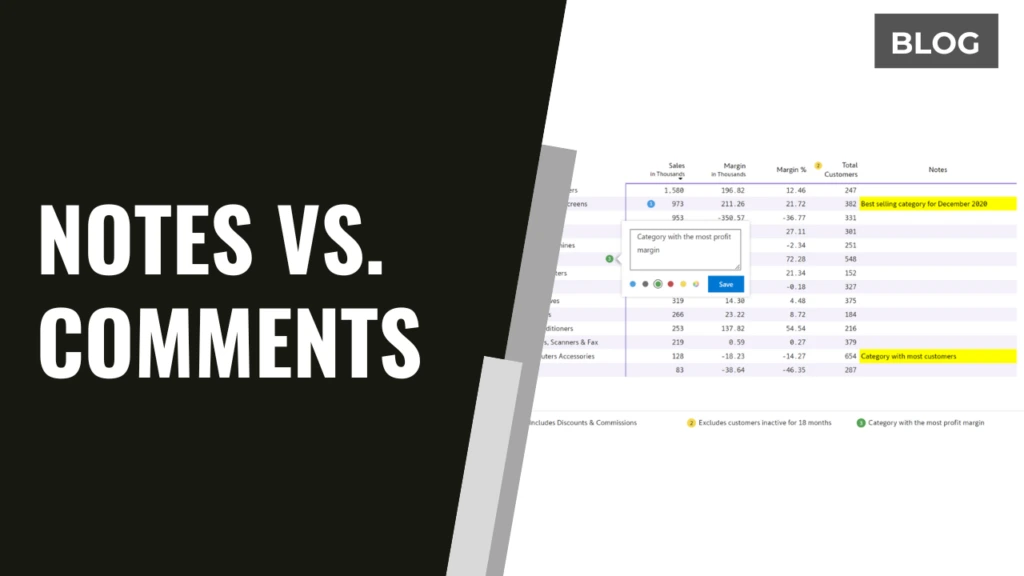
The terminologies notes, comments, and annotations are used interchangeably in the context of dashboards and visualizations. However, there are subtle differences between them.
Notes and annotations are generally used by the author to add context to the data. The difference is that annotations are typically used for charts (think of annotations in Tableau), whereas notes are used for tabular reports (think of Excel sticky notes). Apart from the nomenclature, they are pretty much the same.
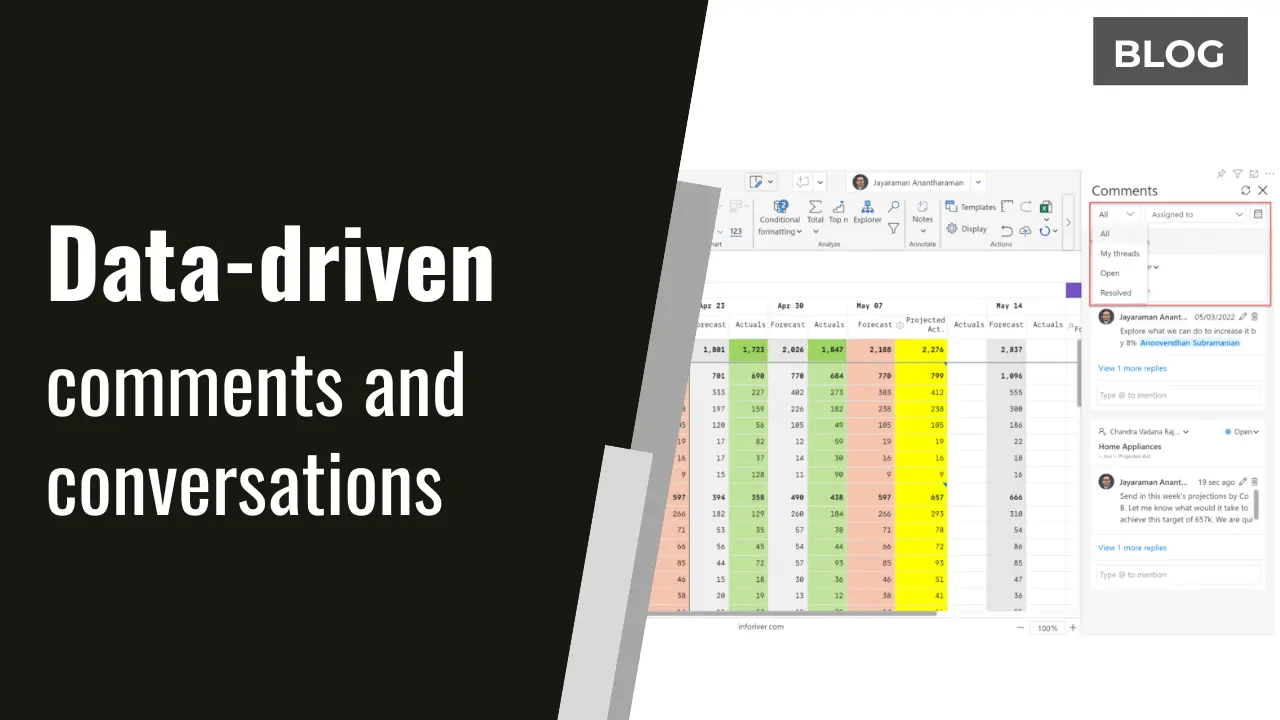
Comments are something different from notes and annotations. As seen in Office365, comments track the user posting it and the time the comment was posted. Users can also ‘Reply’ to comments, thereby initiating threaded conversations.
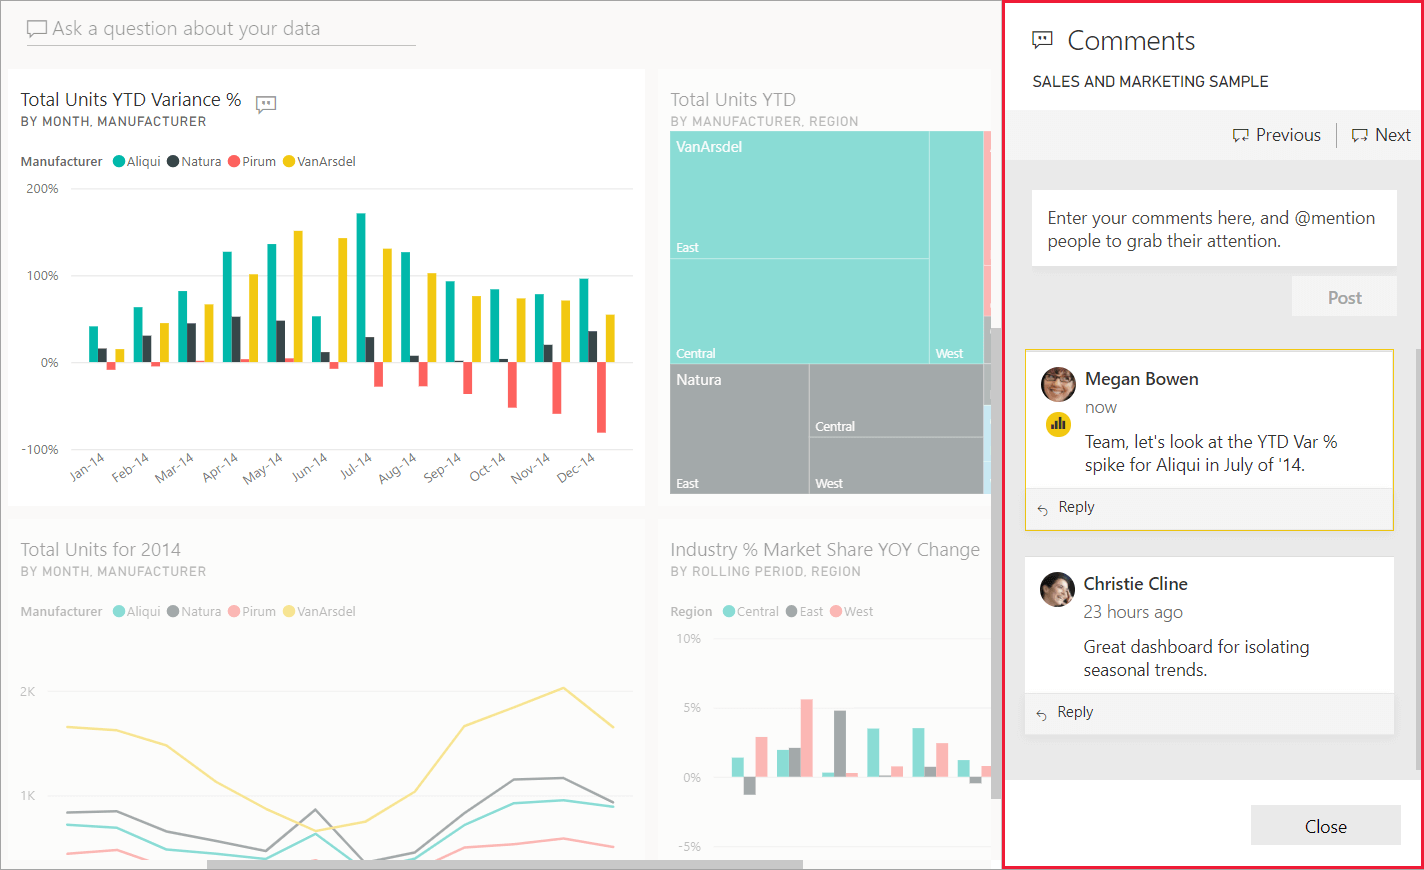
Power BI provides built-in commenting functionality, but this is restricted at the report and visual level. You cannot comment at a data level inside a chart or a table. Power BI commenting does support @mentions, through which users can engage in conversations.
Many third-party ‘commenting’ solutions available for Power BI are actually ‘notes’ solutions. In other words, they track neither the user entering the comment nor when it was entered.
Inforiver delivers an out-of-the-box comprehensive, no-code notes, annotations, and commentary solution.
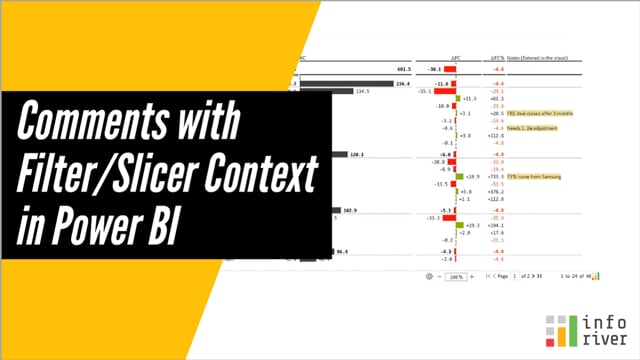
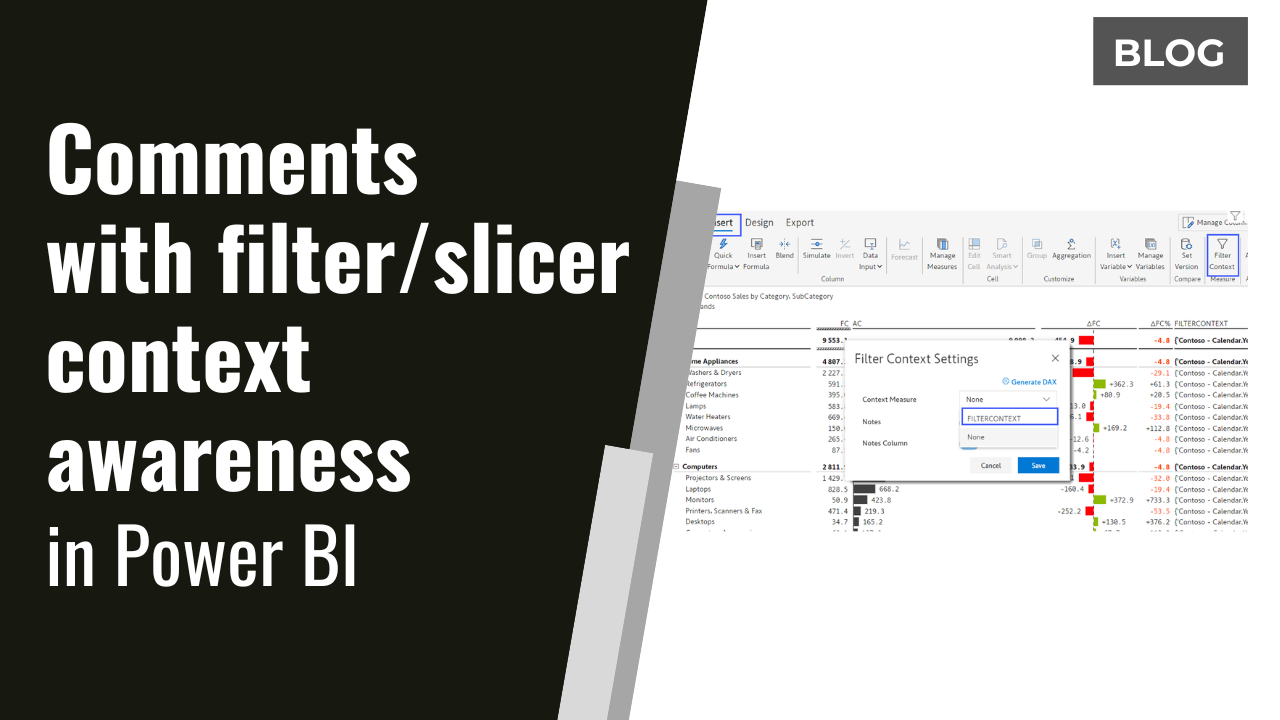
Inforiver also tracks the context set by external slicers as you enter comments. In other words, a cell in a table can reveal different comments based on the values set in the external slicers.

In this webinar, we will learn (through a LIVE DEMO) how you can implement various types of dynamic commentary solutions in Power BI.
The capabilities listed here are available in Inforiver Matrix & Enterprise.
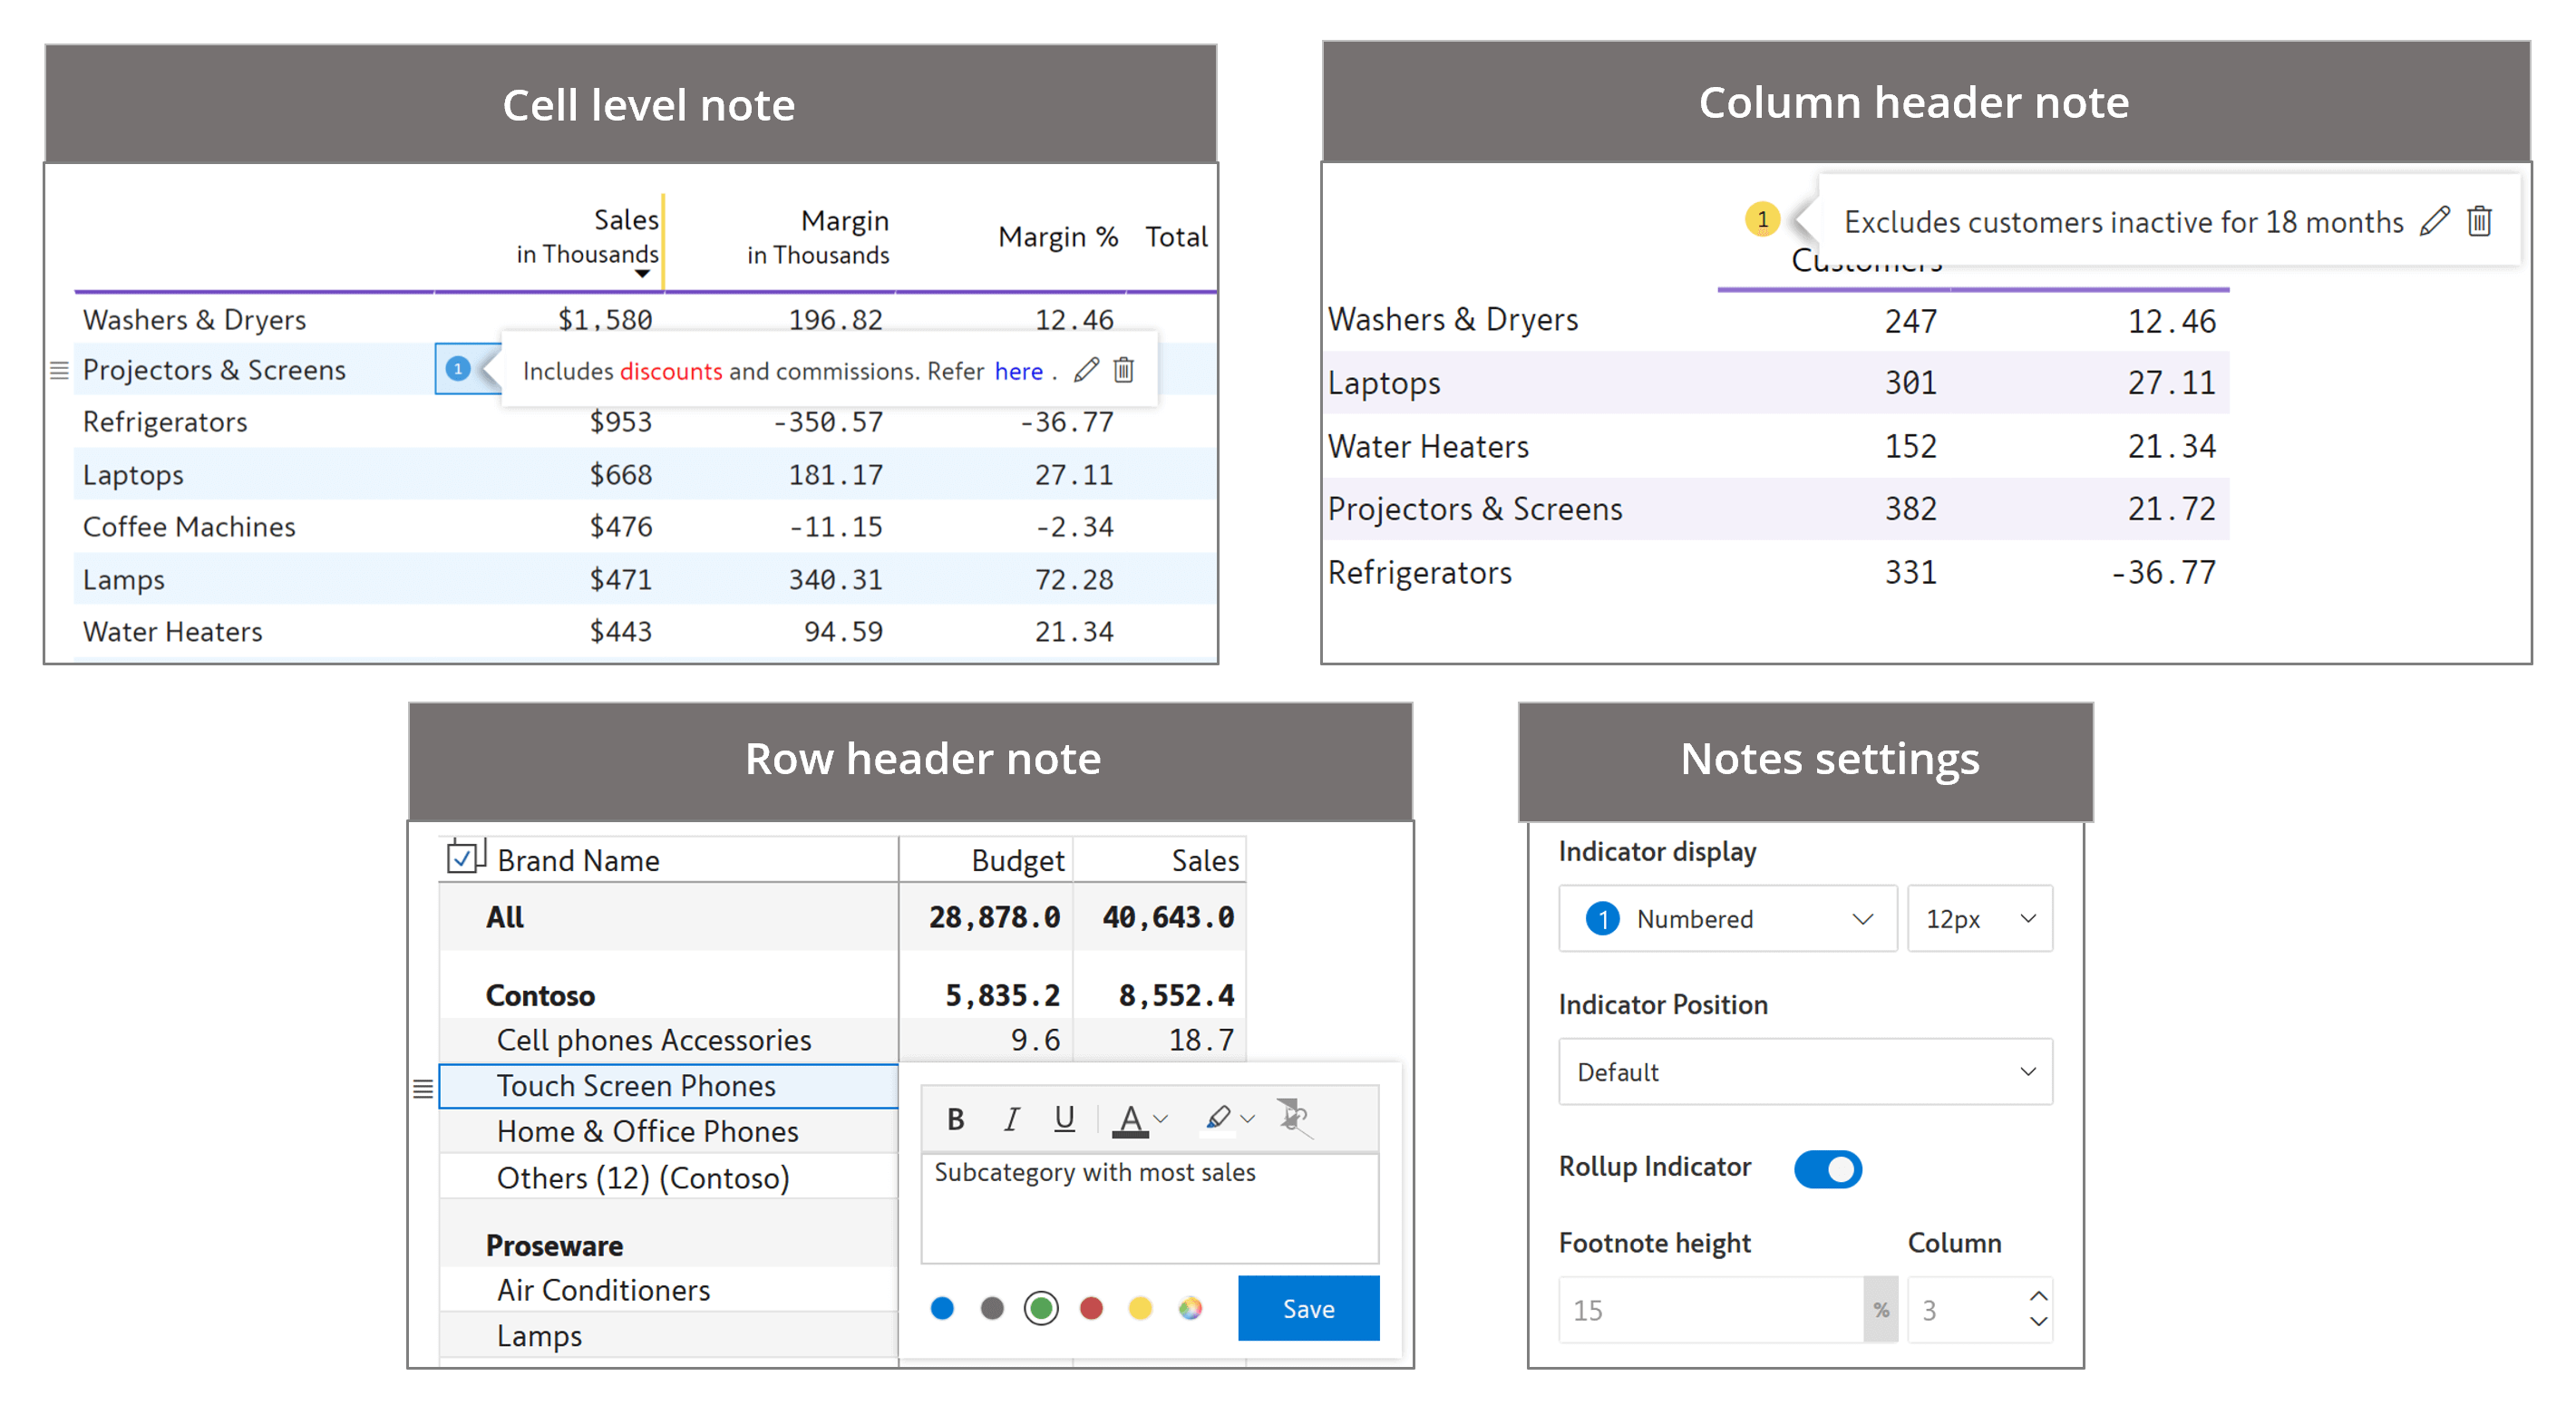
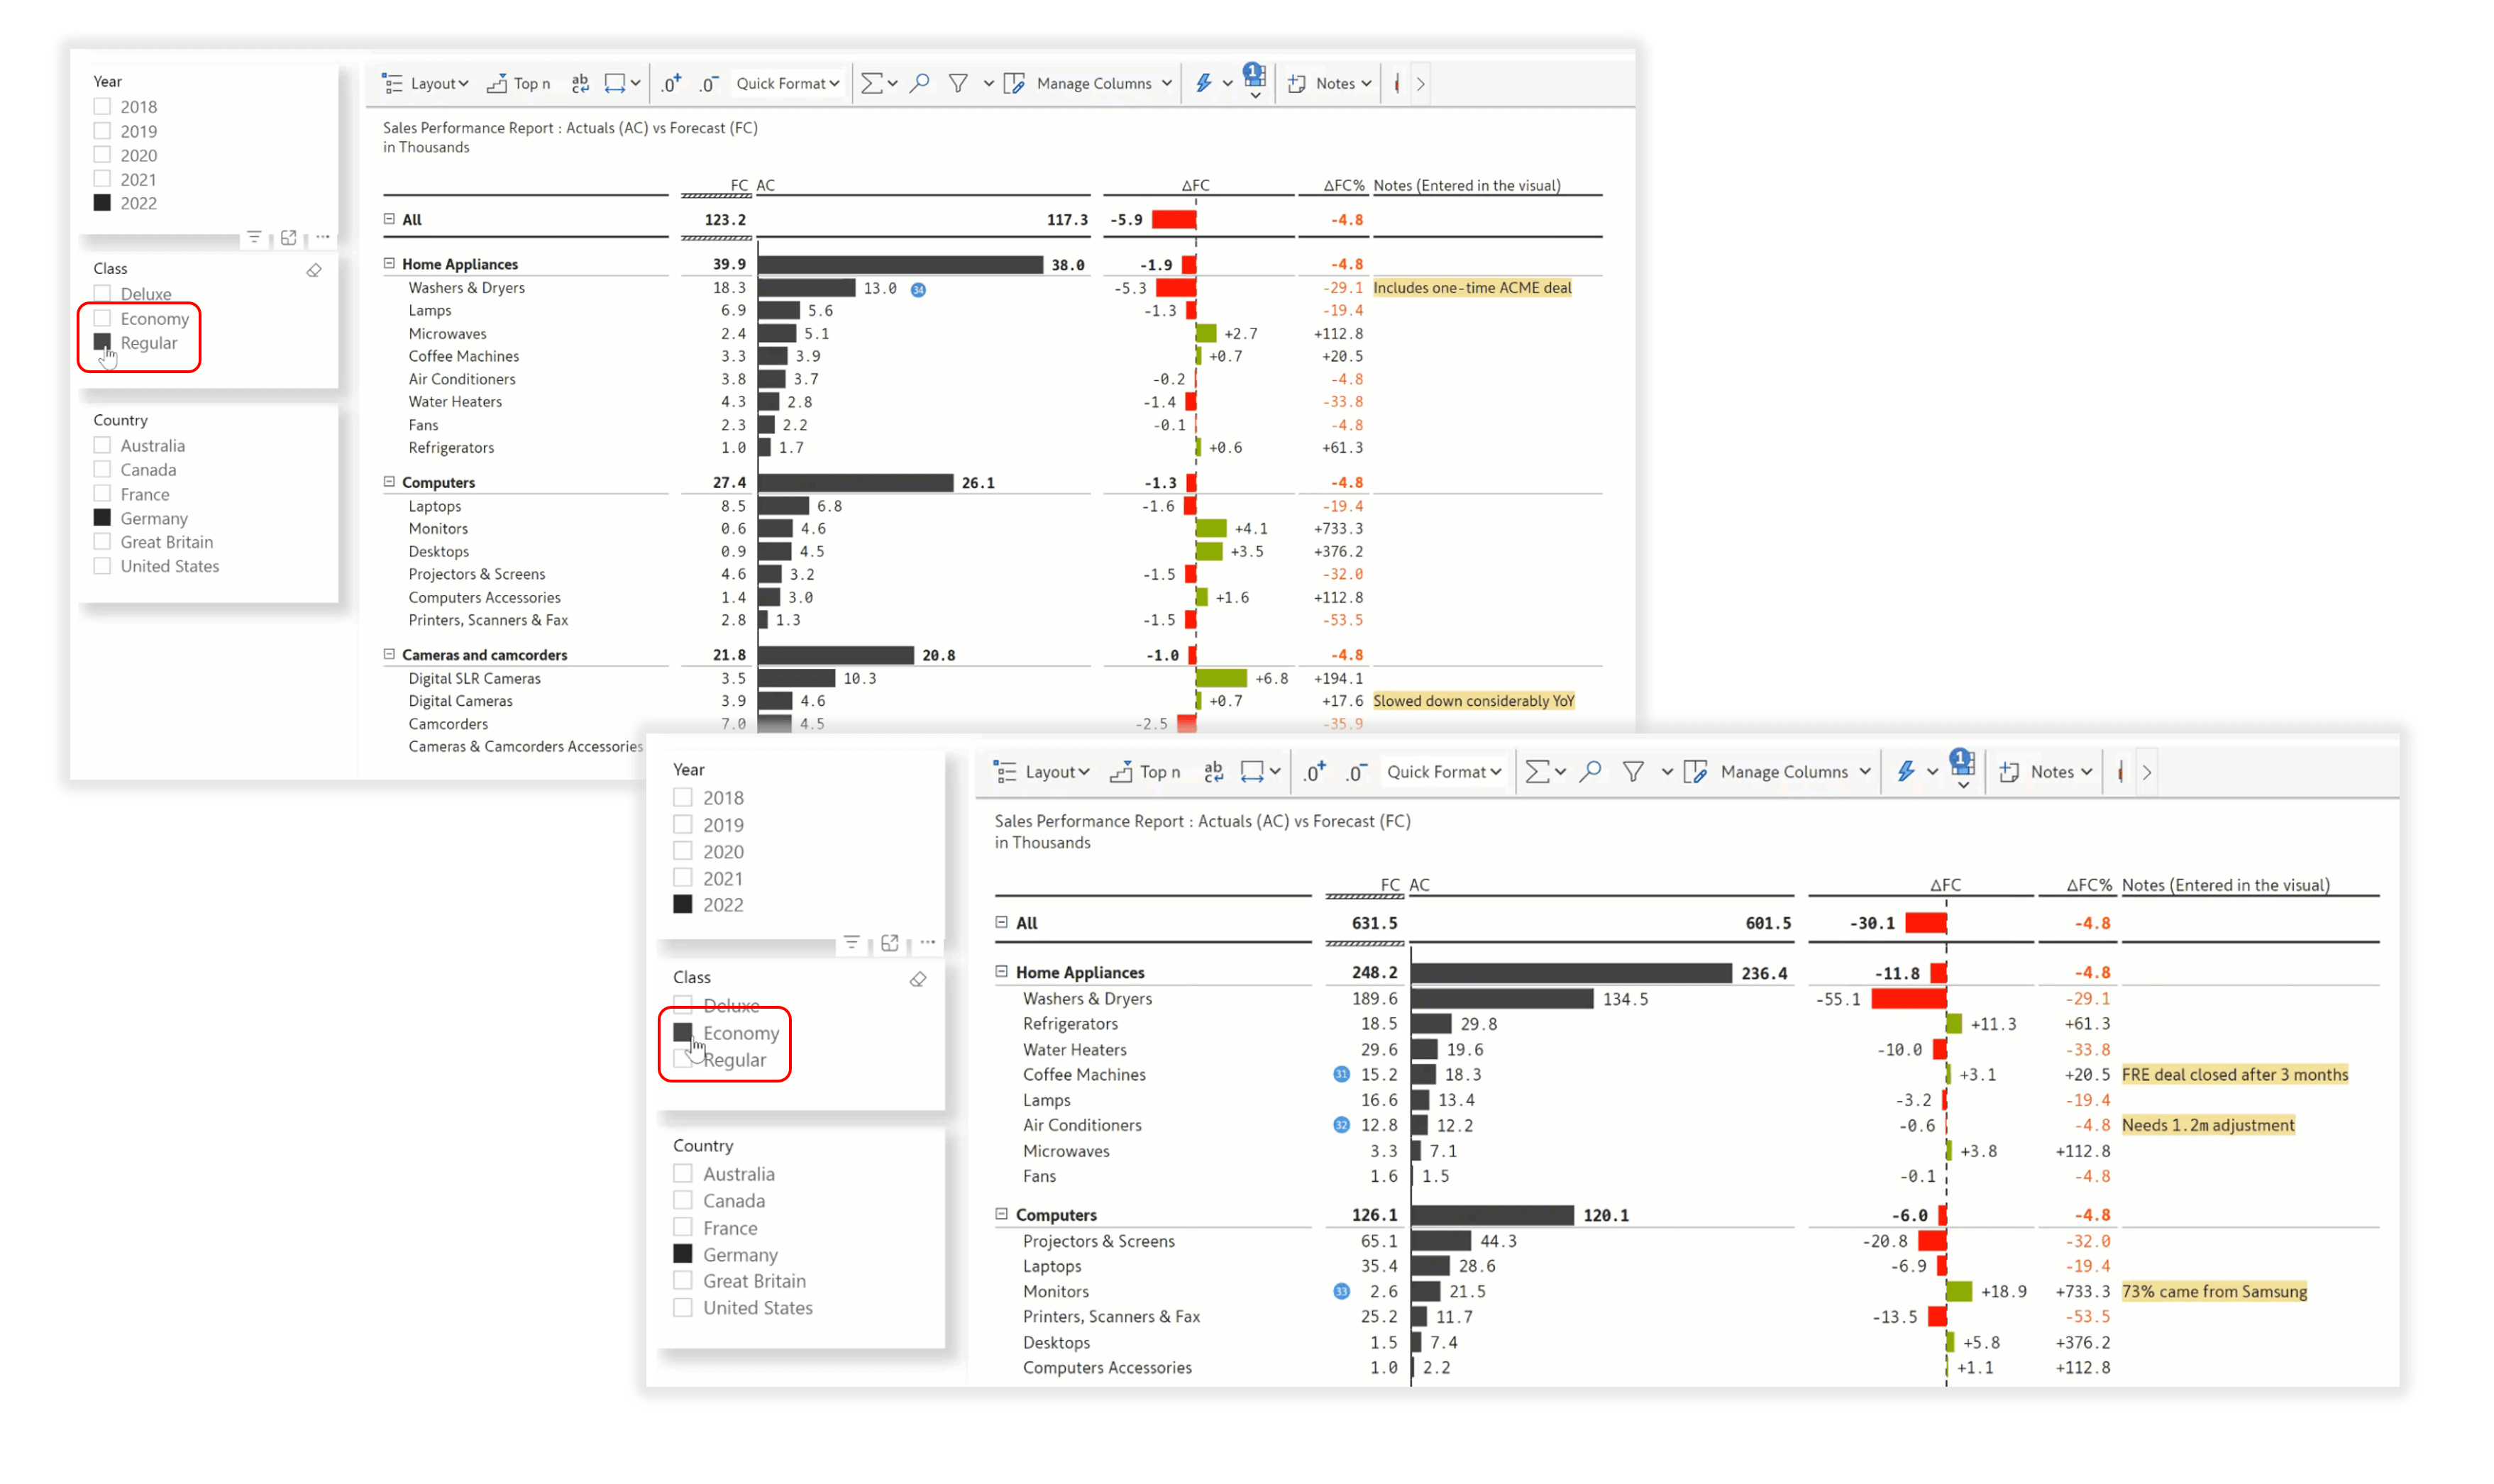
Provide context at the data level, i.e., at the cell, row, column, row-header, or column-header levels. You can also use the rich text styling and formatting options for a better user experience.
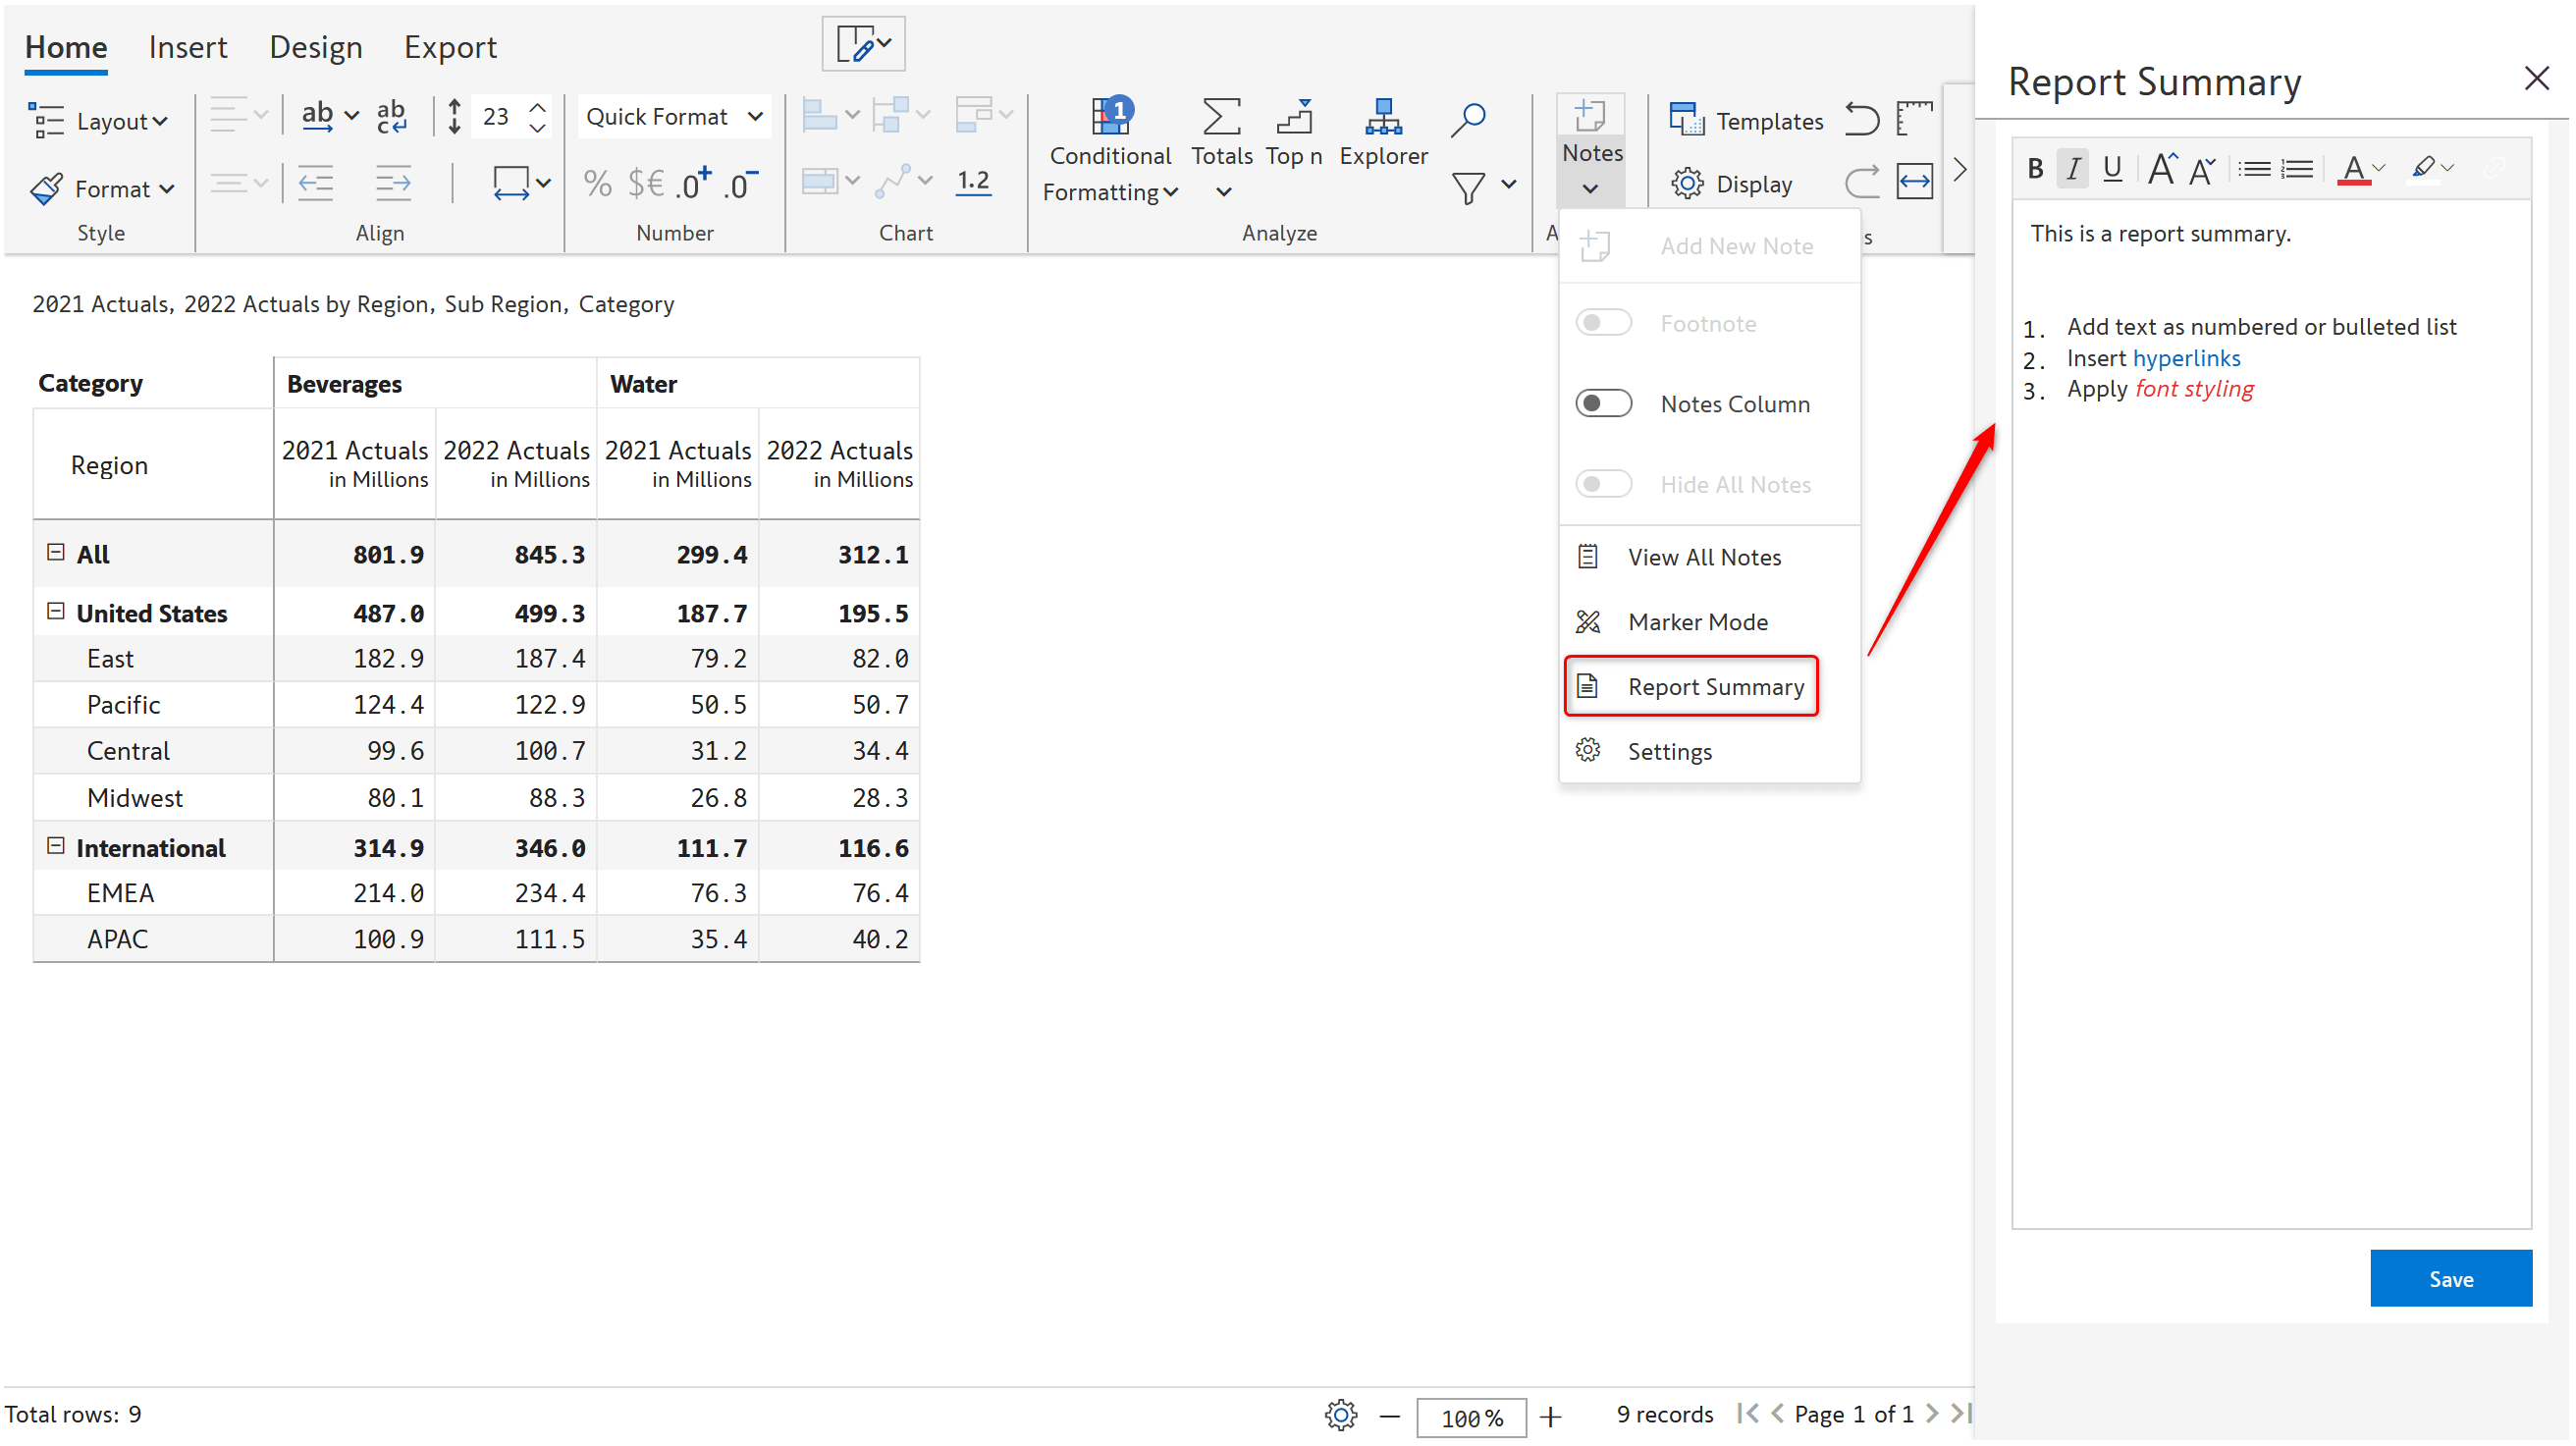
Add notes and explanations at the report level using the ‘Report Summary’ option. Extensive formatting options are available, such as ordered/unordered lists and hyperlinks.
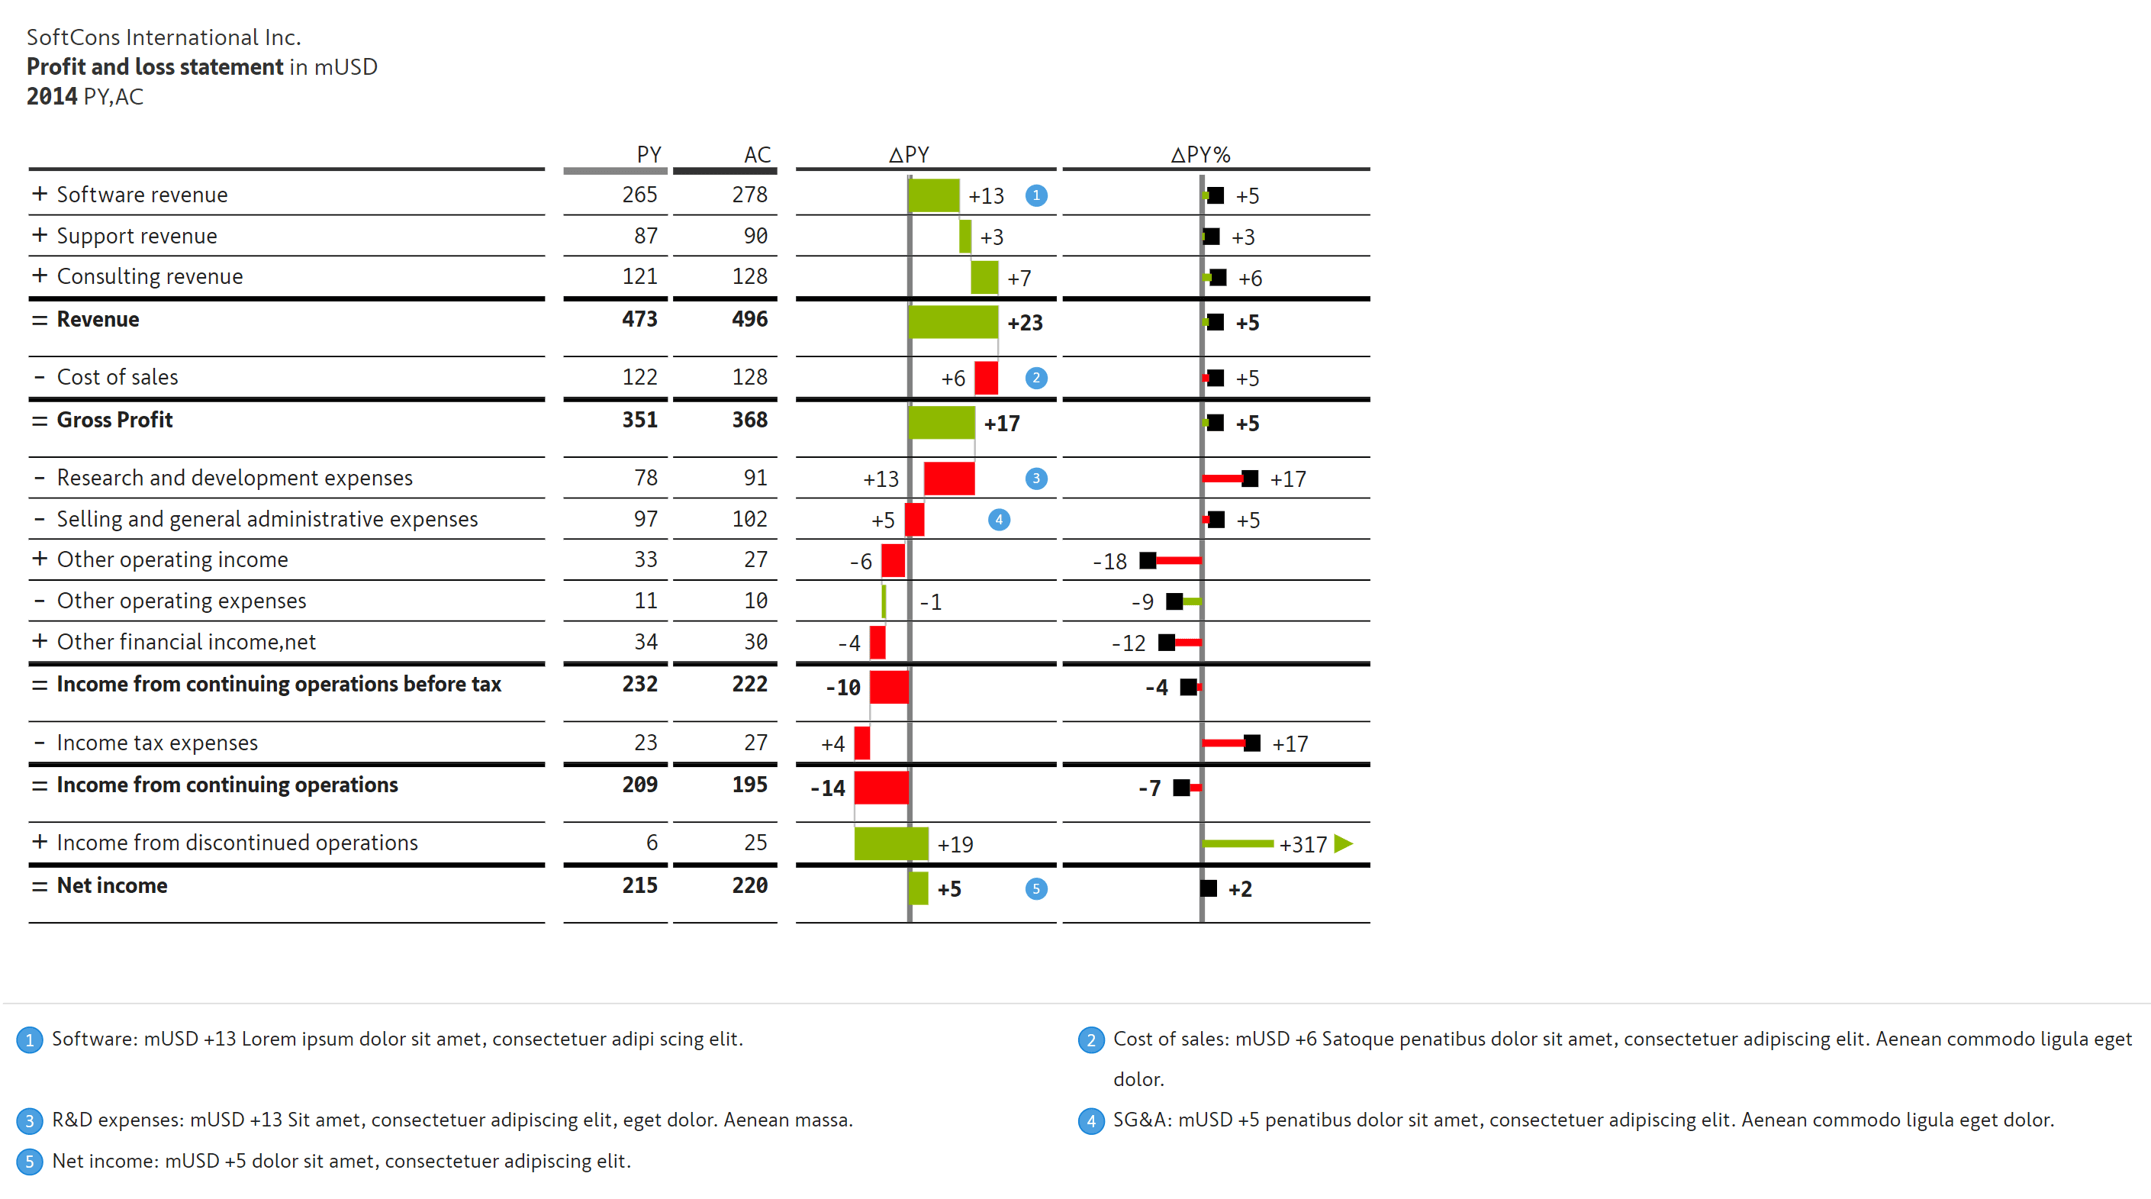
Provide supplementary information for management, financial, and variance reports.
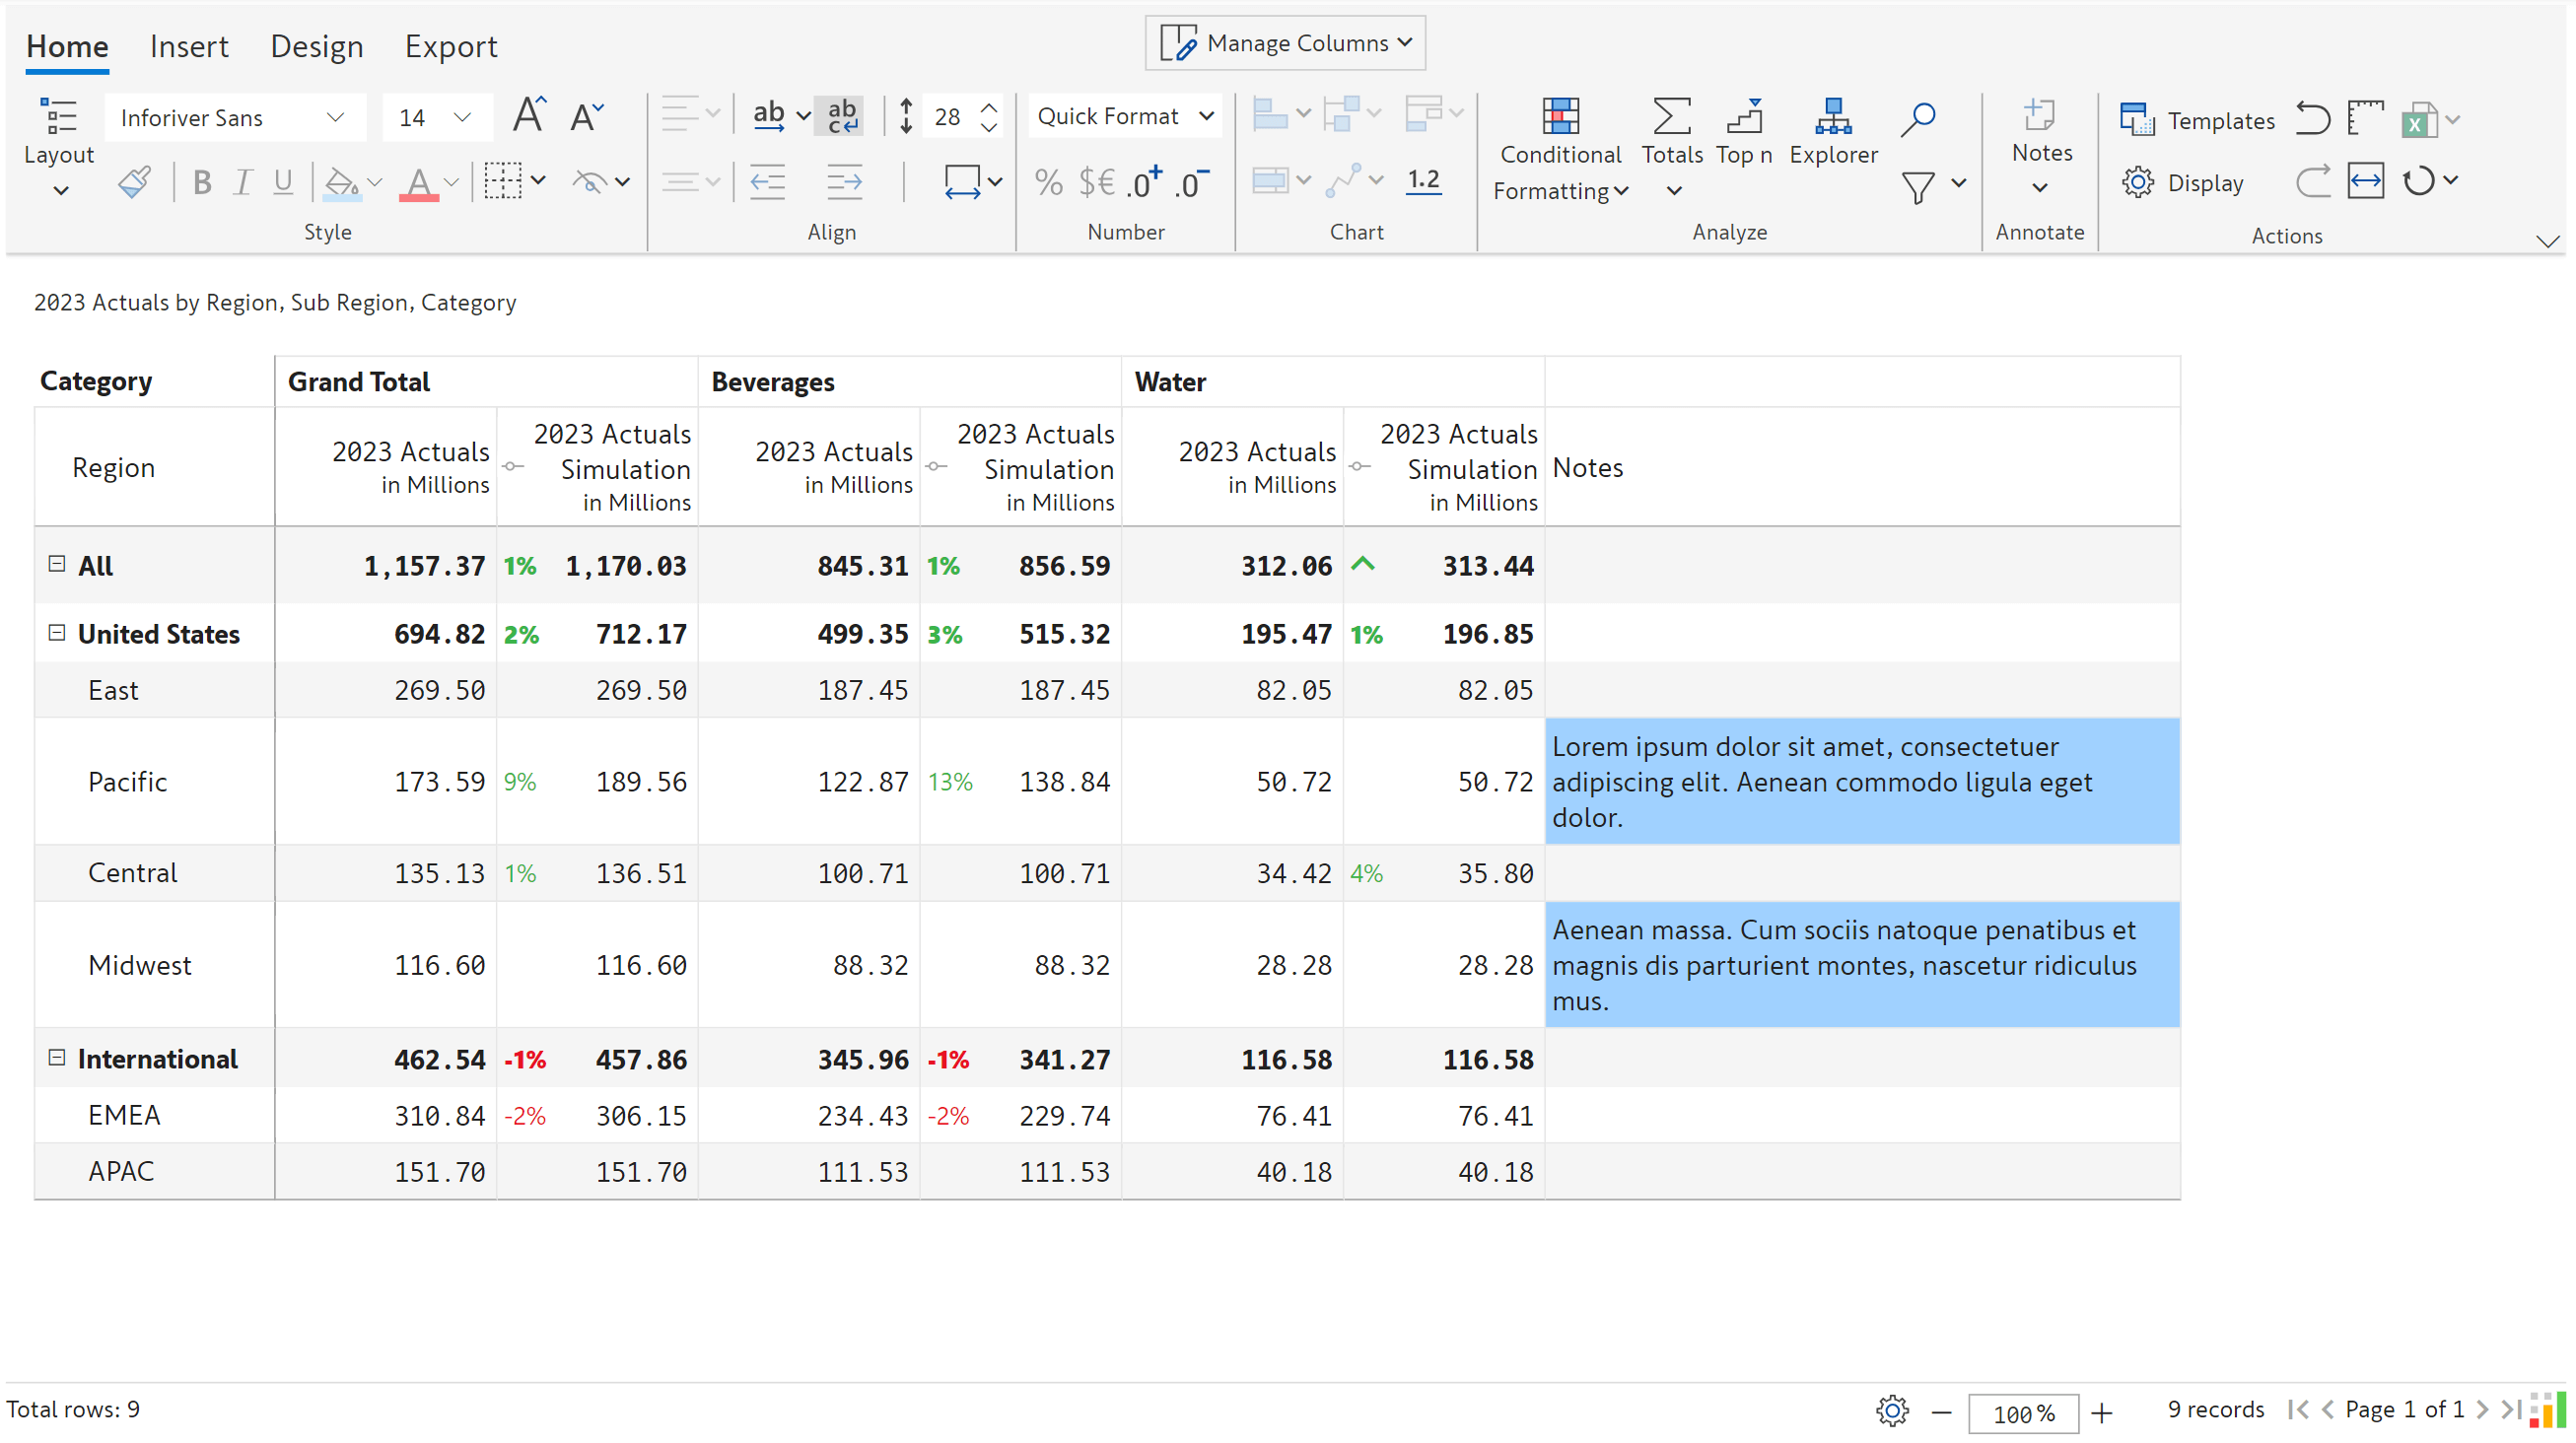
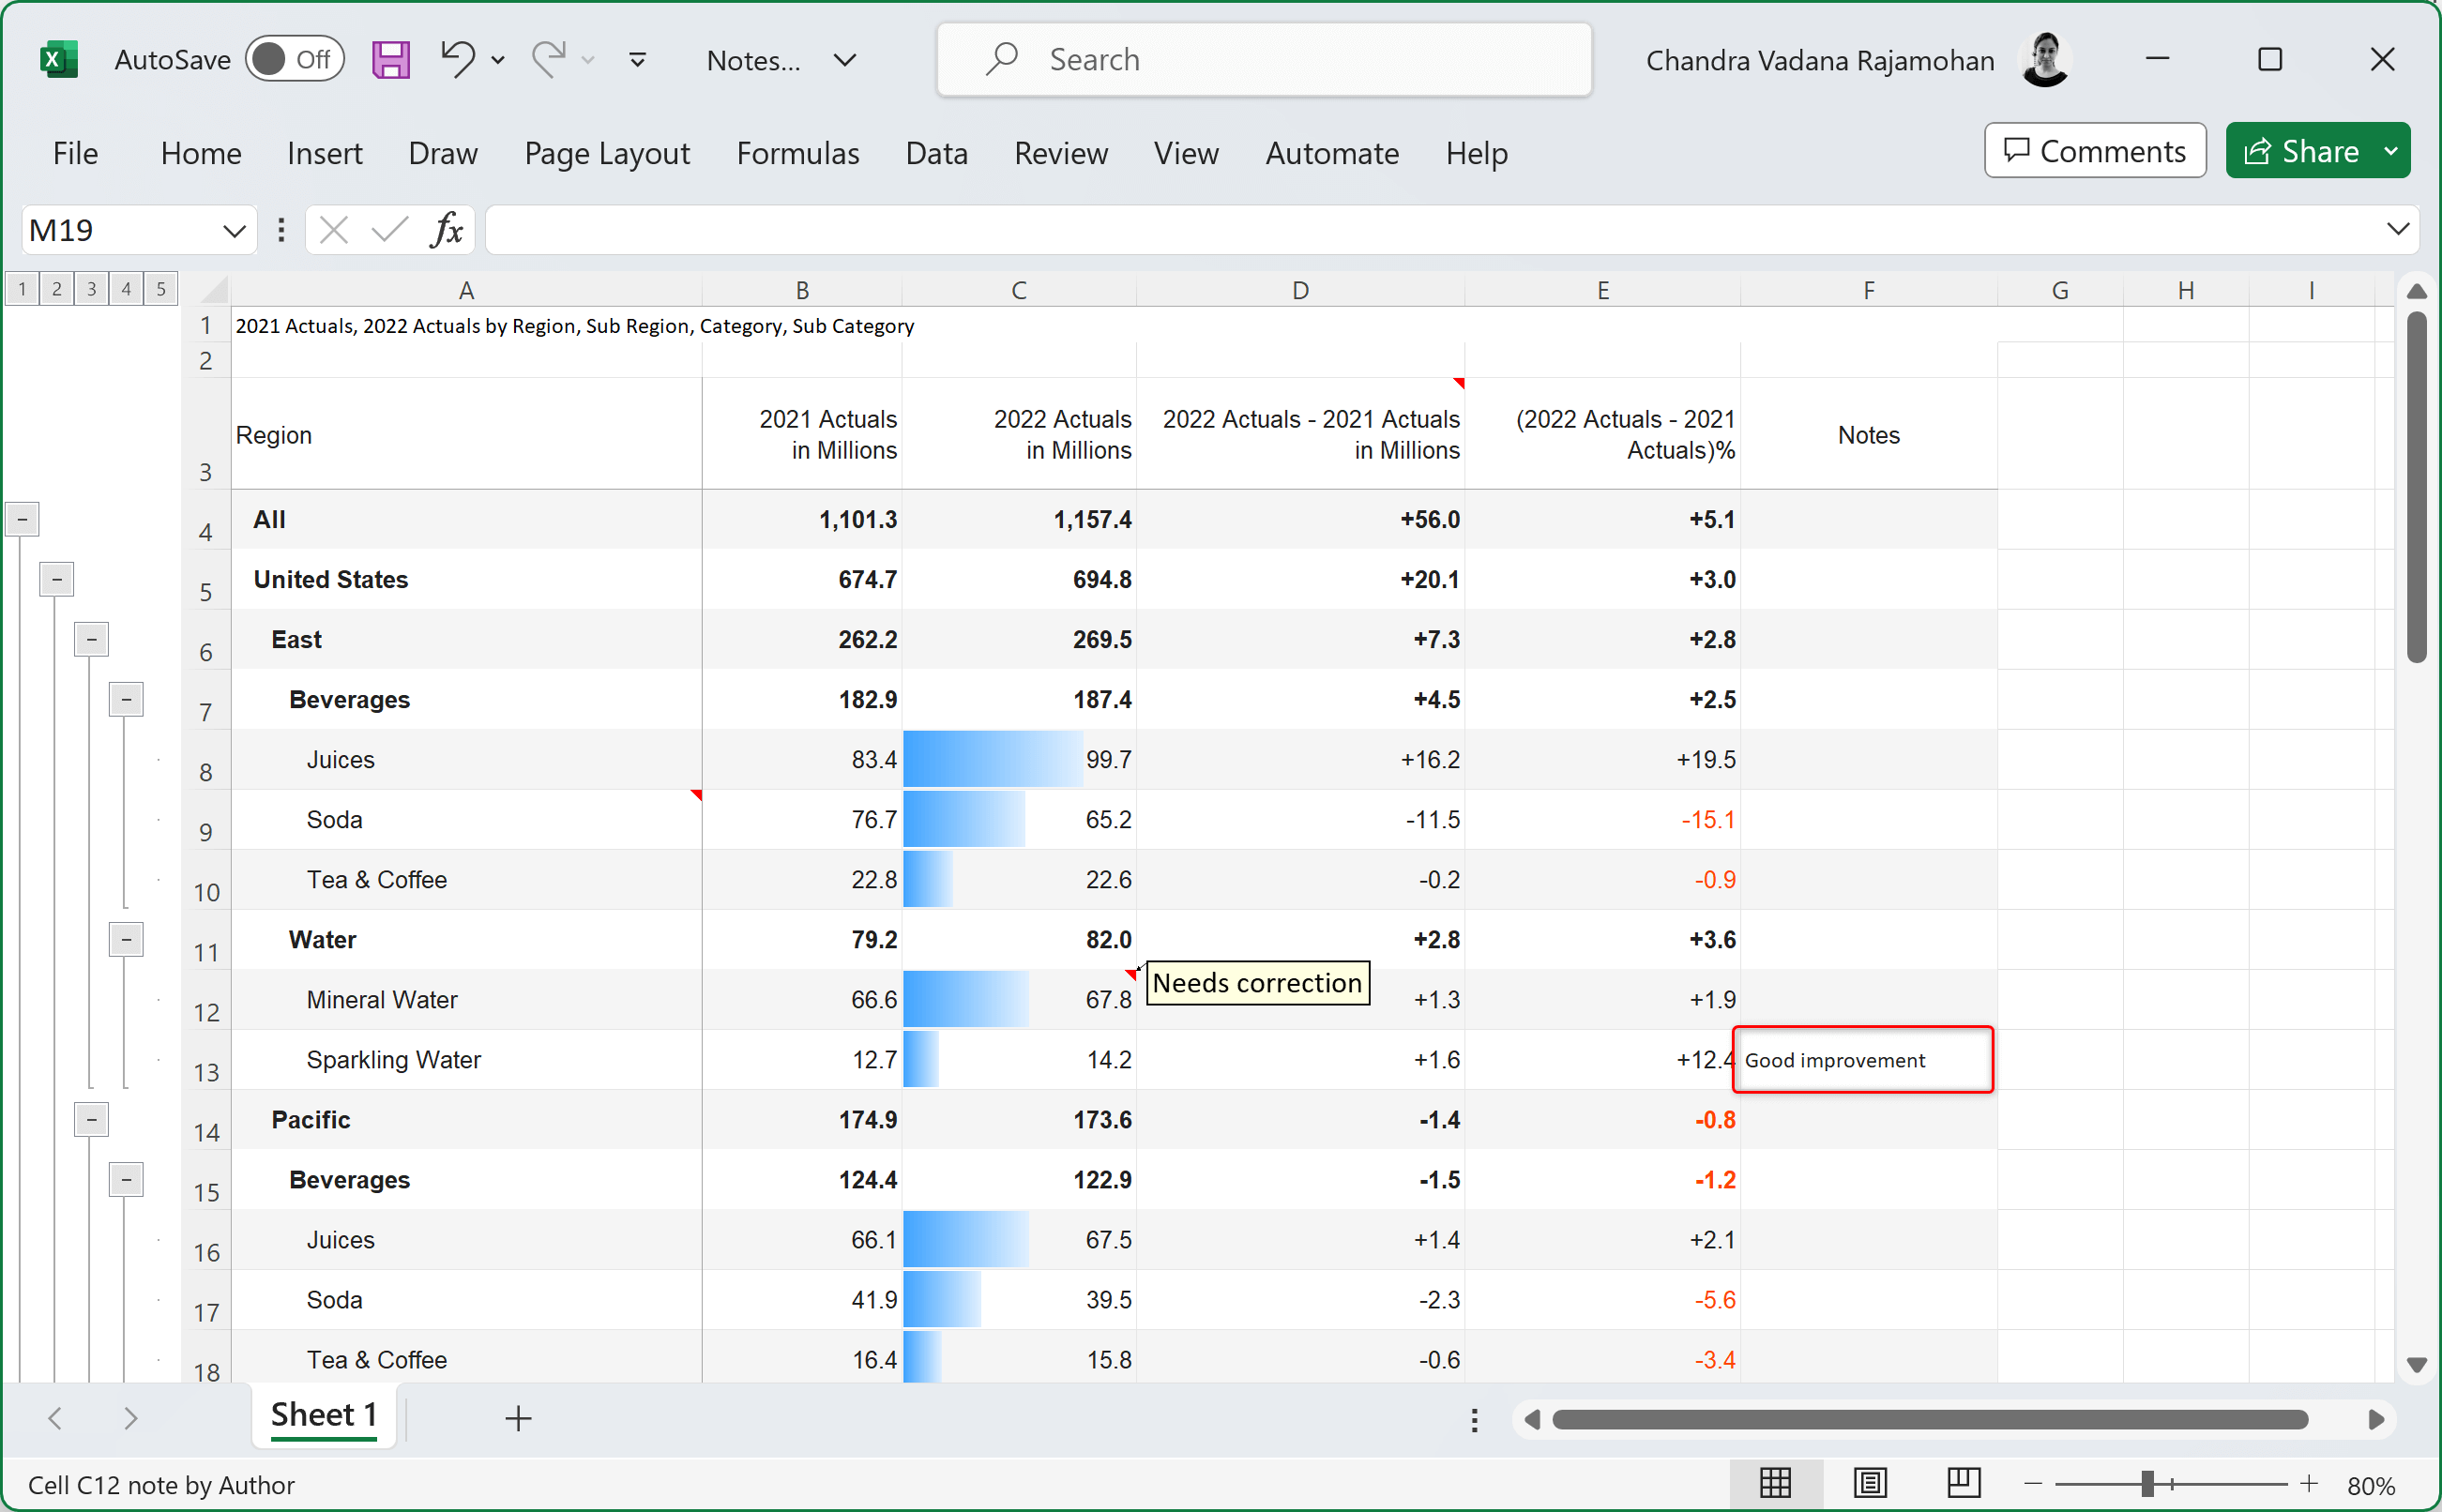
Capture row-level inputs using a dedicated notes column where long text notes are automatically word-wrapped.
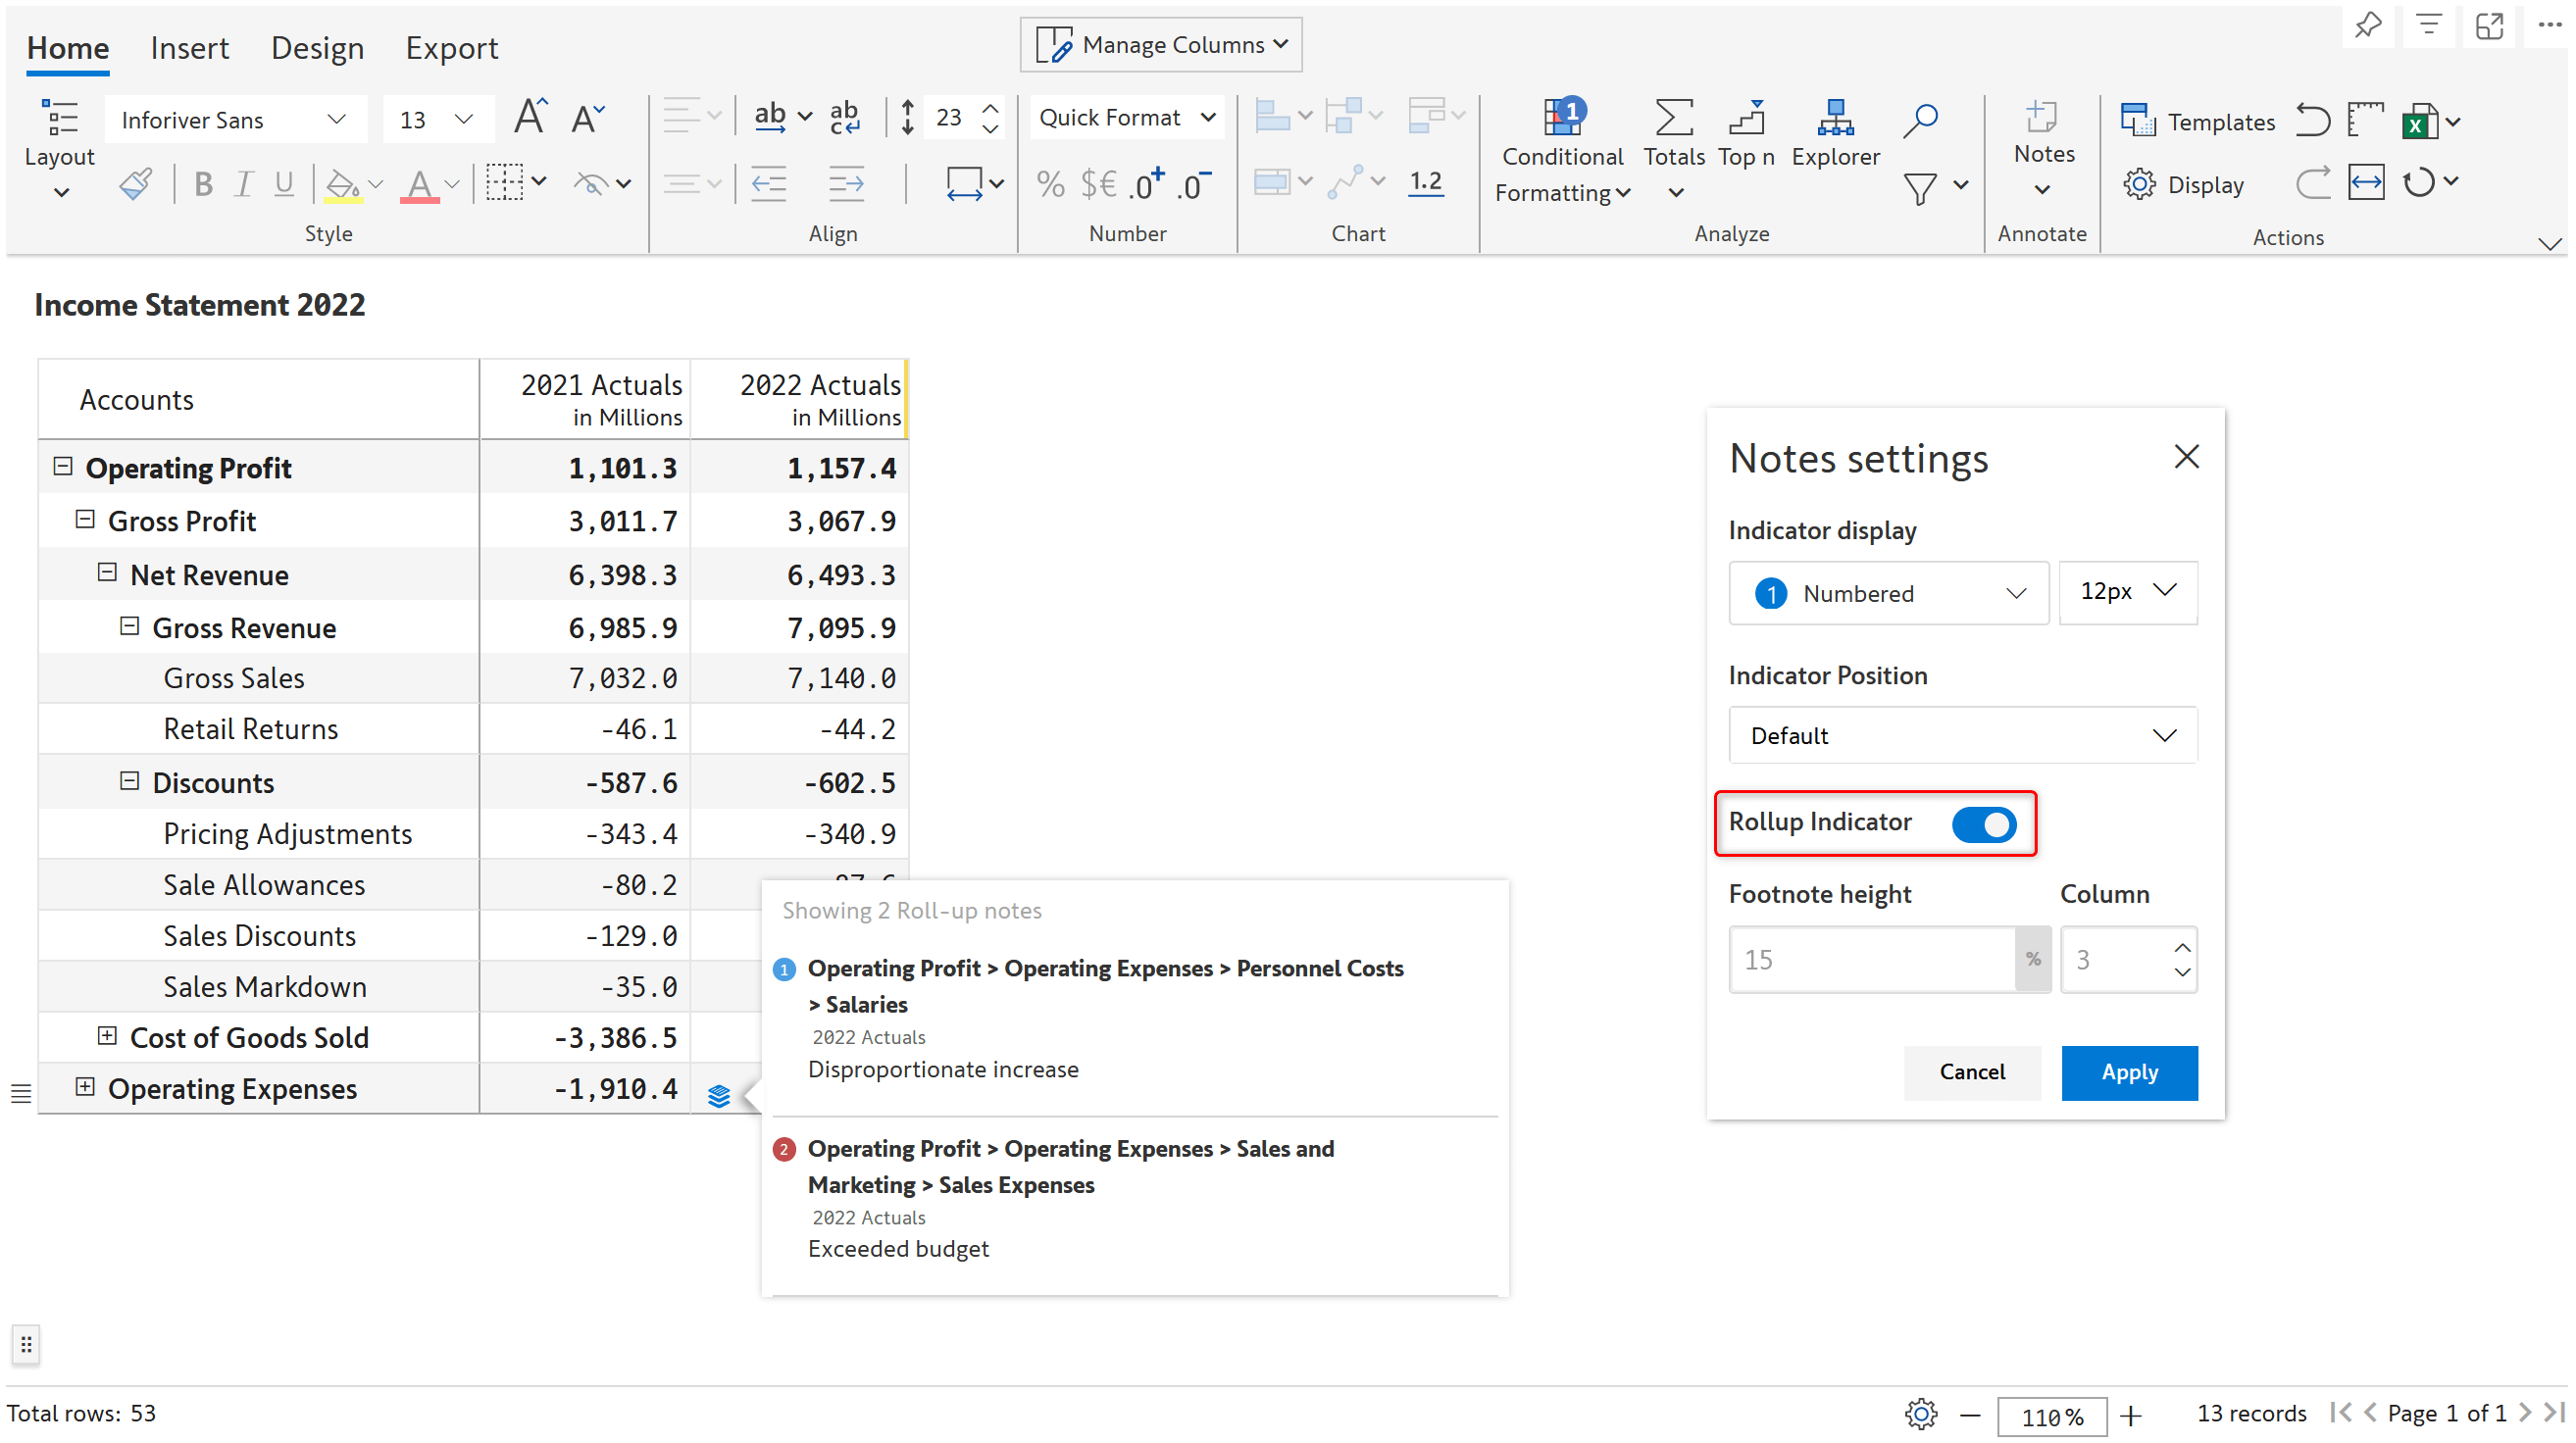
View notes at the parent/grandparent levels when lower levels of the hierarchy are collapsed. This is useful in reports with a large number of rows.
Notes you enter in a table/matrix are automatically attached to the context governed by external filters/slicers. This helps Inforiver show different notes for the same cell based on filter selection.
Export data-level notes and notes columns to the Excel and PDF files.
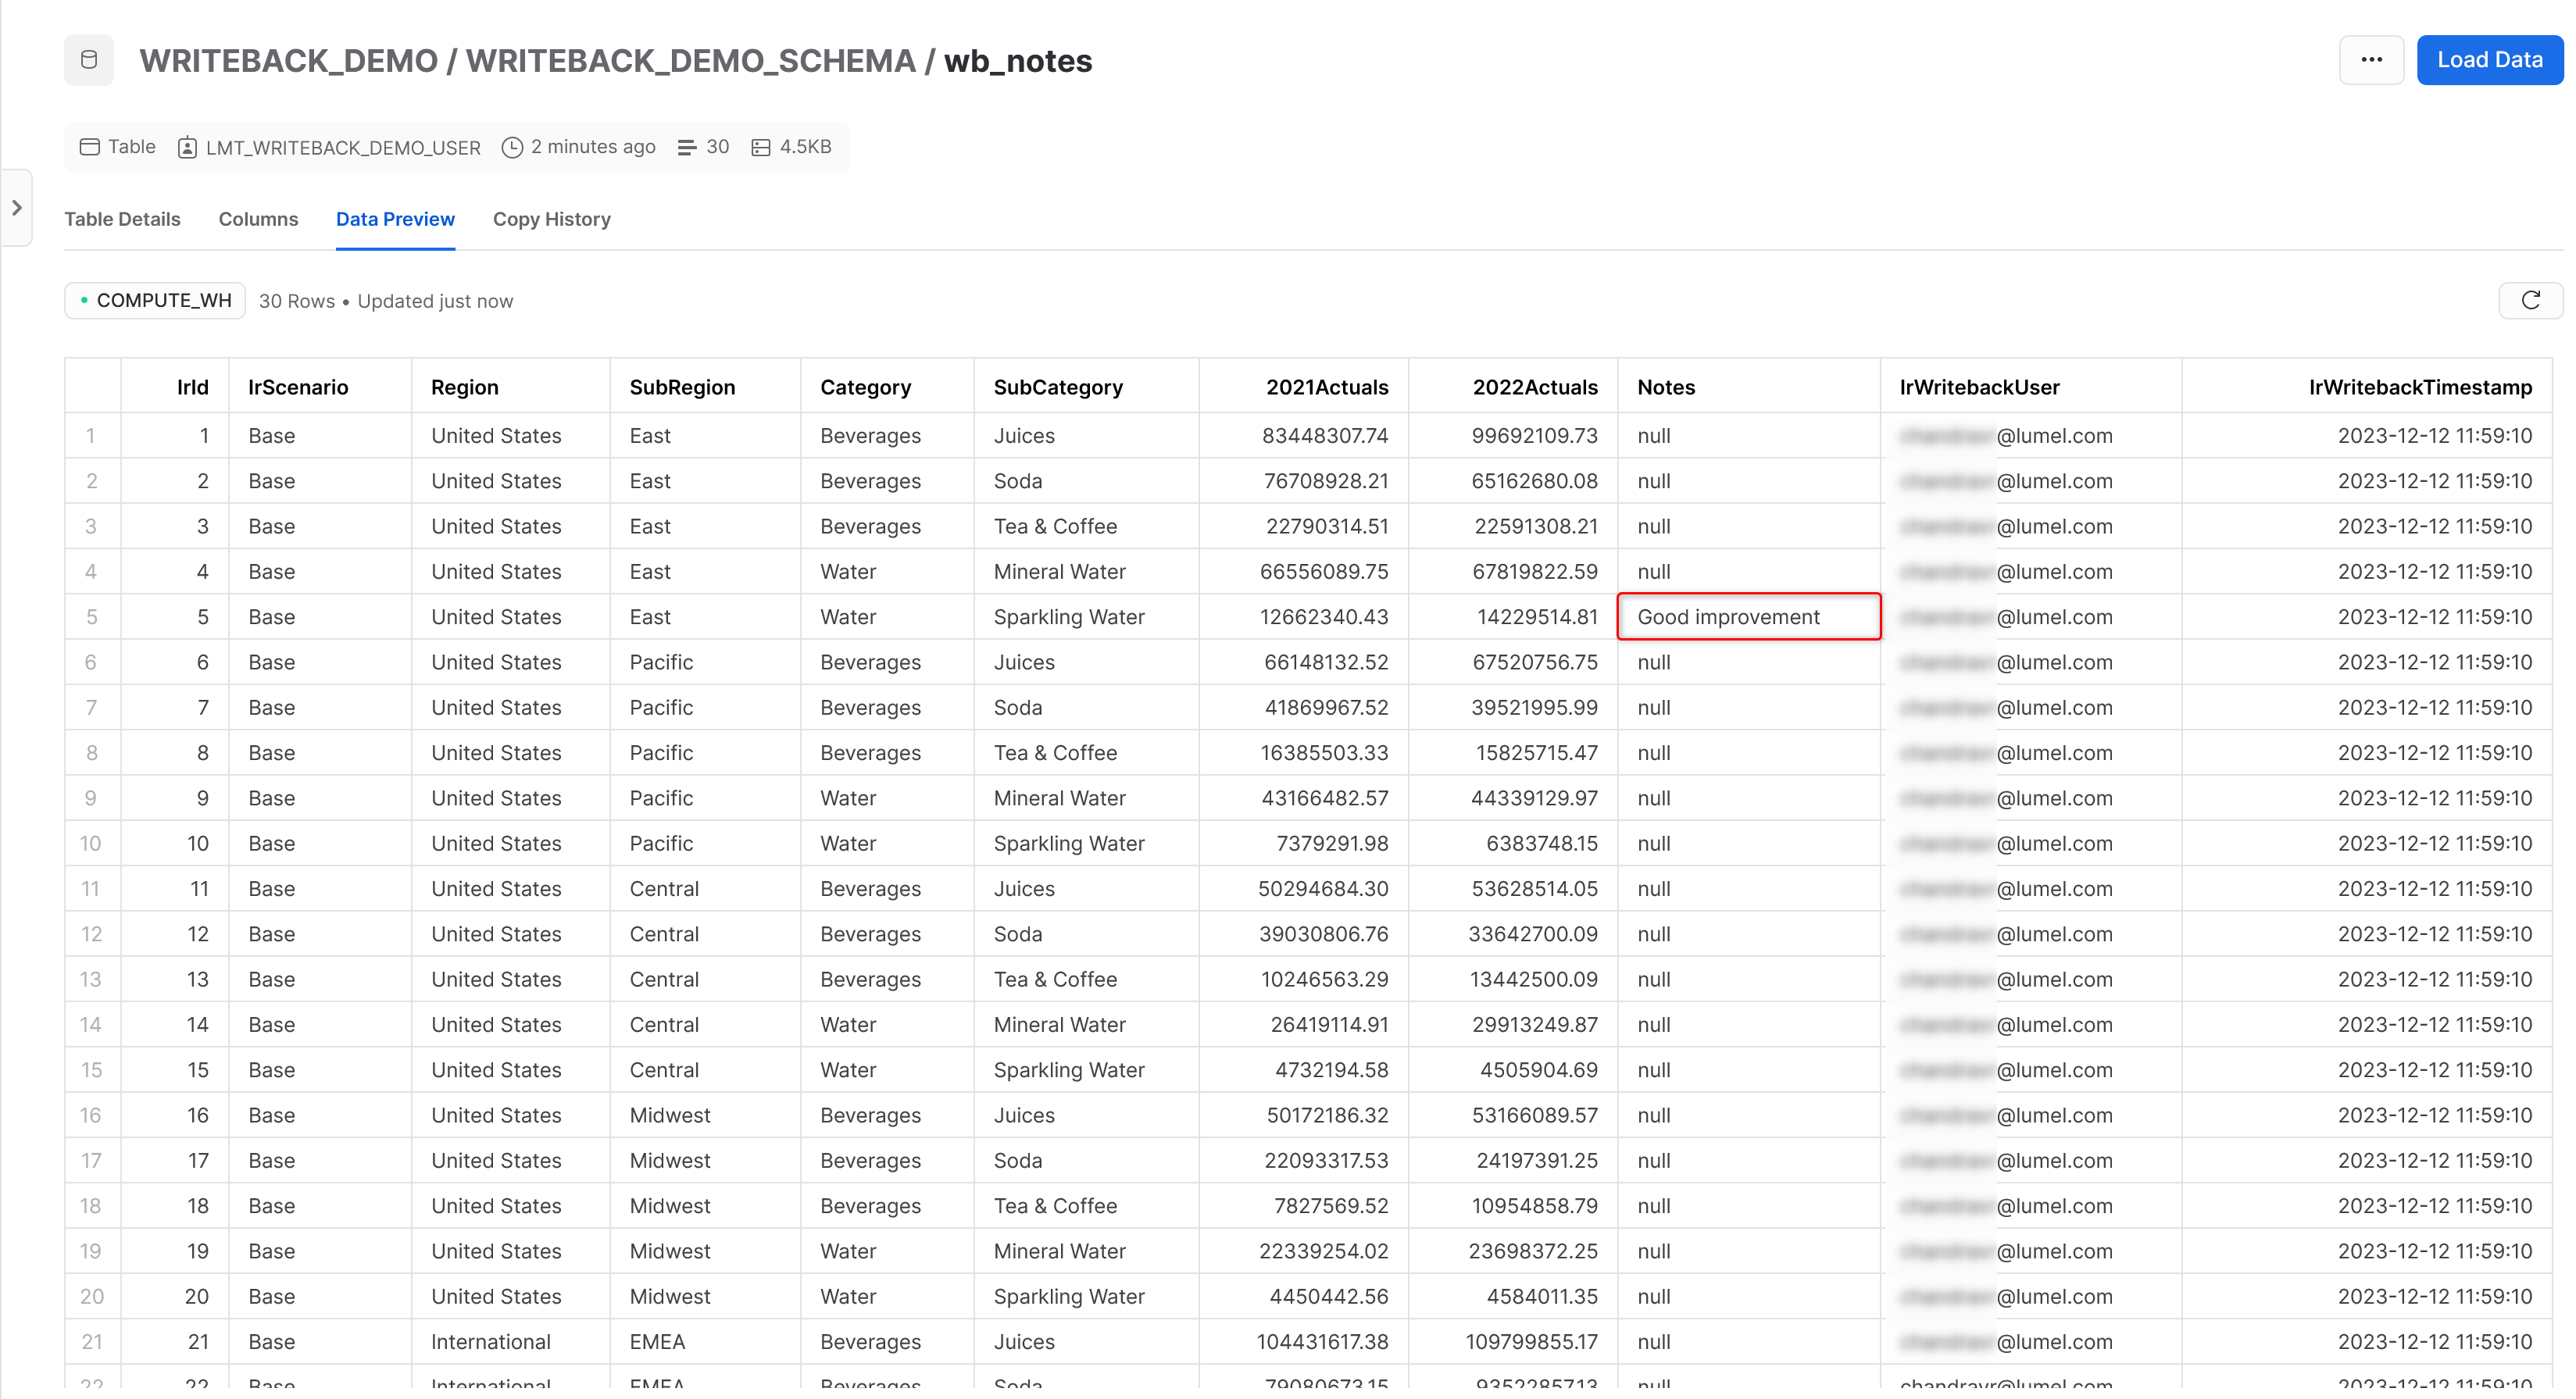
Save notes to databases, shared drives, and URL destinations, along with the filter context. Destinations supported include Microsoft Fabric Datawarehouse, Lakehouse, Dataverse, Snowflake, OneDrive, SharePoint, and more.
Note: Writeback is available only in Inforiver Enterprise.
Learn how to implement context-aware commenting in Power BI in three easy steps

Migrate your reports from Tableau, Spotfire, Qlik, Cognos and SAP to Power BI seamlessly.
The capabilities listed here are available in Inforiver Enterprise.
Add formatted data-level comments, which are saved securely to the database along with author and time stamp details
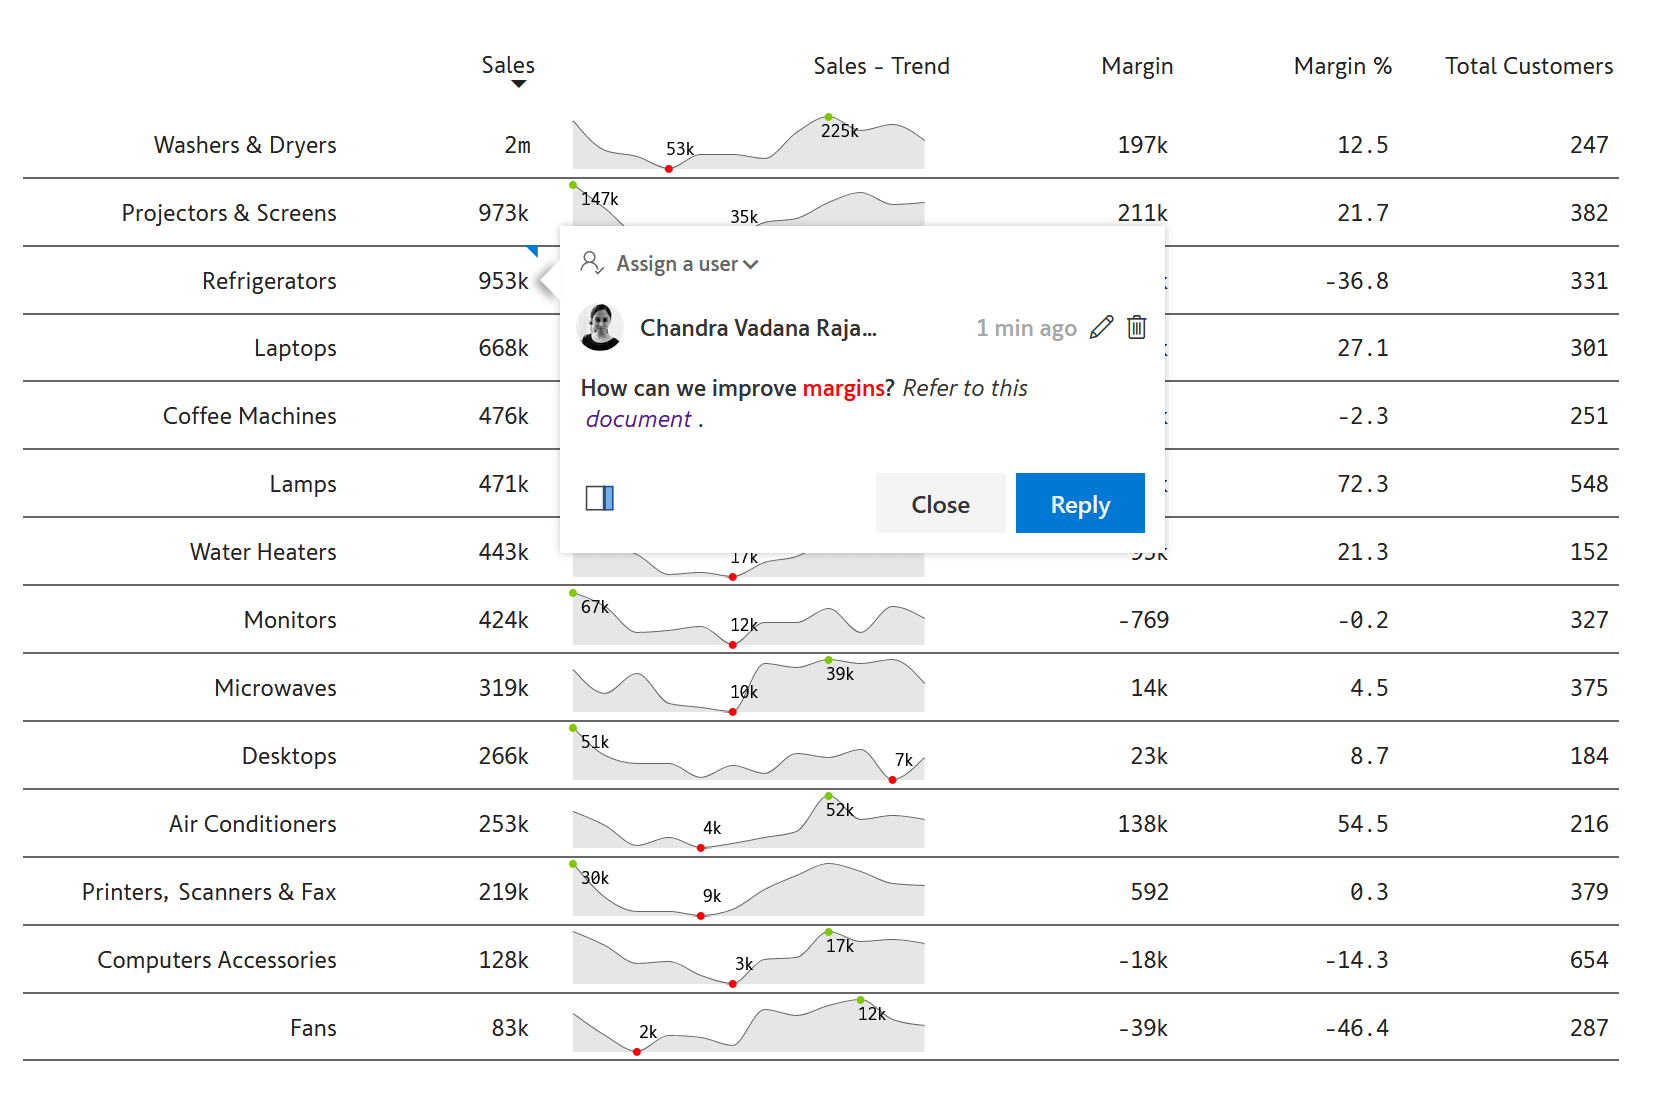
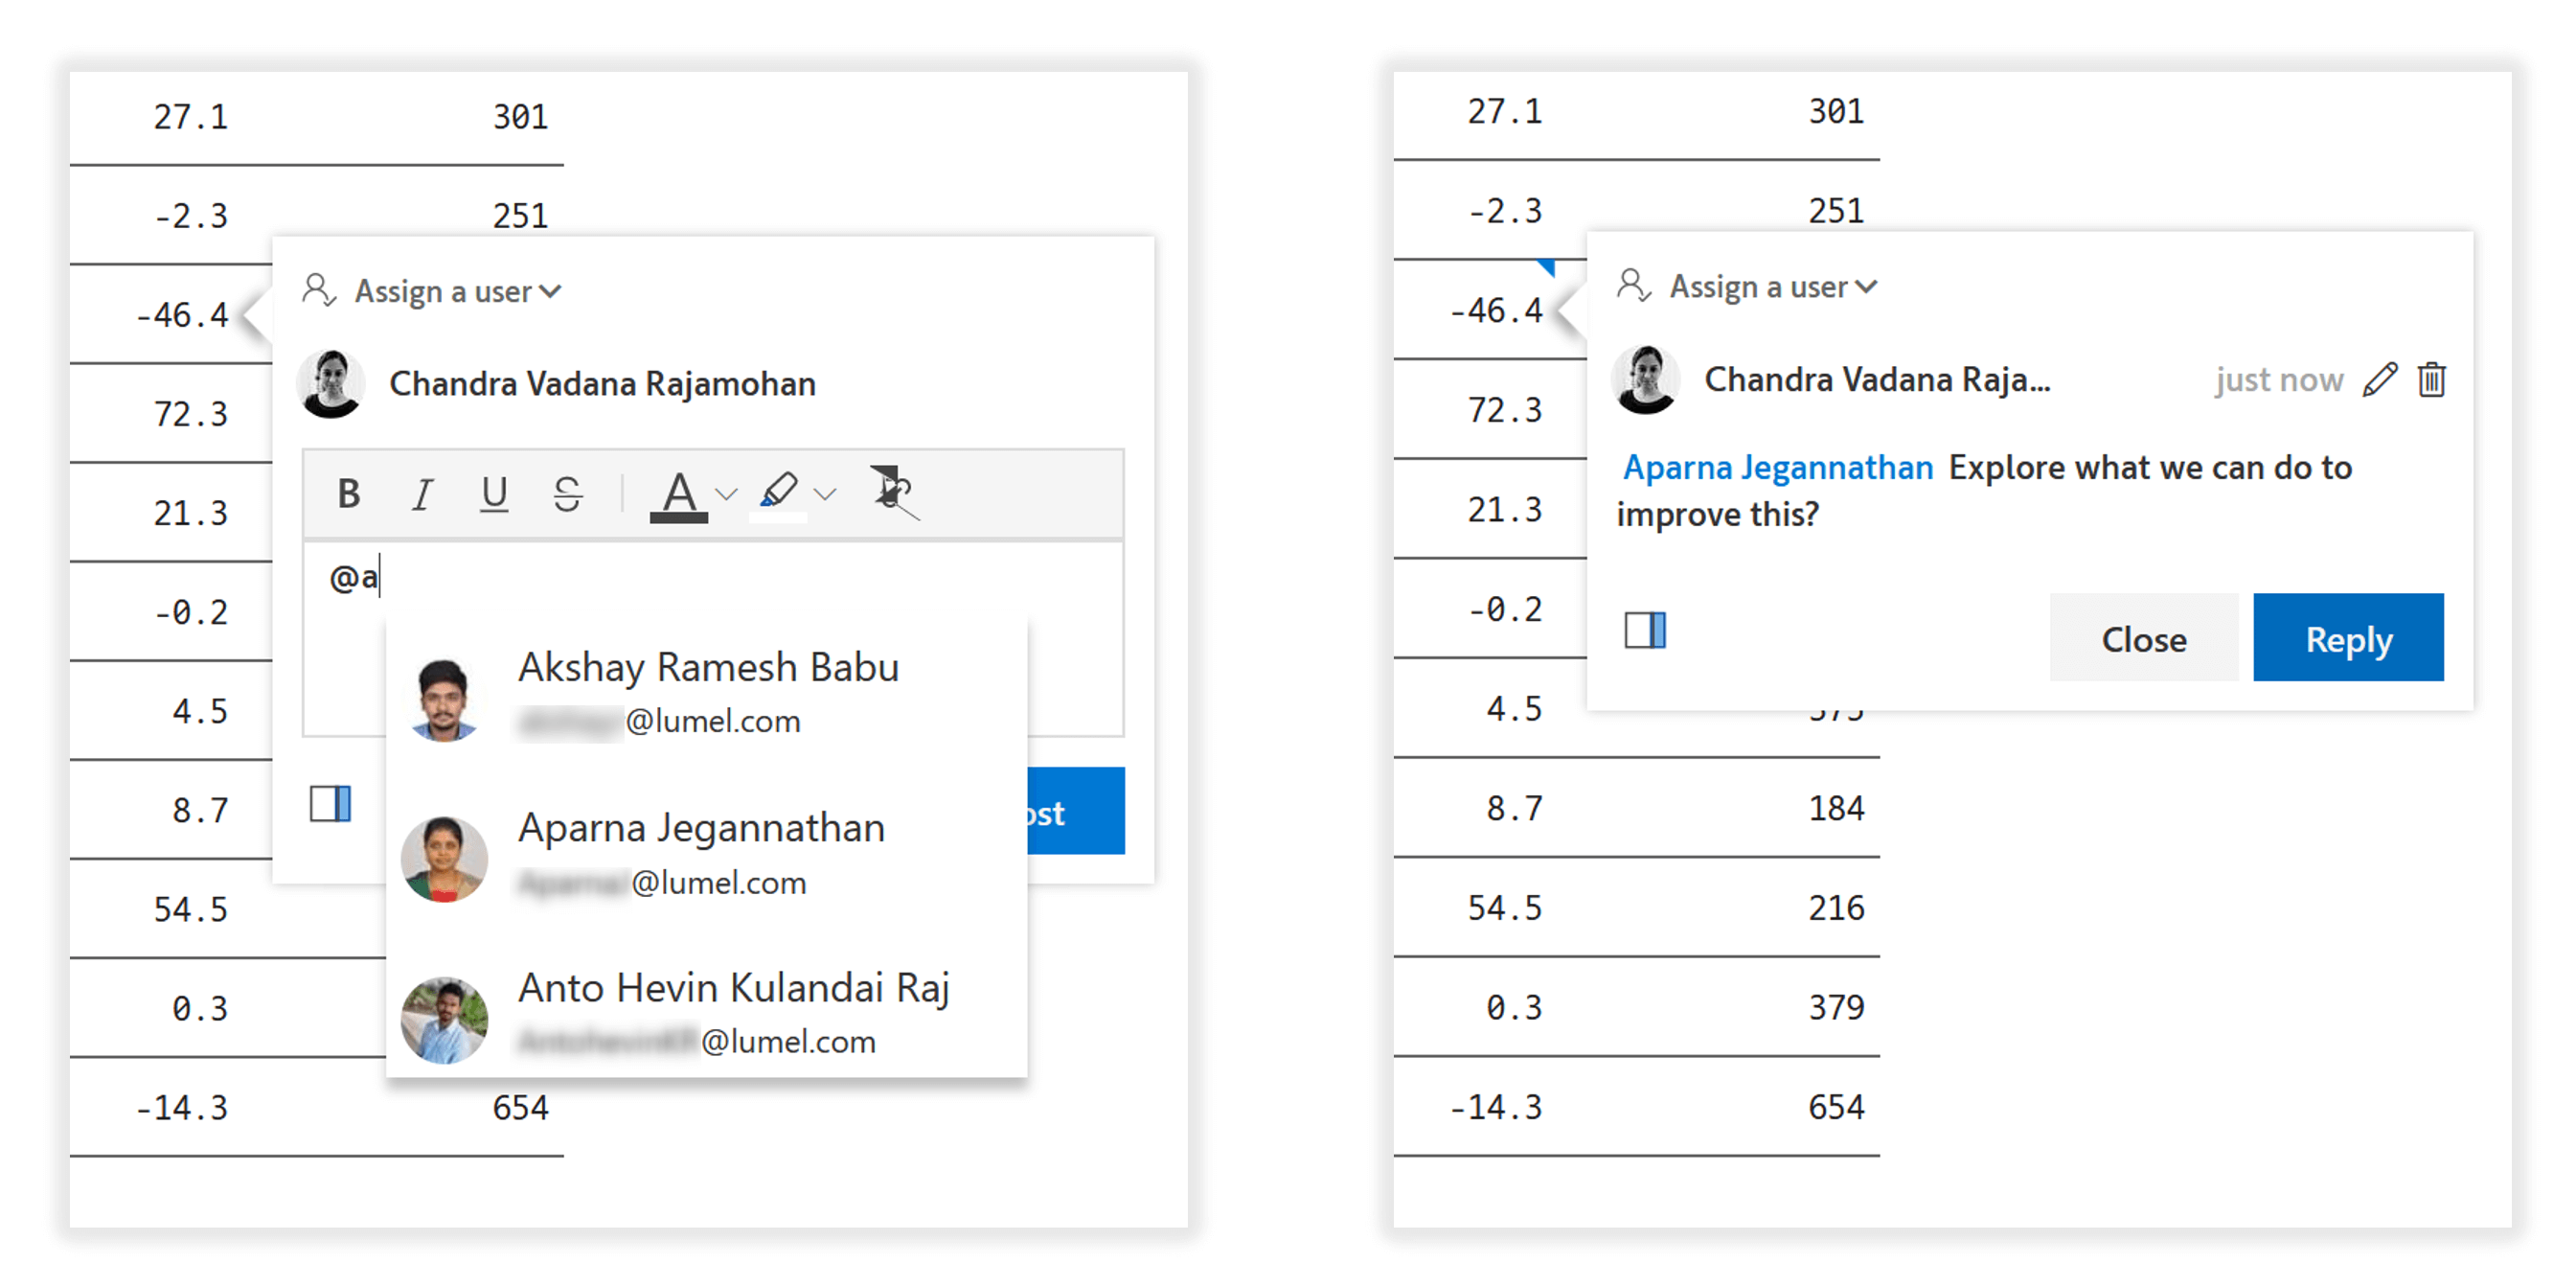
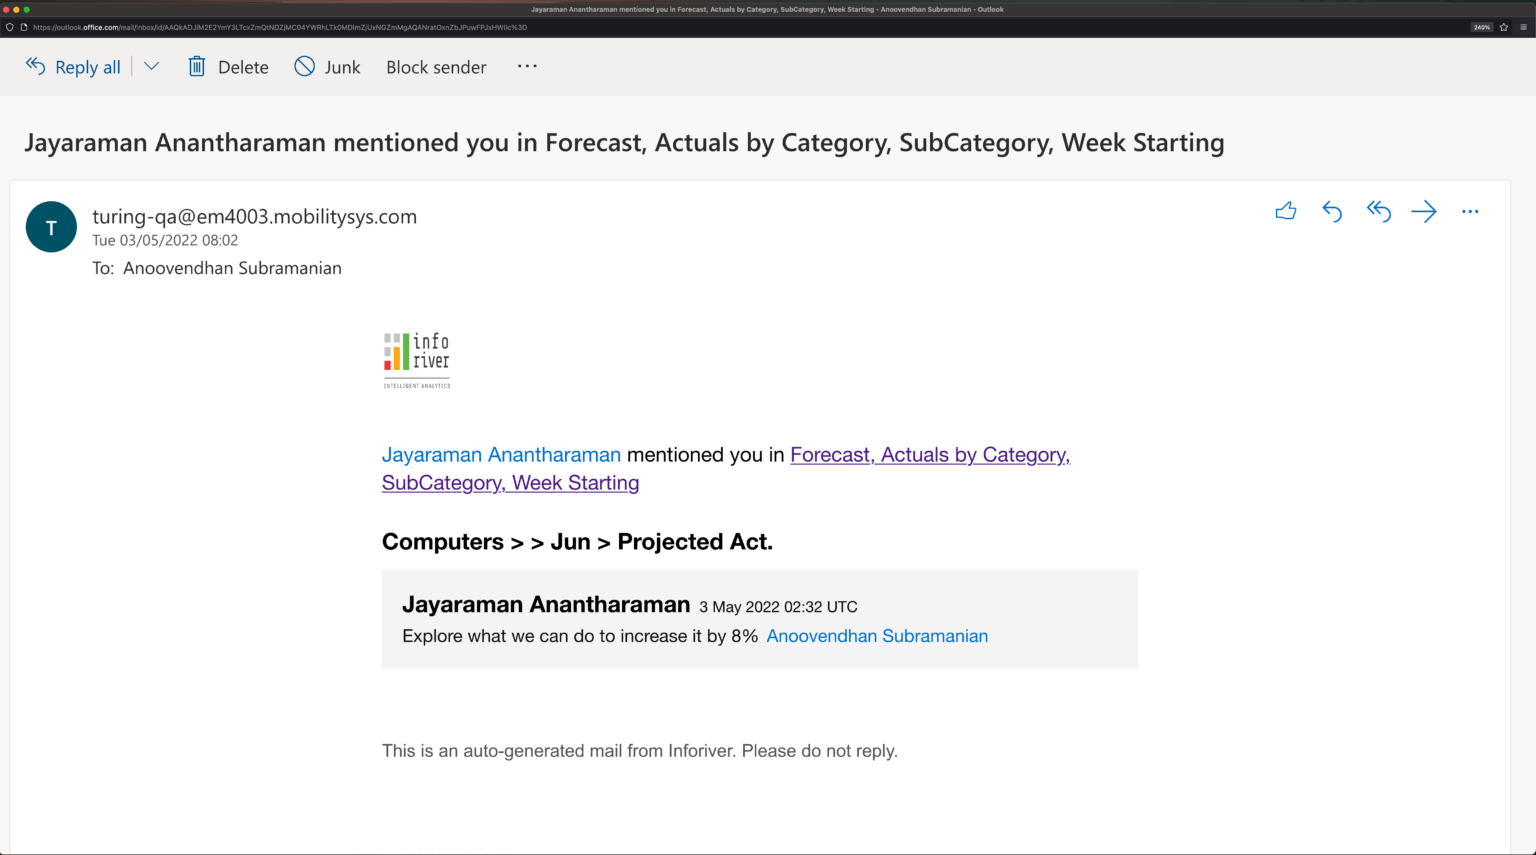
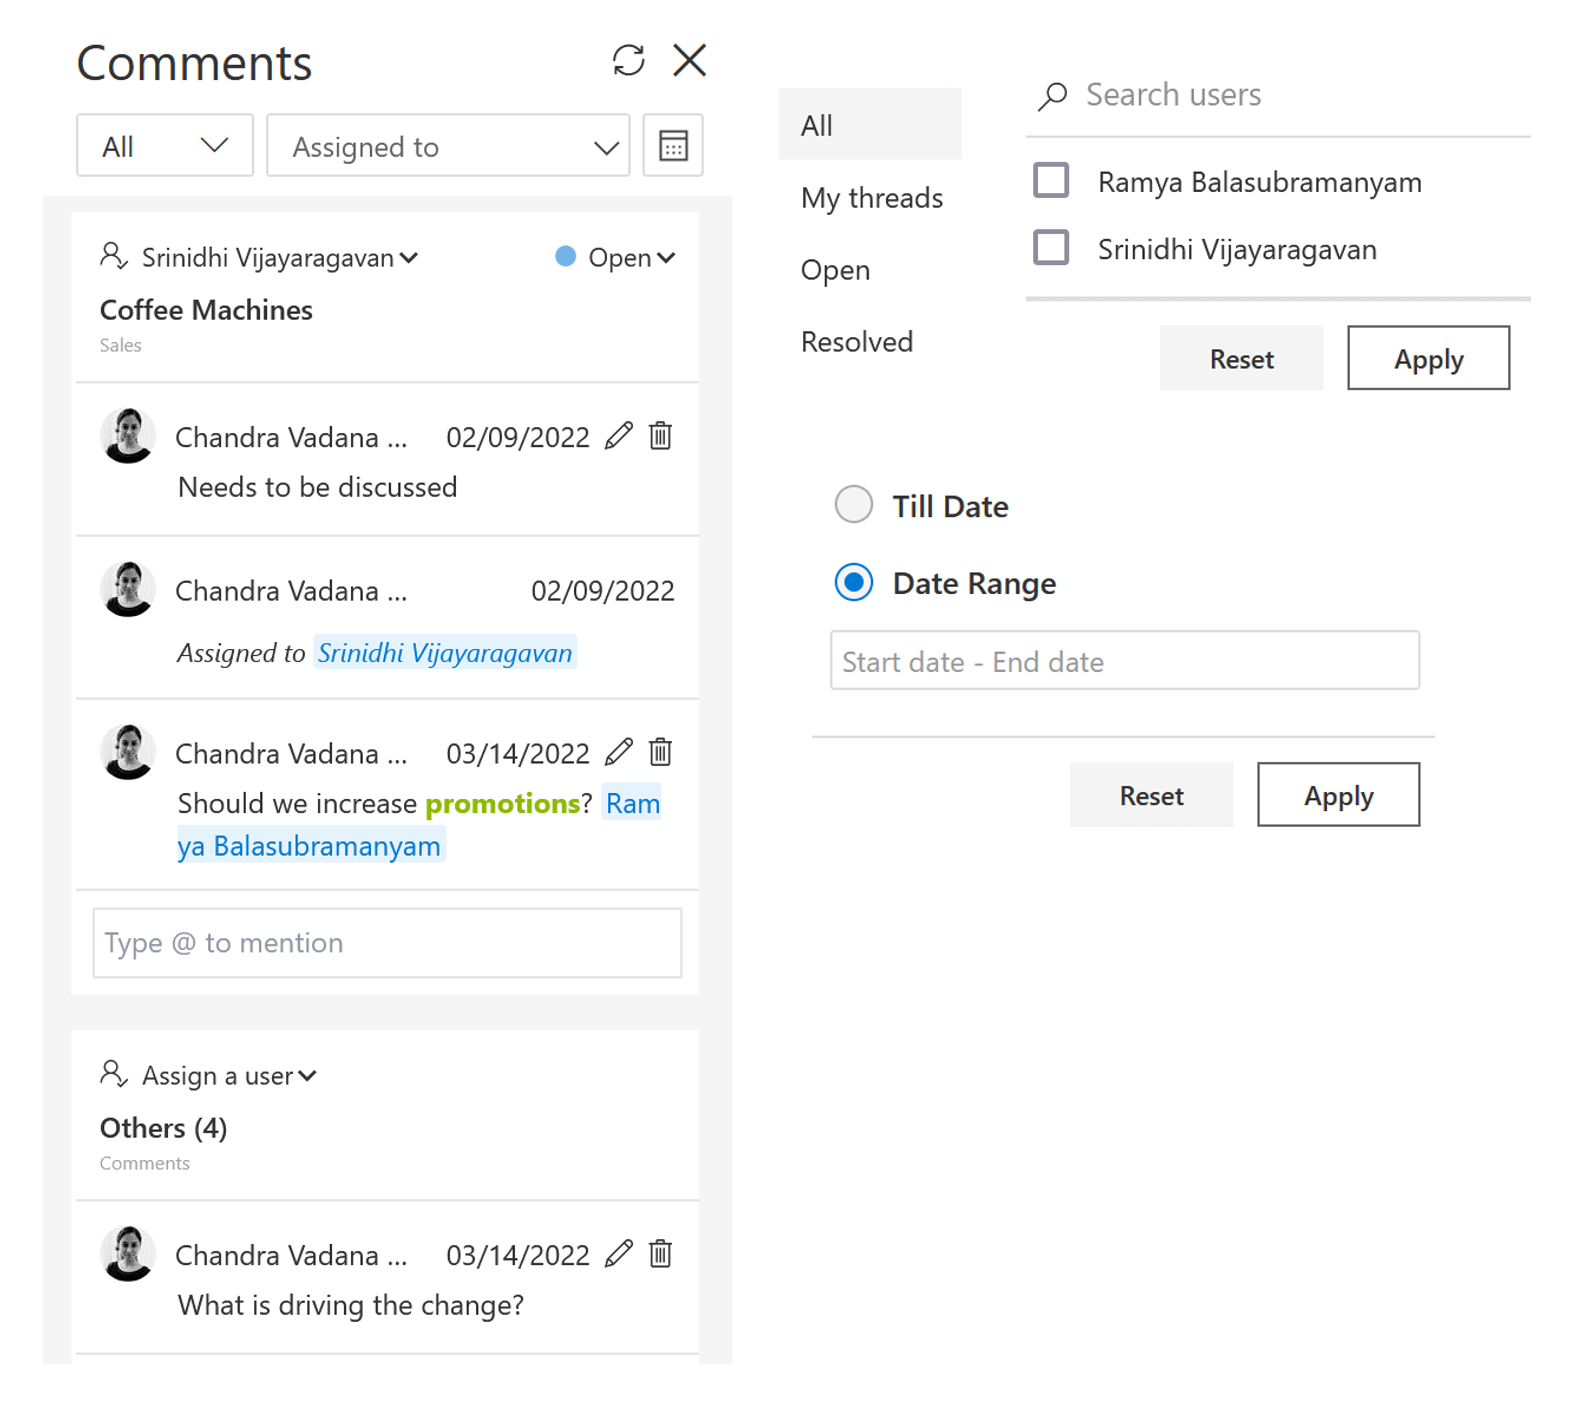
Use @mentions in the comments to tag other stakeholders and grab their attention. This sends automated email notifications to tagged users, who can click on the link in the email to respond to comments directly.
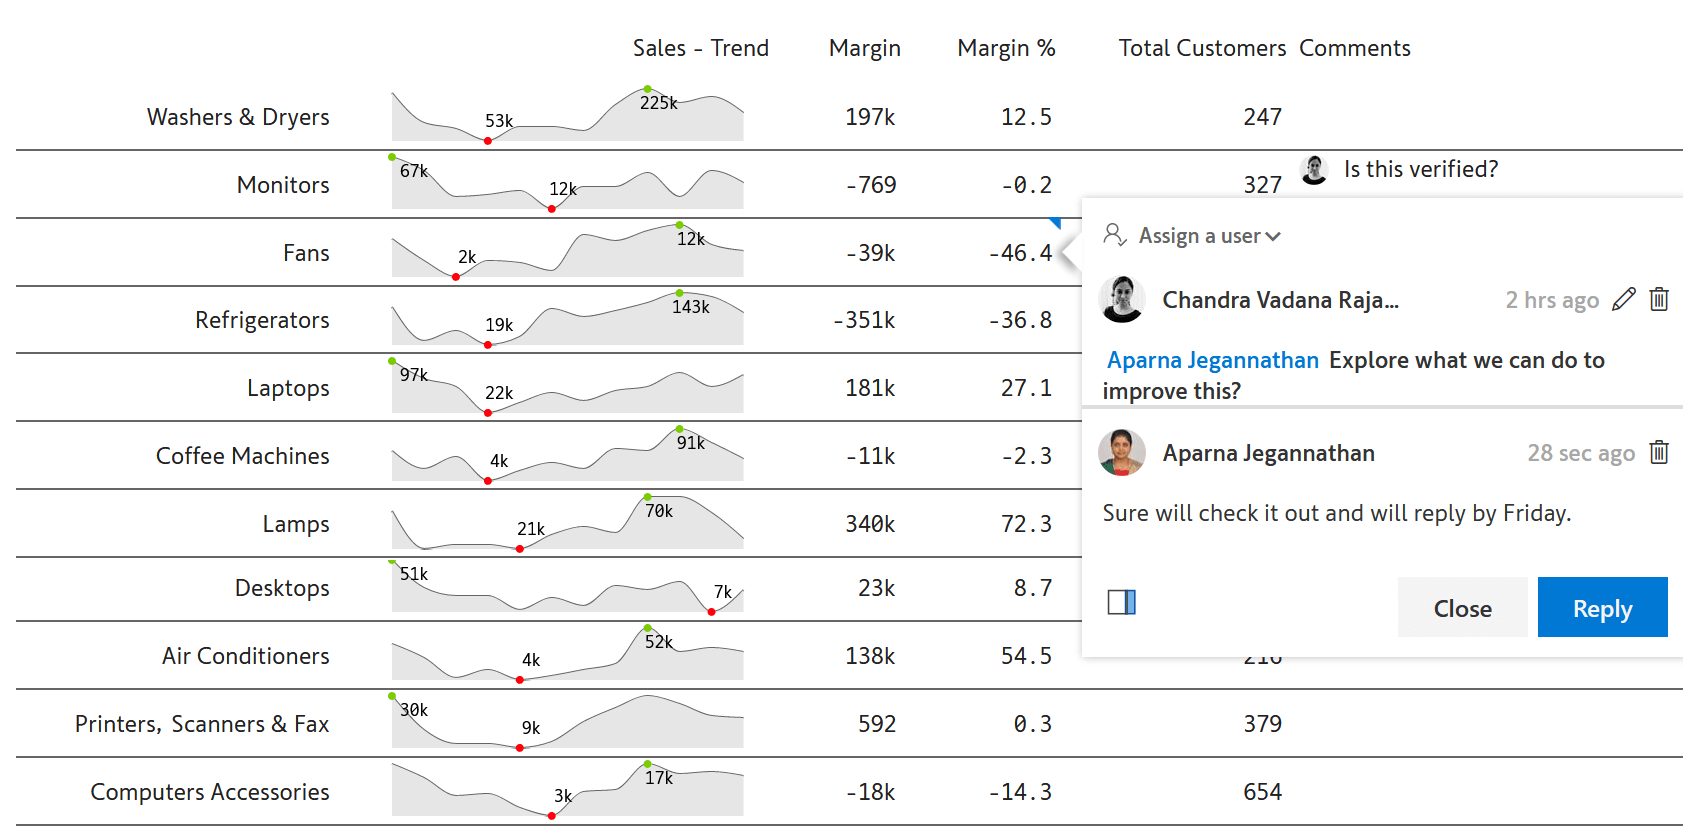
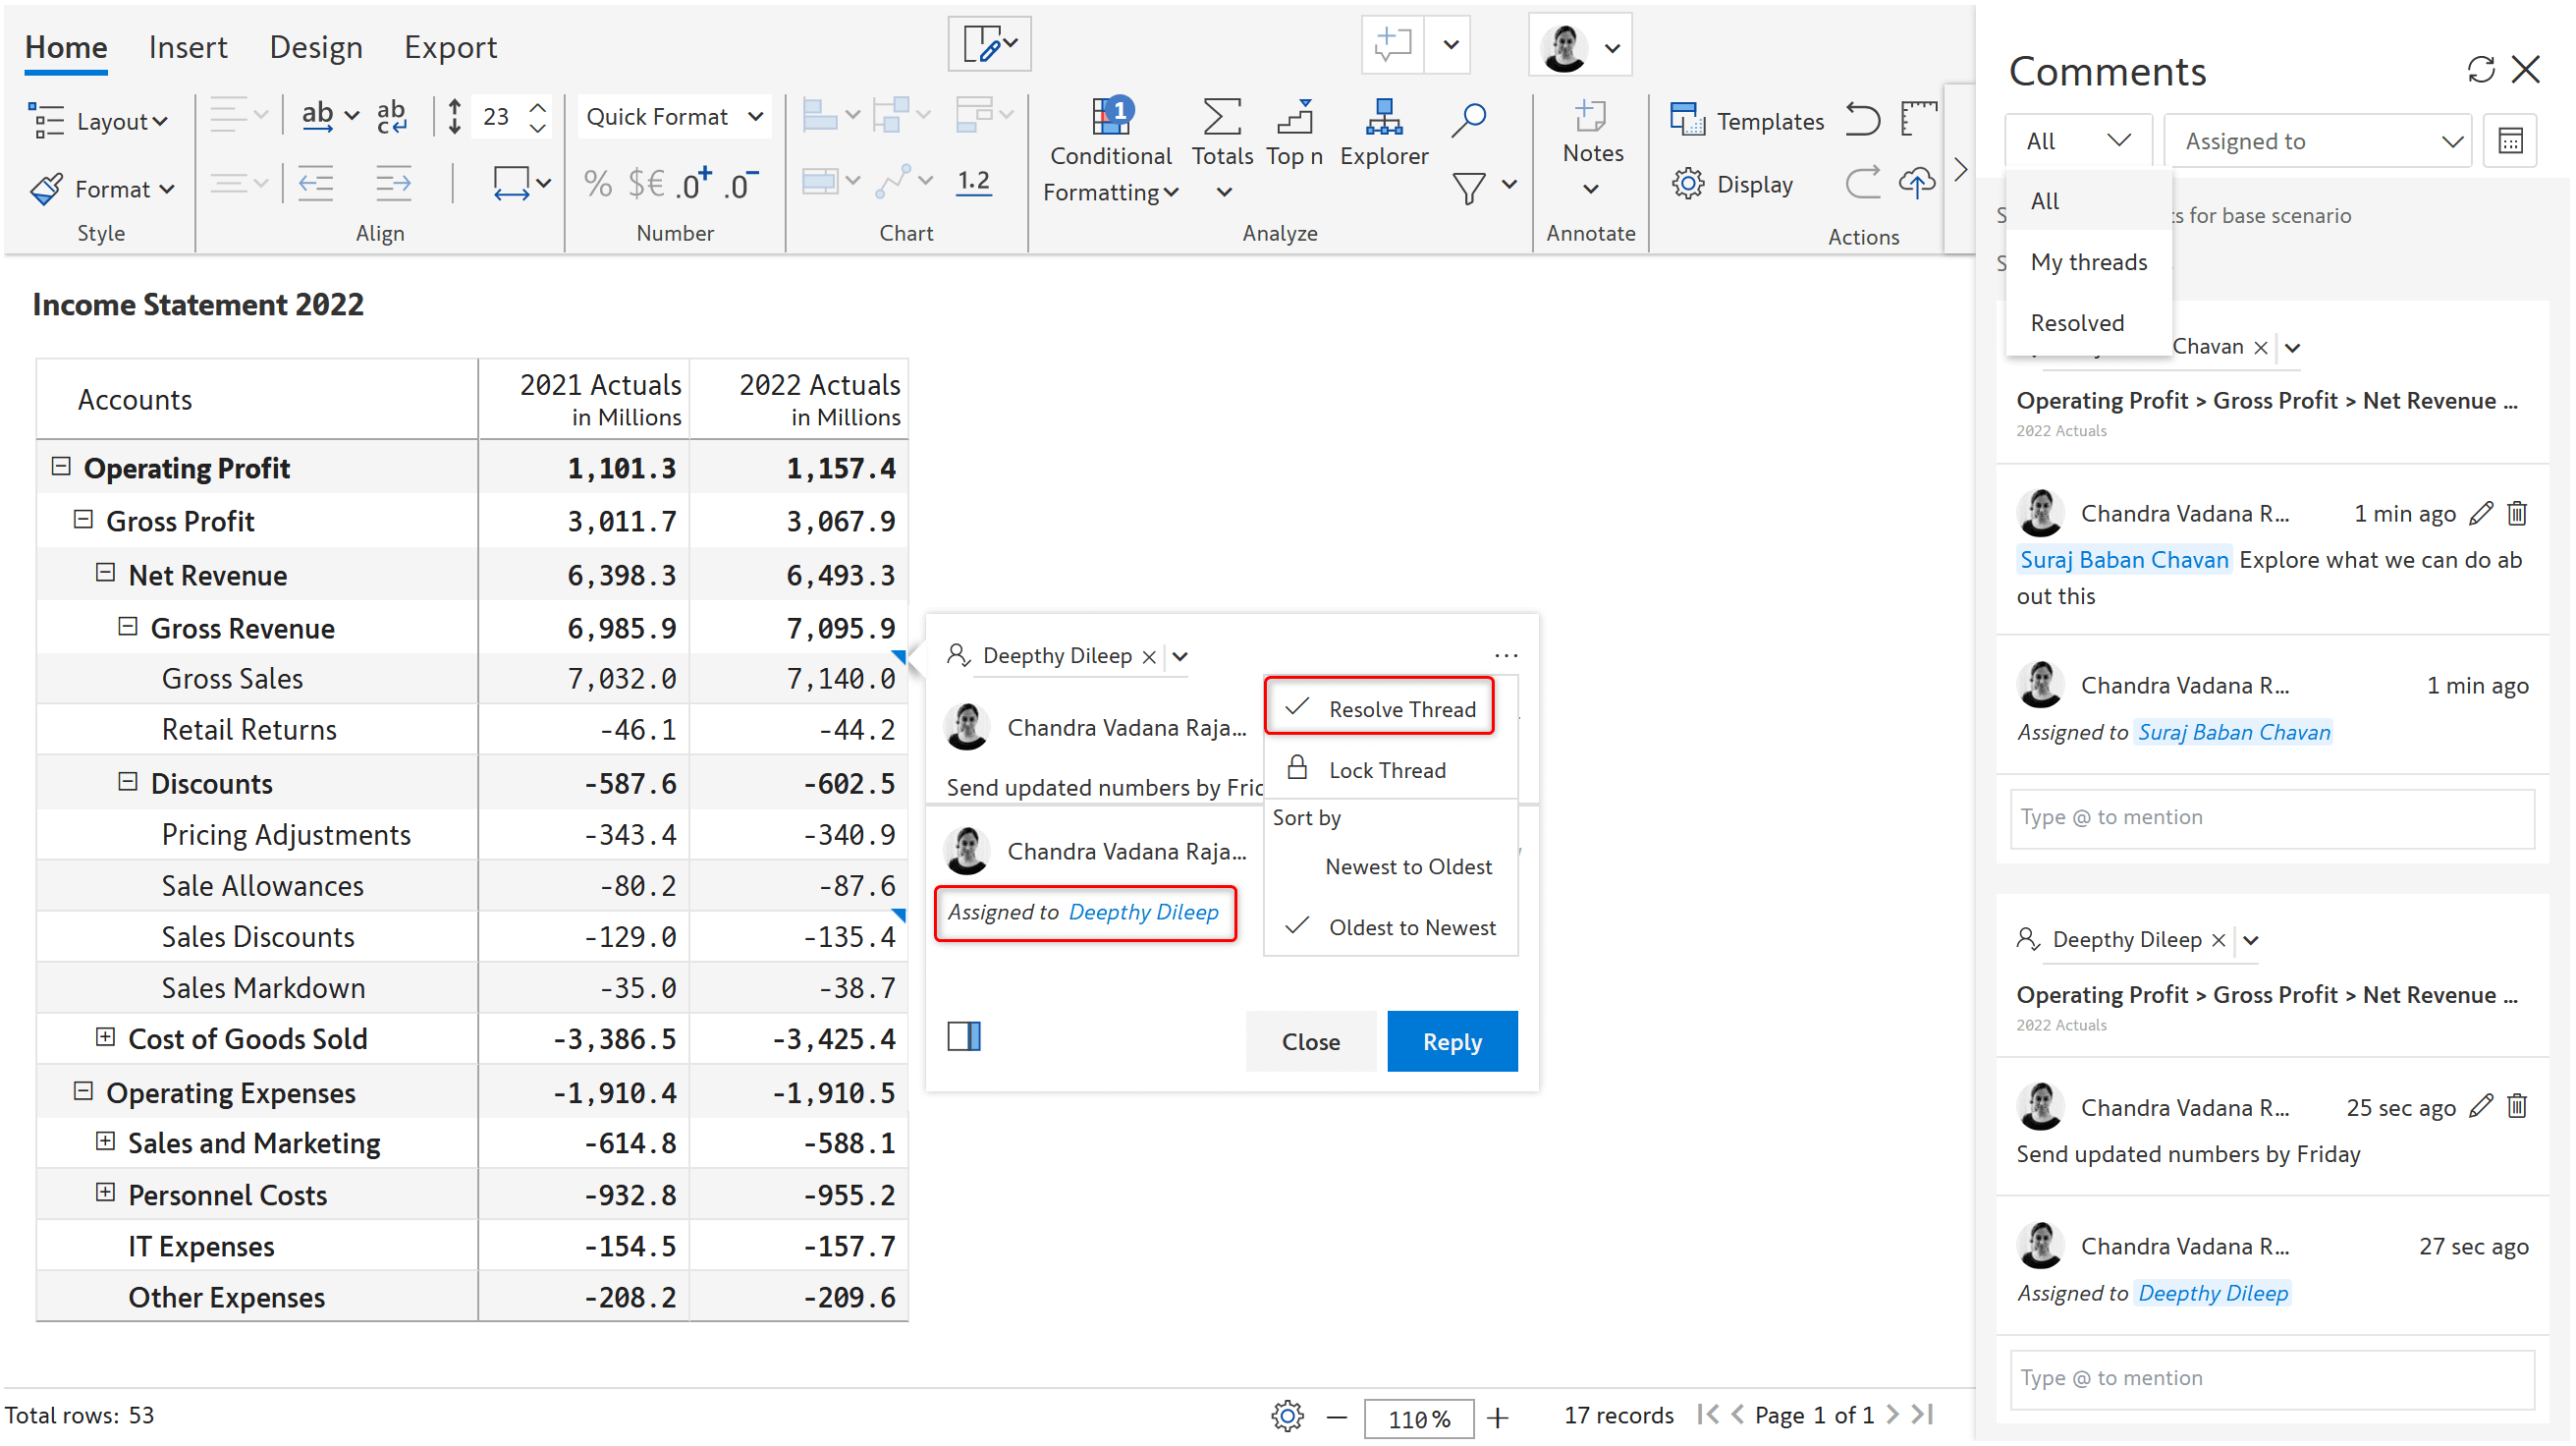
Reply to comments and have threaded conversations at a cell, row, or column level.
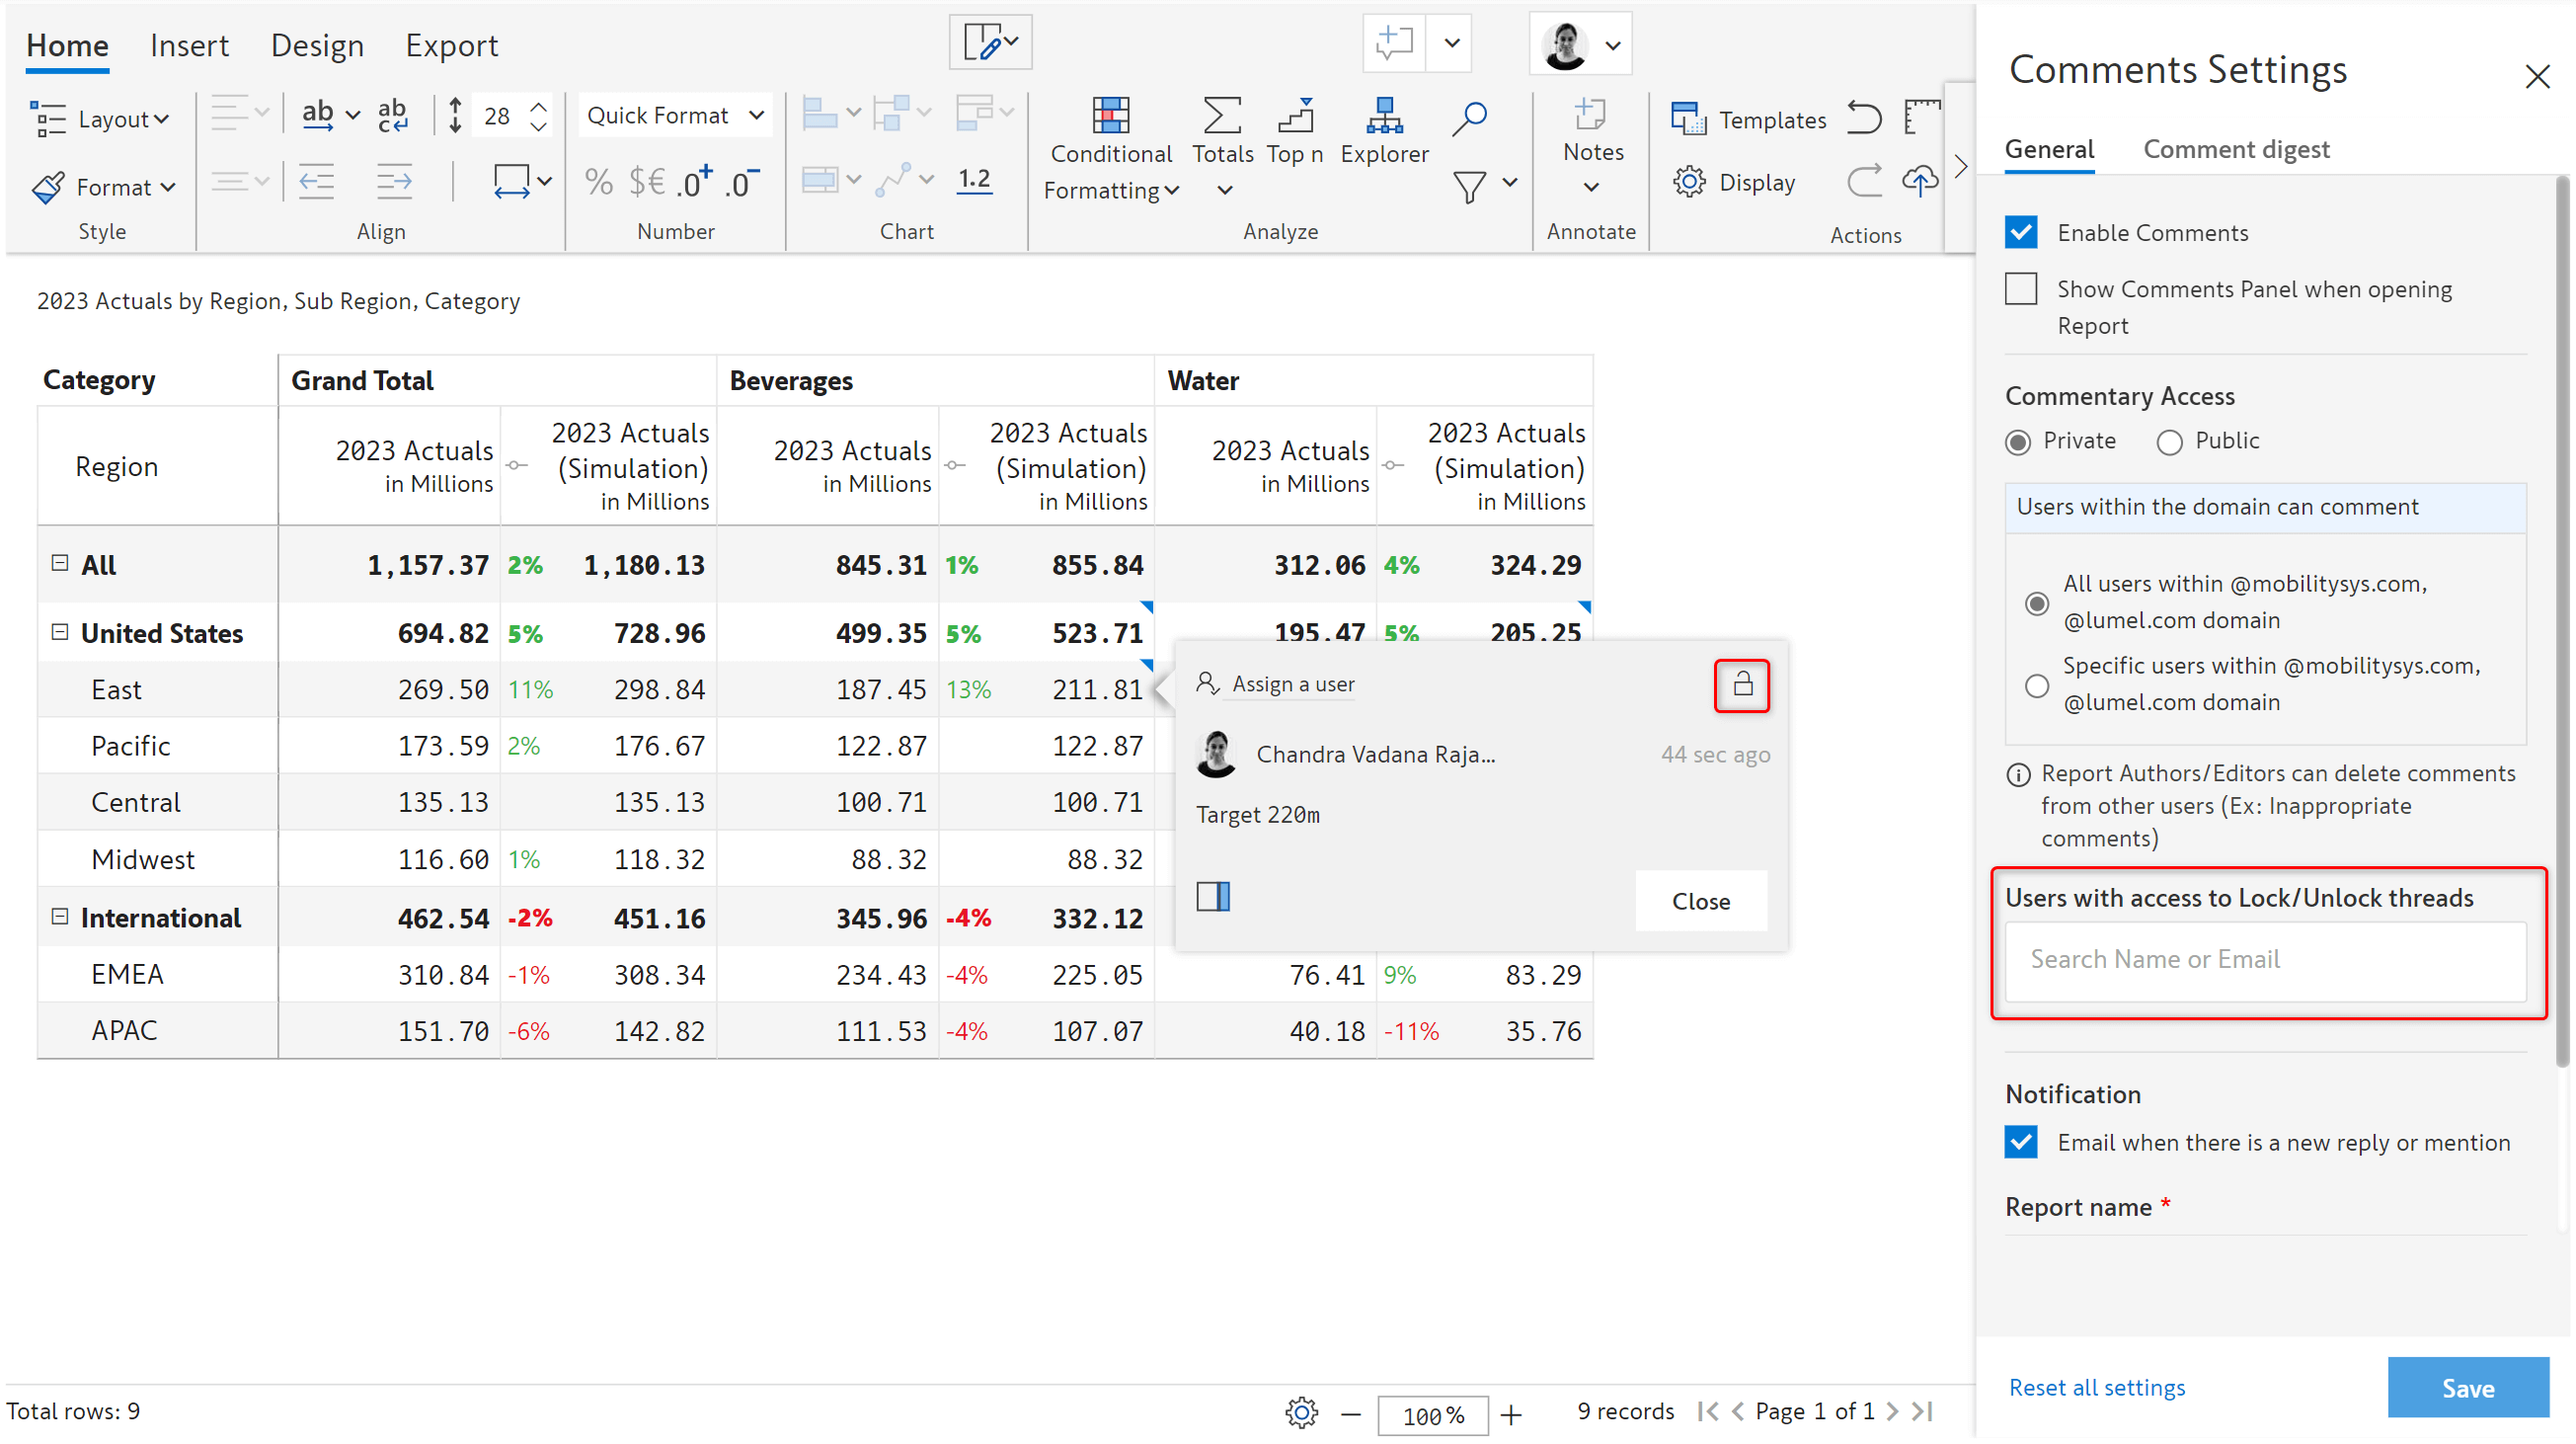
Lock specific comment threads to prevent replies. Access to lock/unlock threads can be easily managed in the visual.
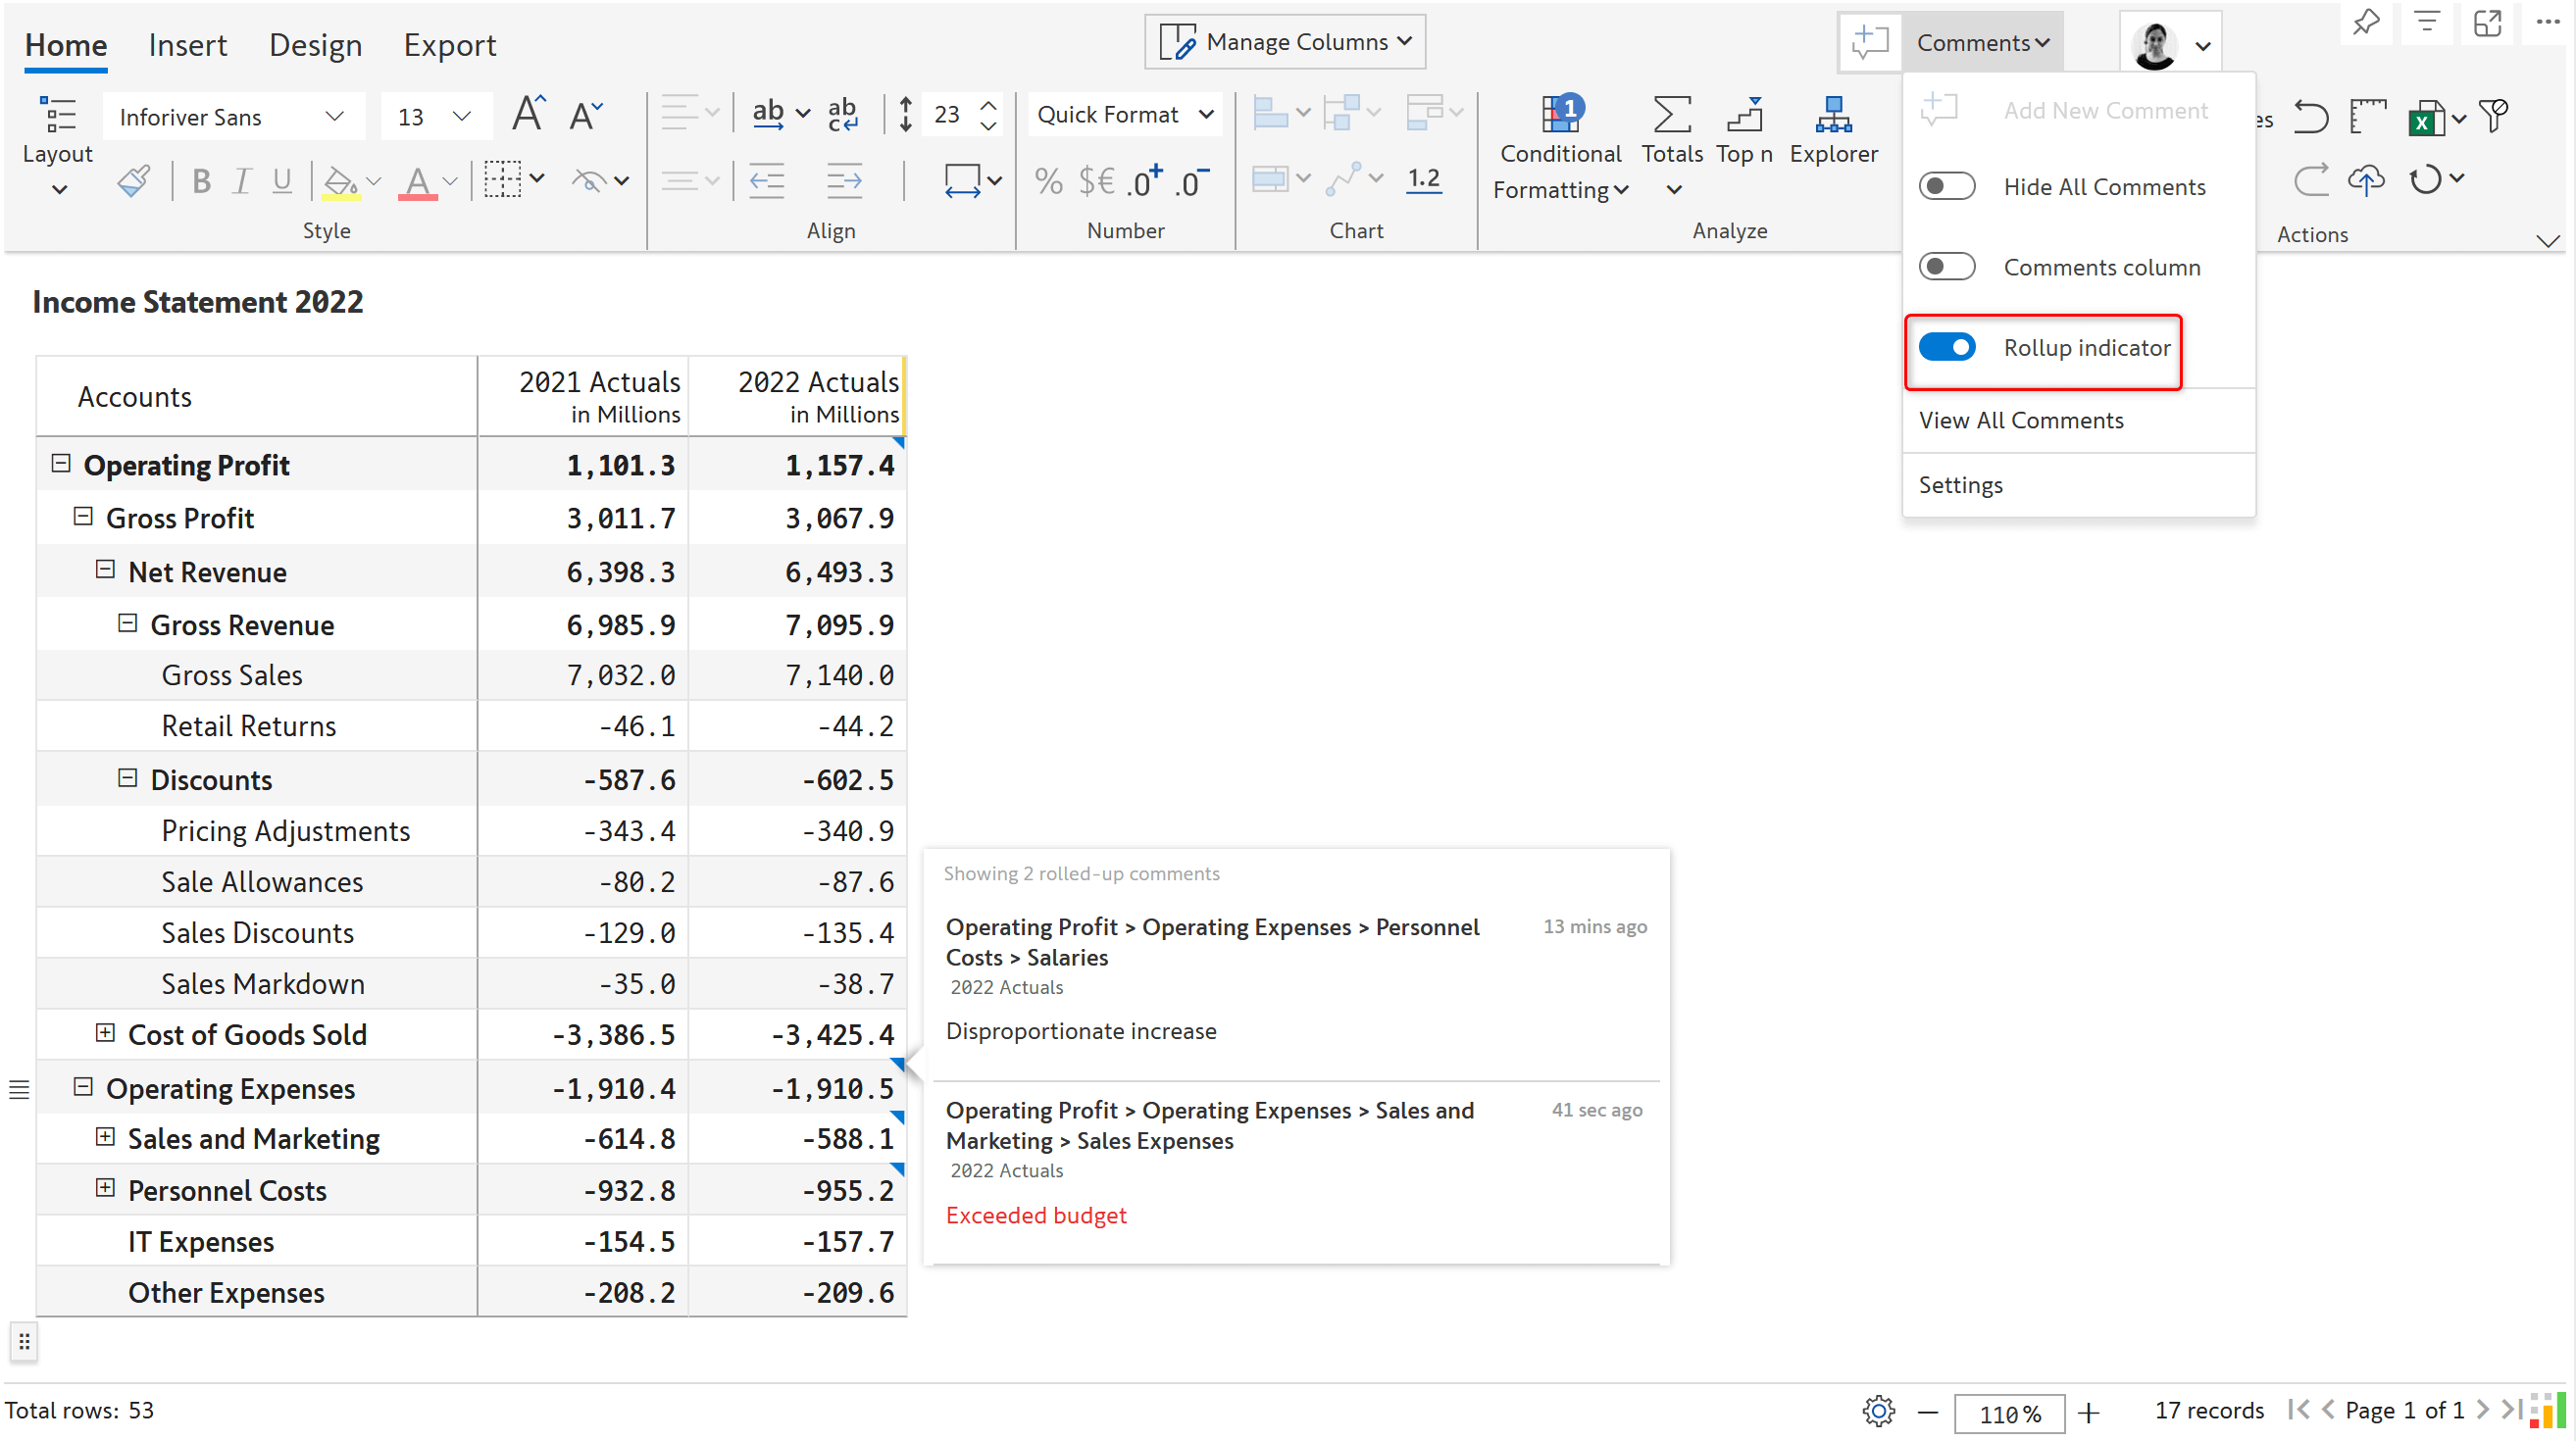
‘Bubble up’ comments to ensure they are not missed even when hierarchies are collapsed.
Assign tasks and track their status within your Power BI report.
Receive instant email notifications when others mention you or assign you tasks. Directly click on the link in the email to access and reply to comments.
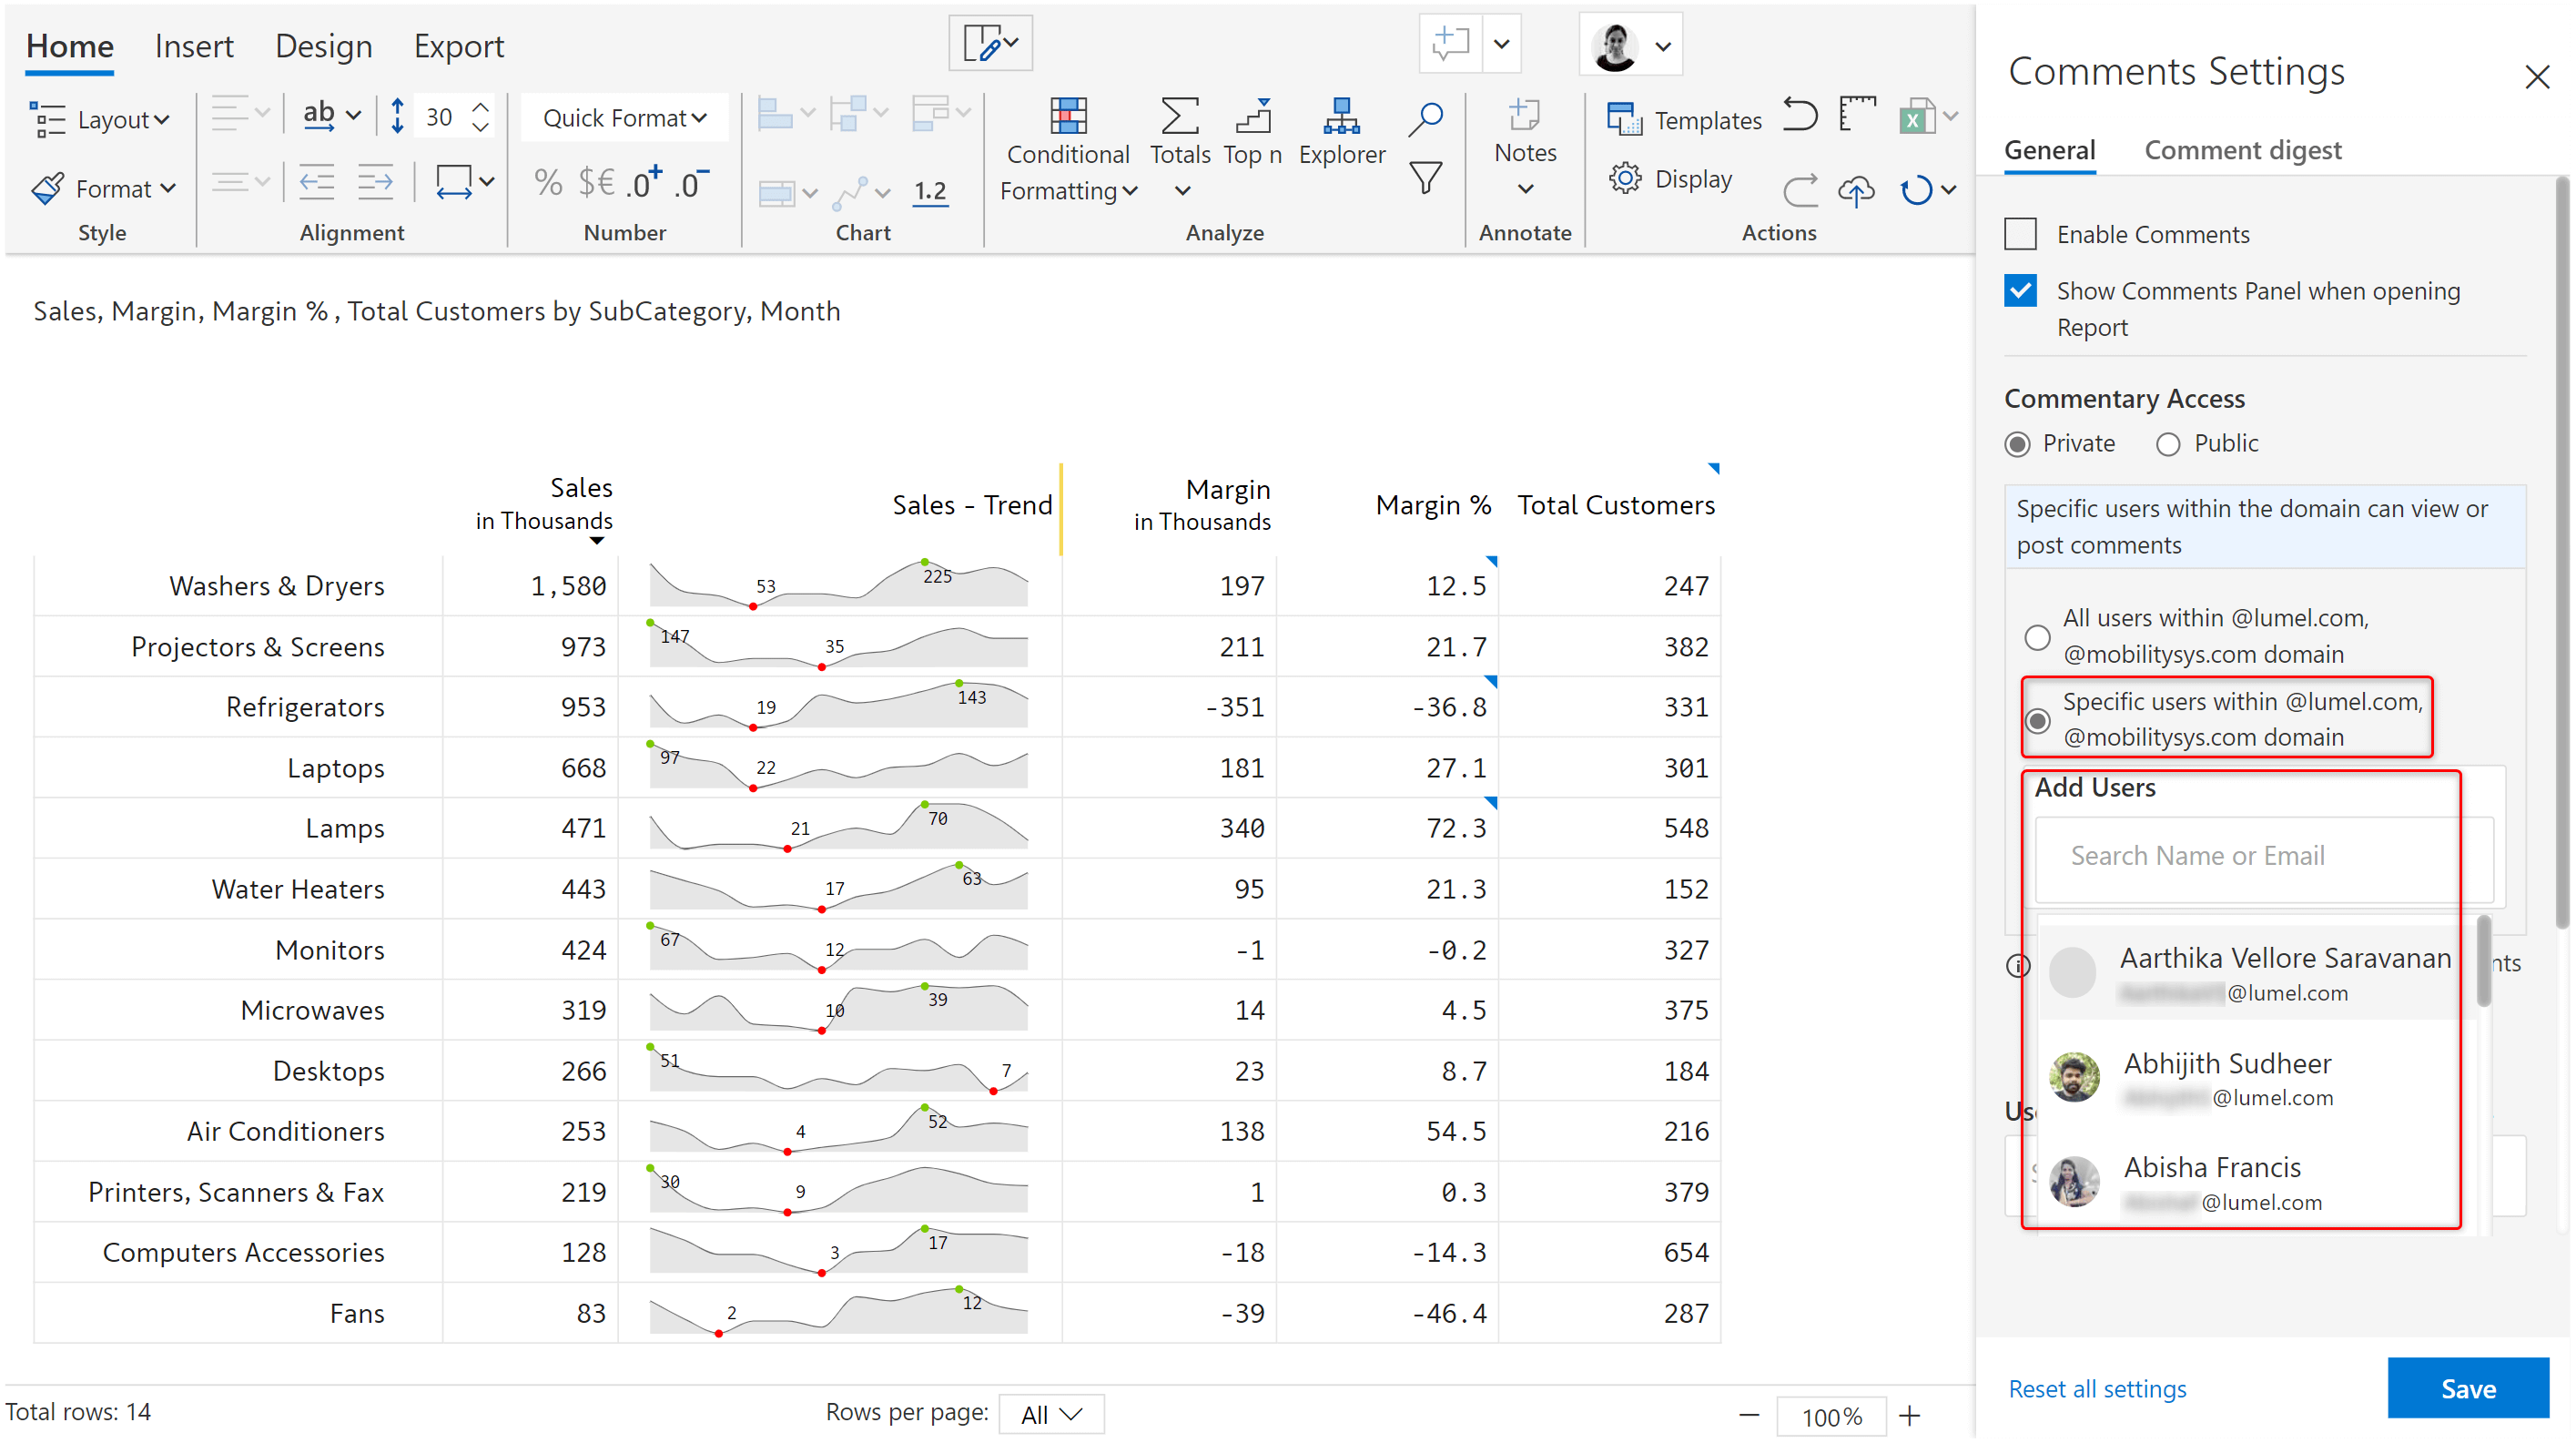
Allow comments to be added by only specific users within the organization.
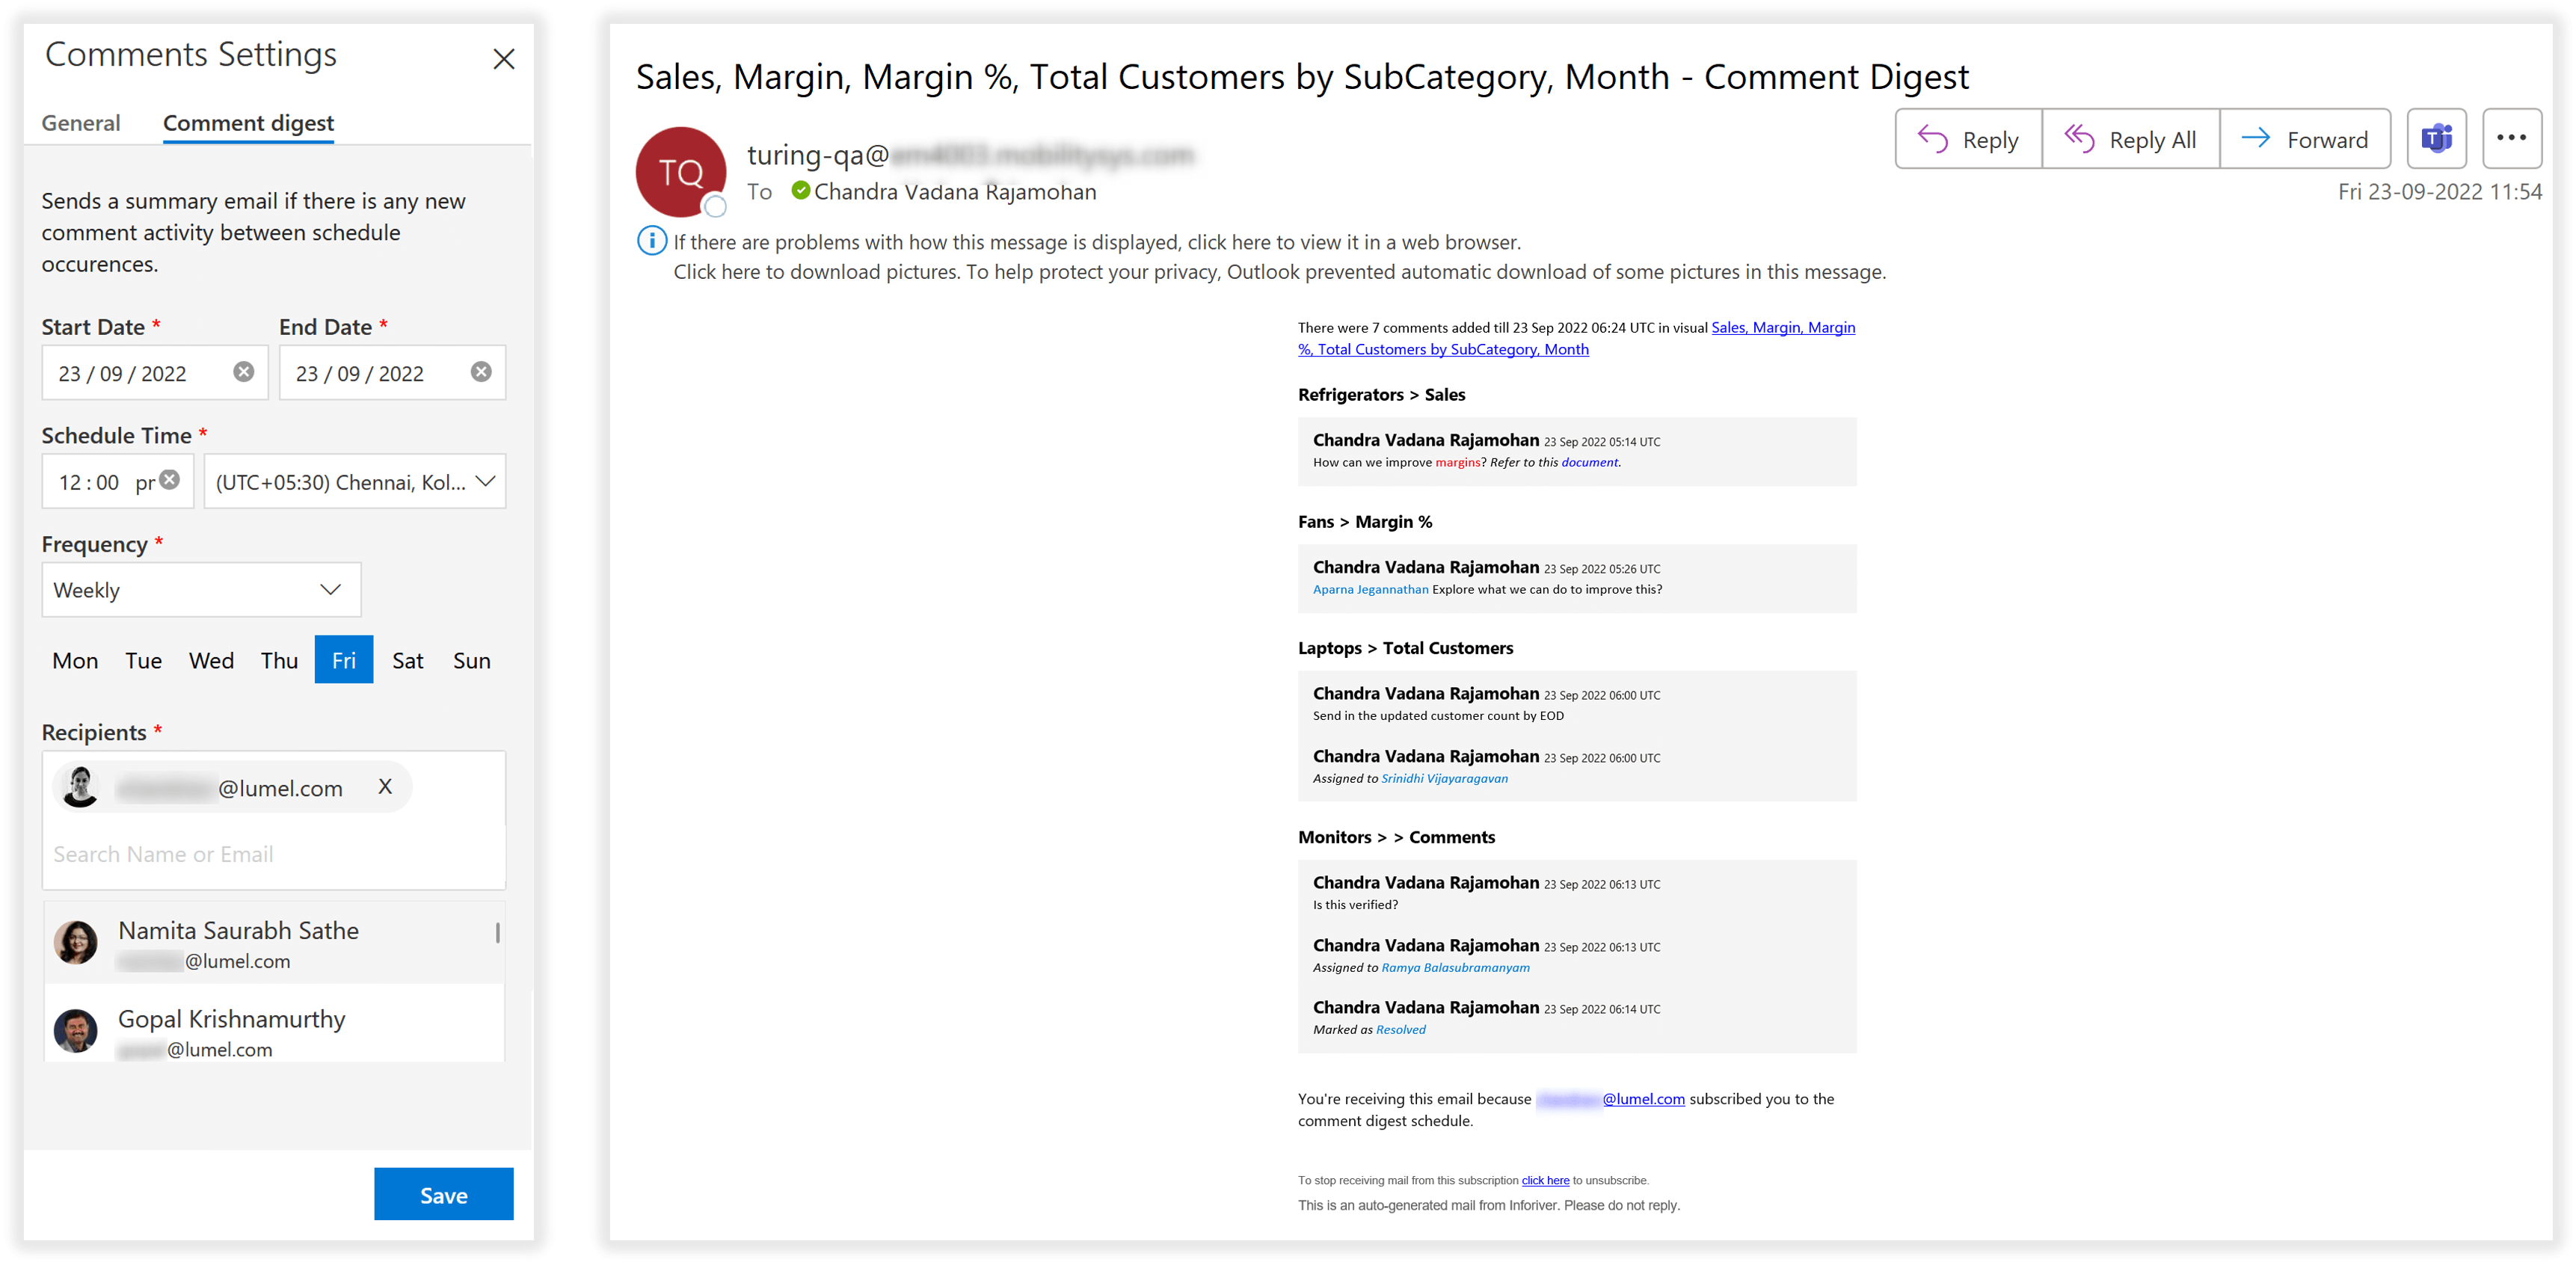
Schedule periodic commentary digests to notify users of conversations, tasks, and exceptions. Schedule digests with flexible frequency options without writing any code.
Track WHO commented on a specific data point and WHEN using an interactive, filterable, and comment-enabled audit log.
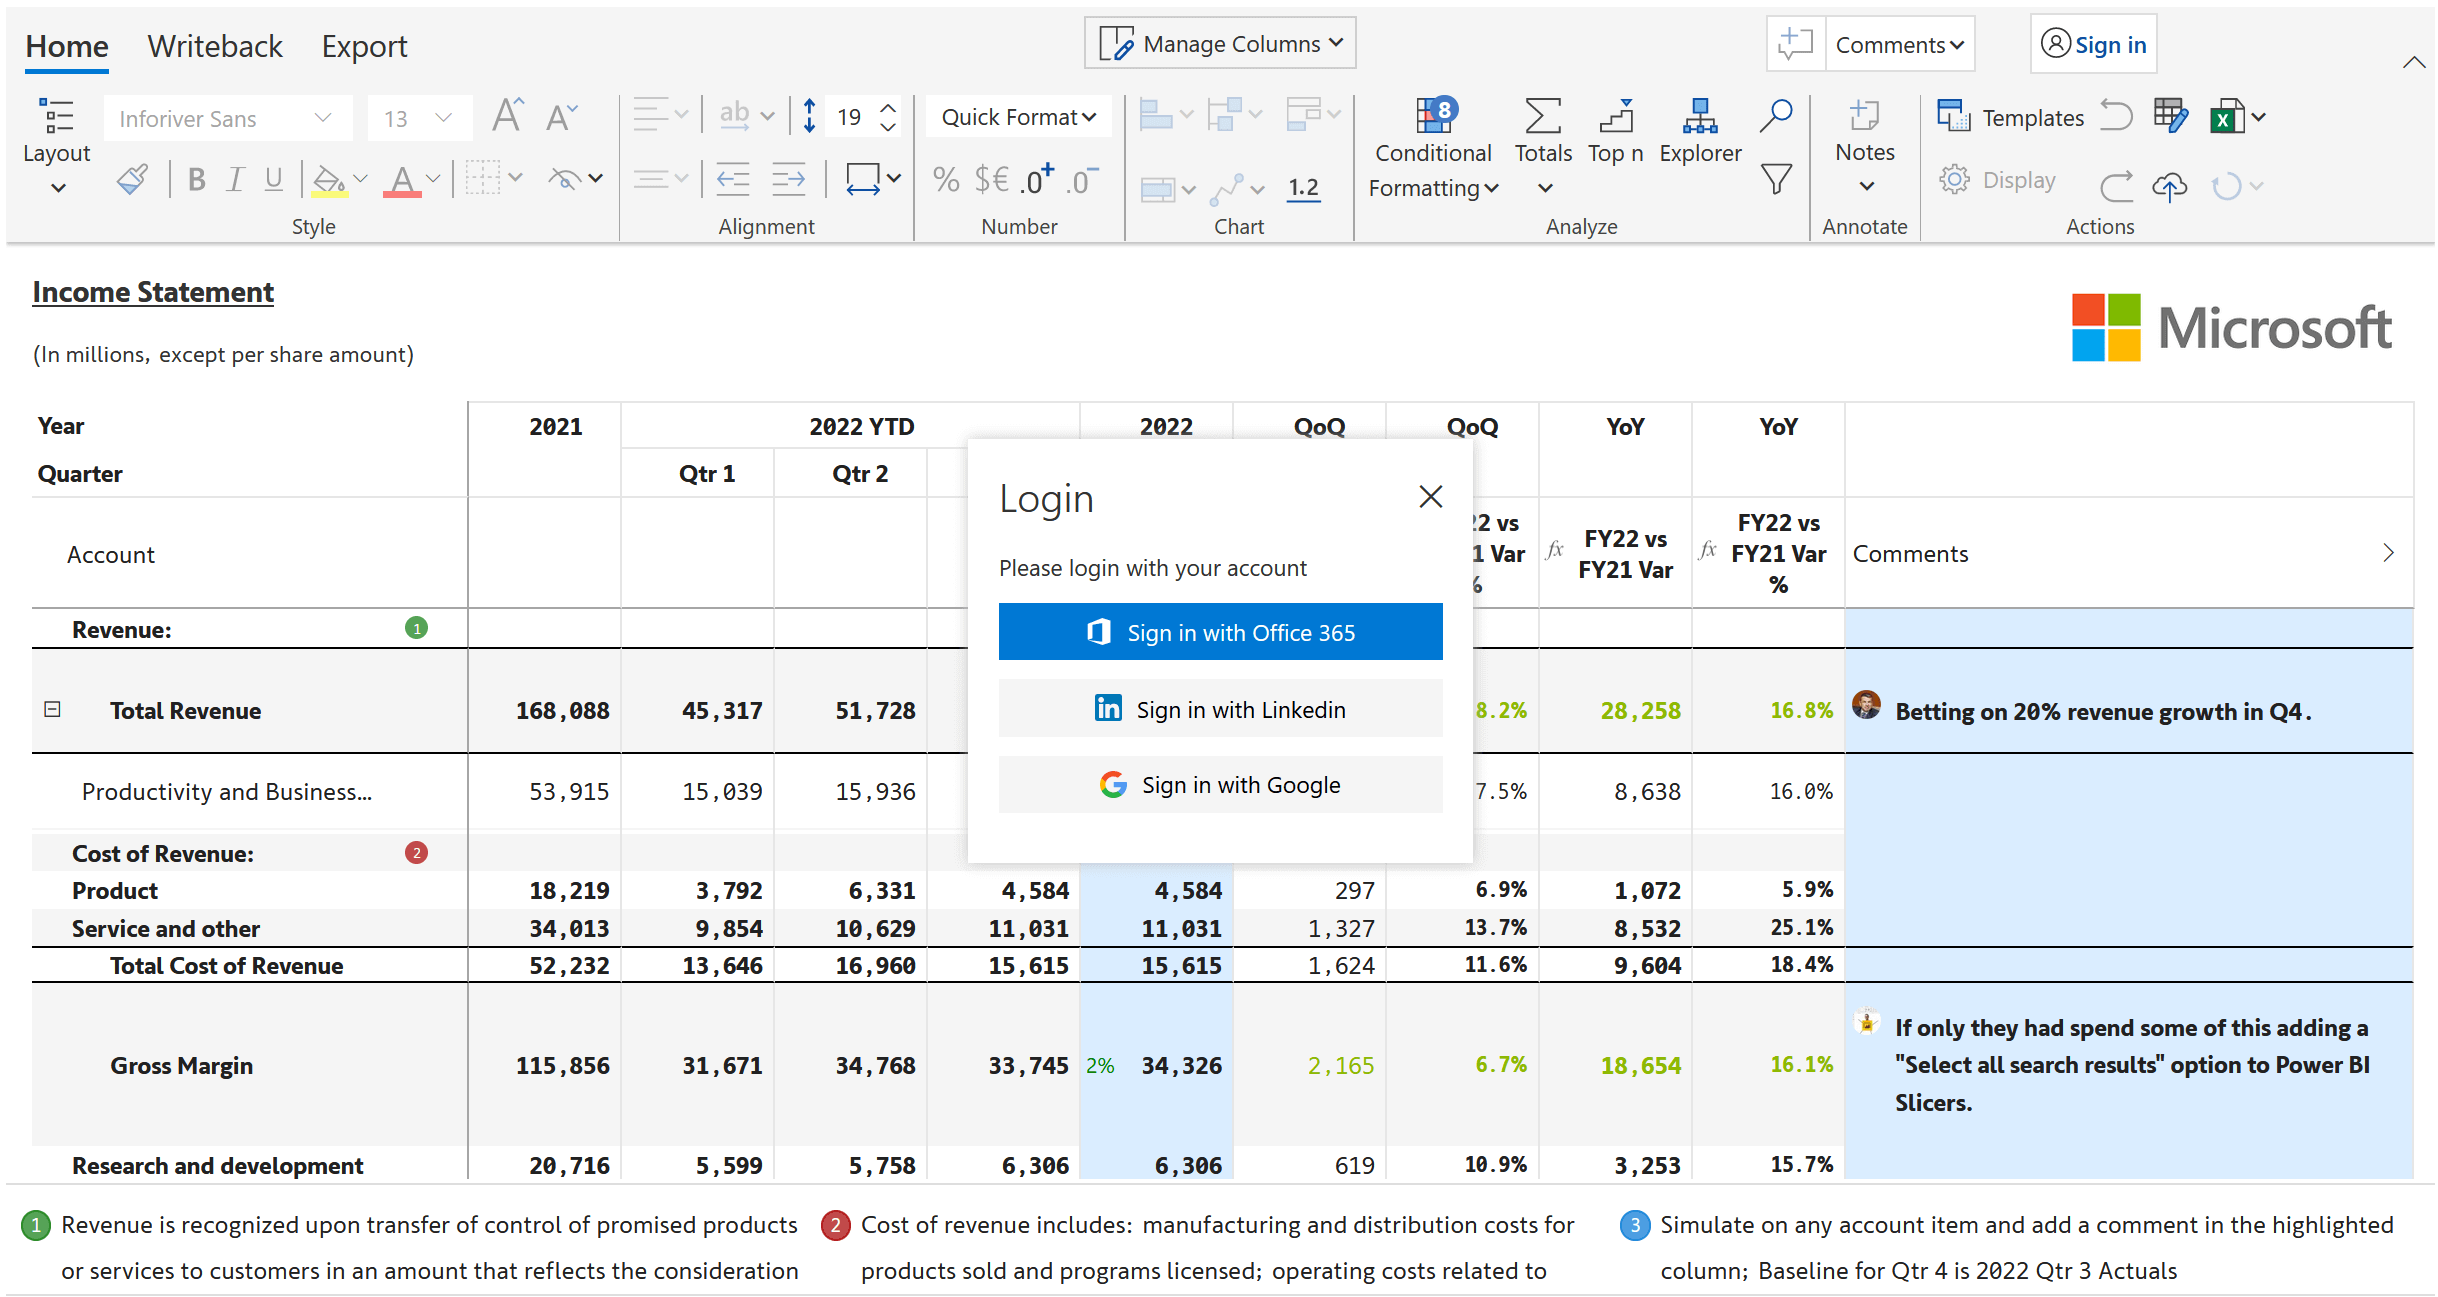
Embed your report on a web page and allow external users to log in using their LinkedIn/Google accounts and post collaborative comments.
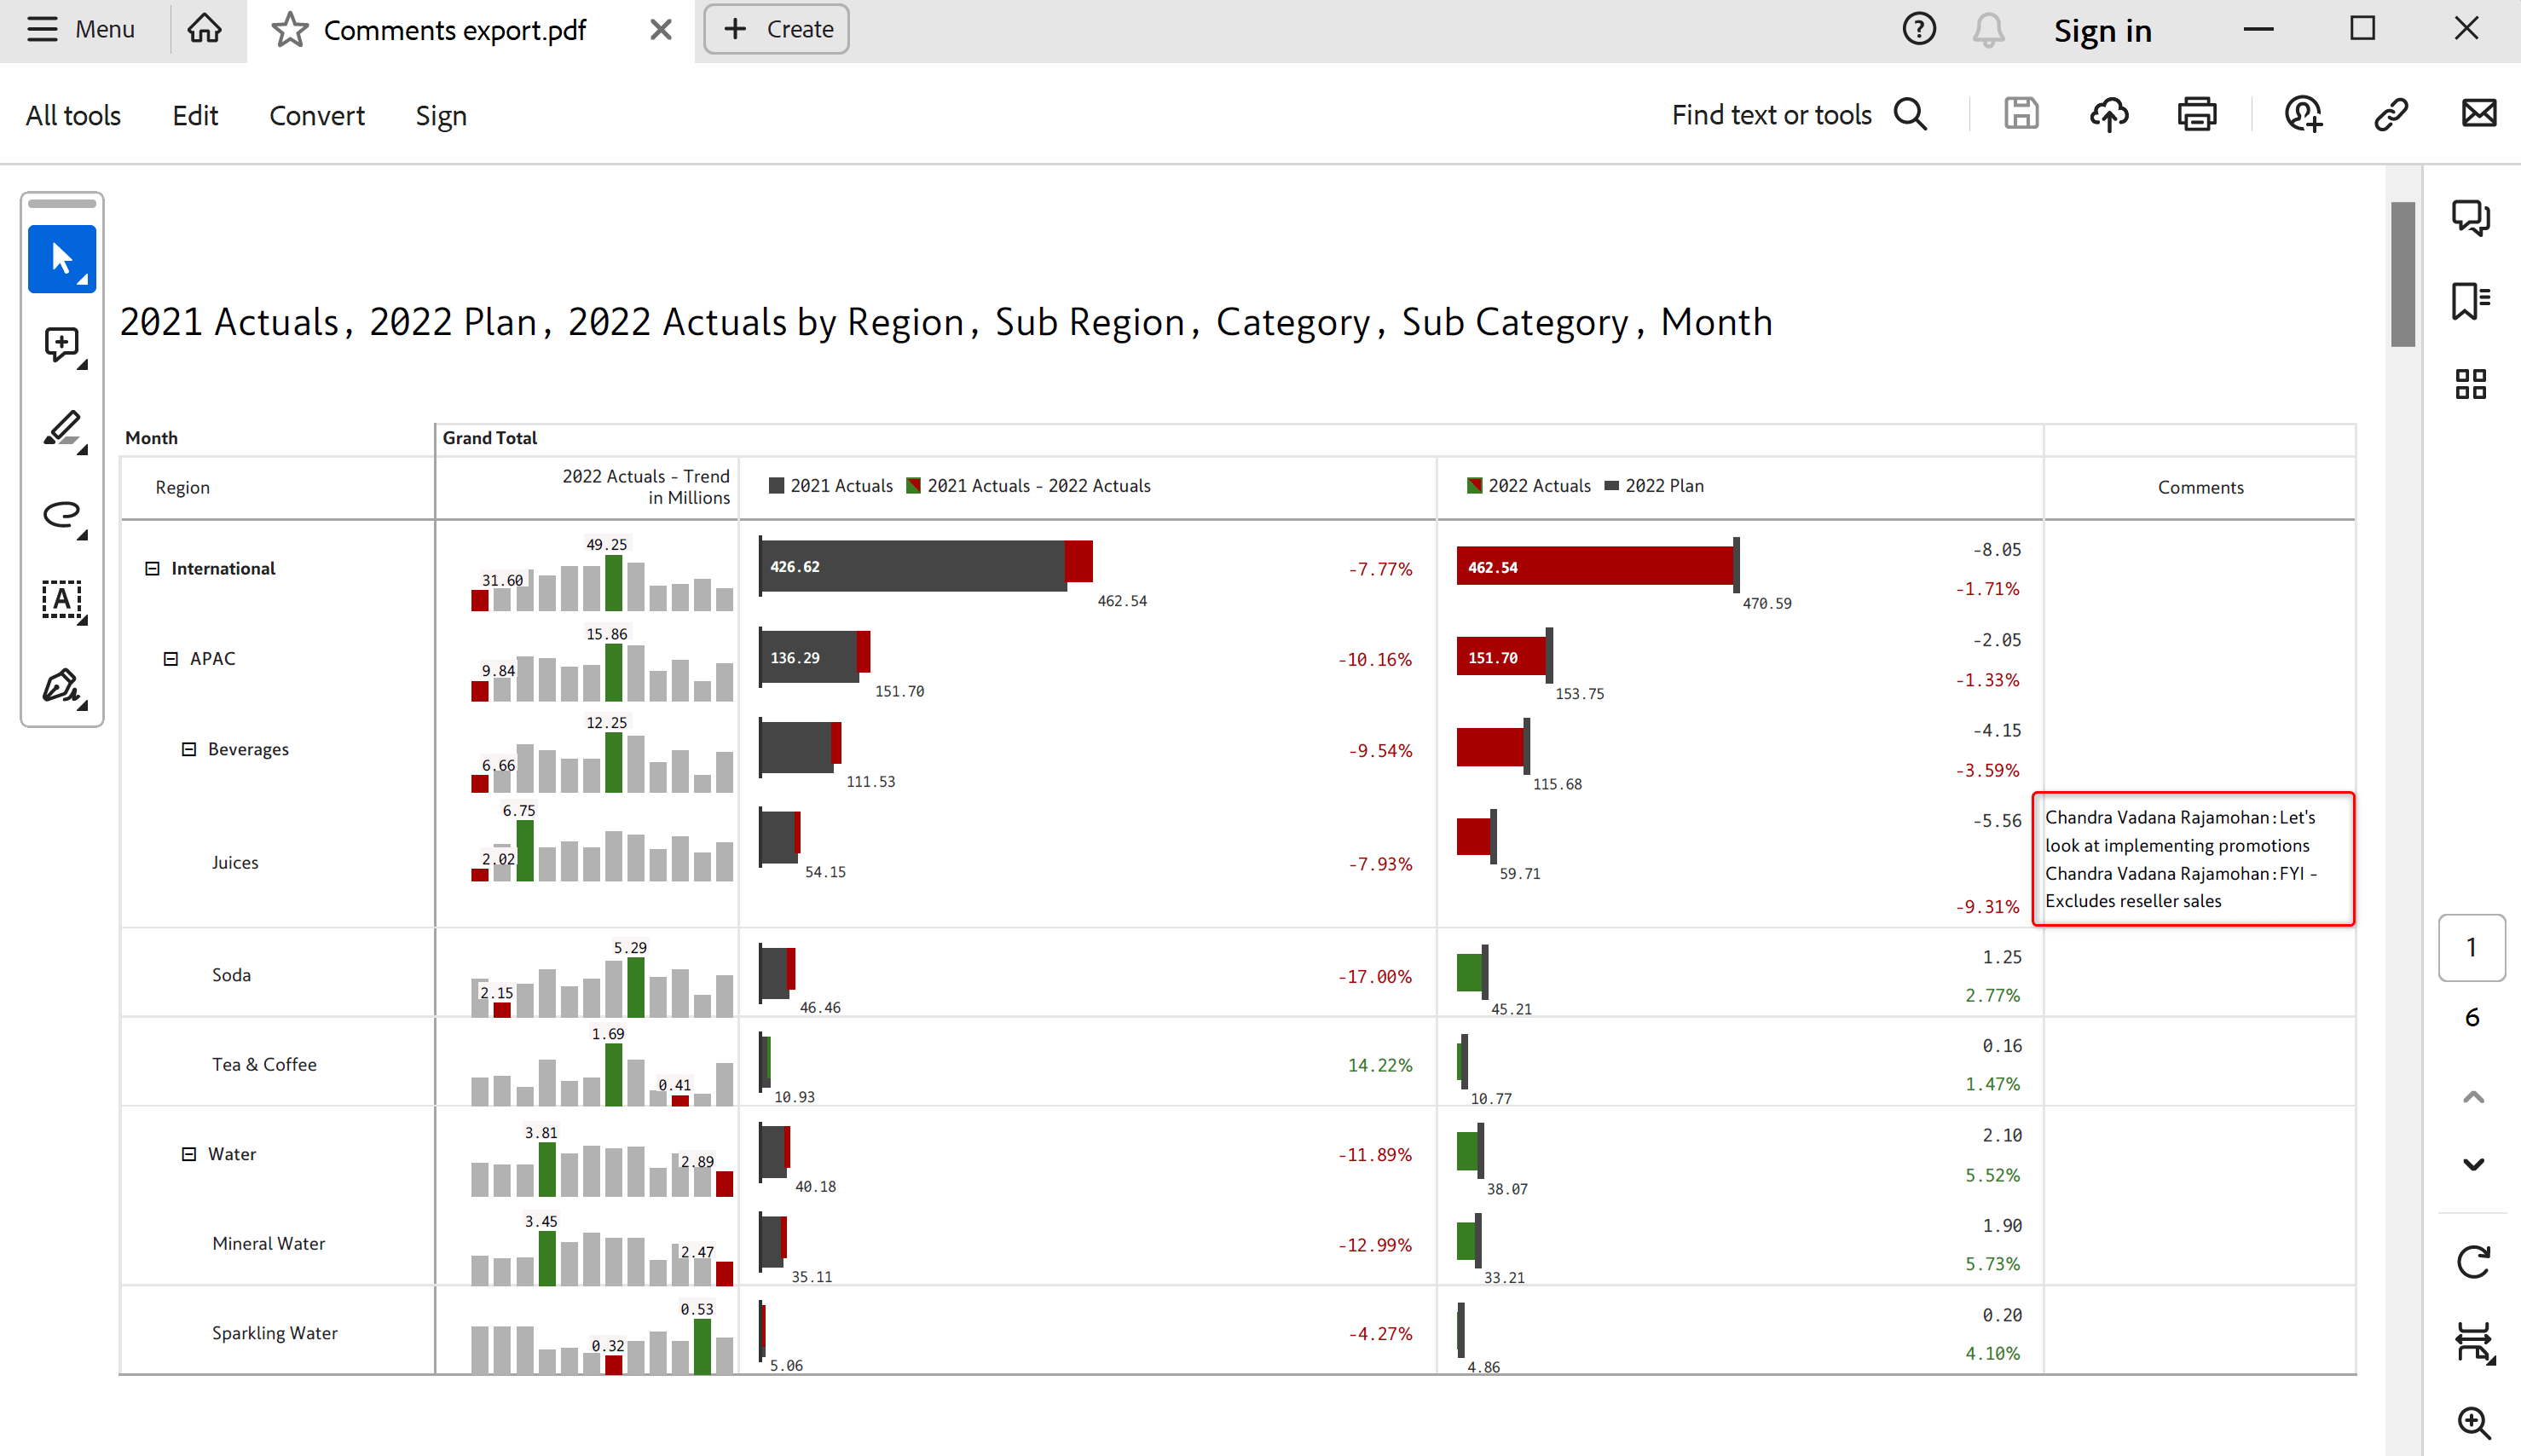
Export comments along with replies as part of the Excel and PDF files.
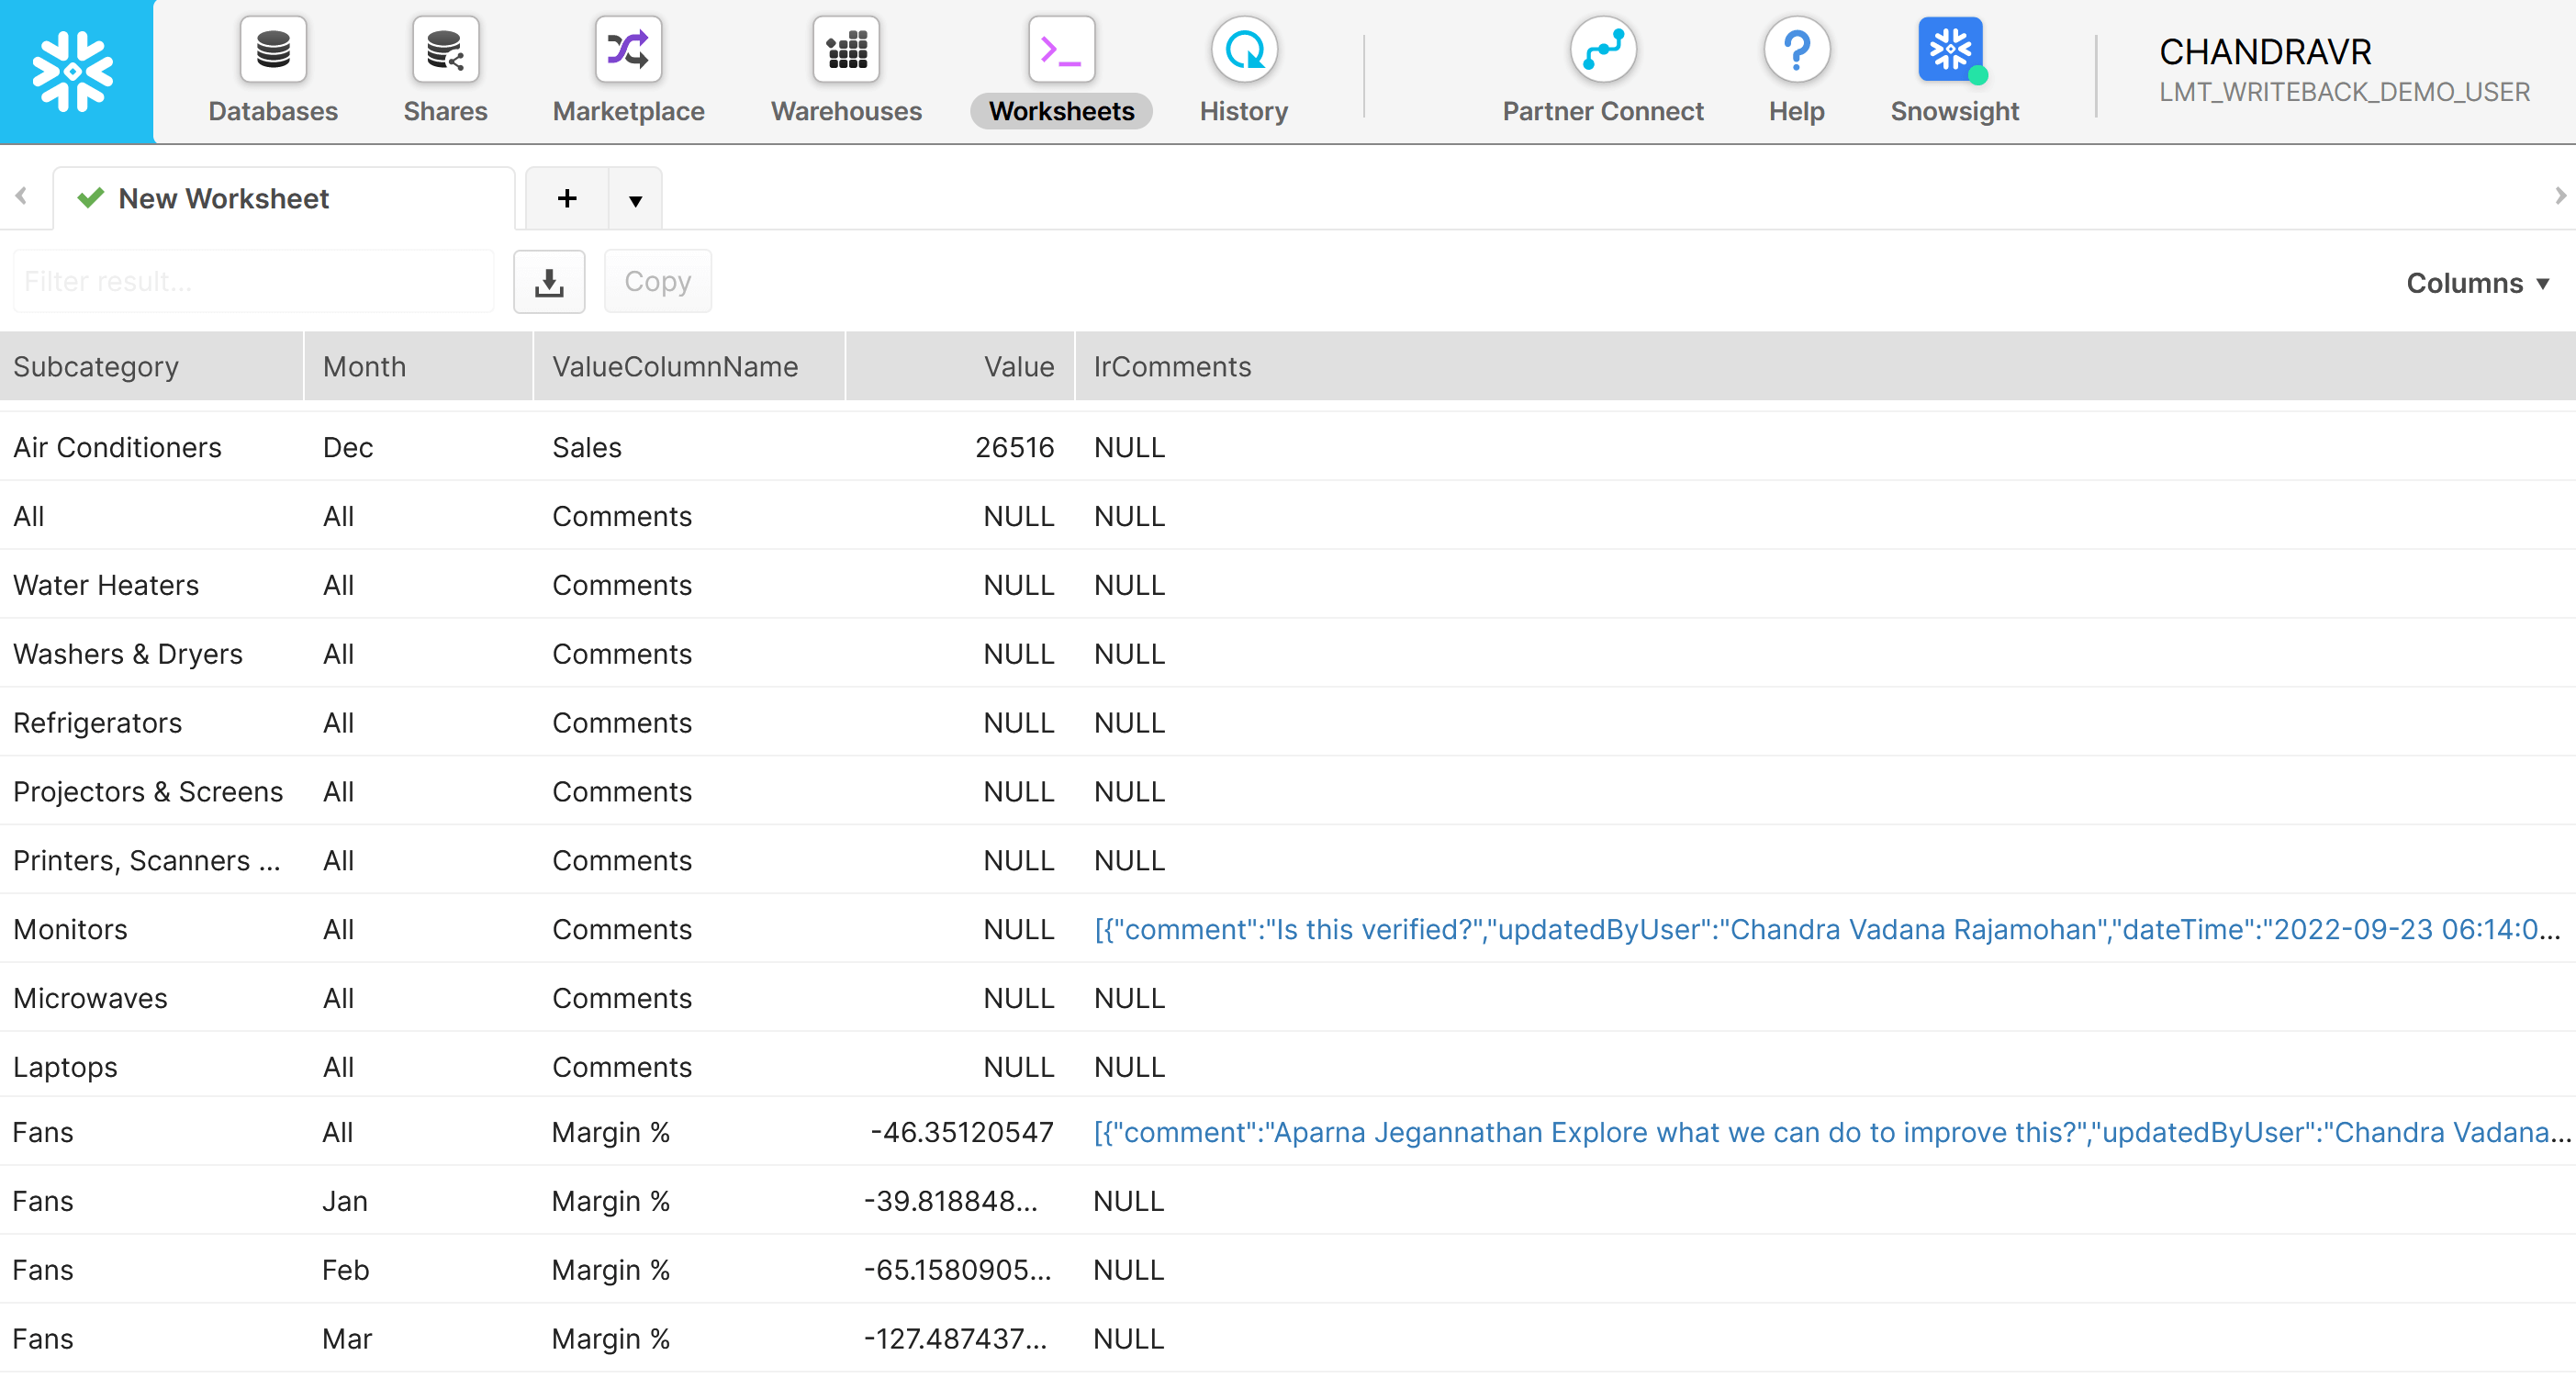
Write back comments to databases, shared drives, and URL destinations, along with the filter context. Destinations supported include Microsoft Fabric Datawarehouse, Lakehouse, Dataverse, Snowflake, OneDrive, SharePoint, and more.
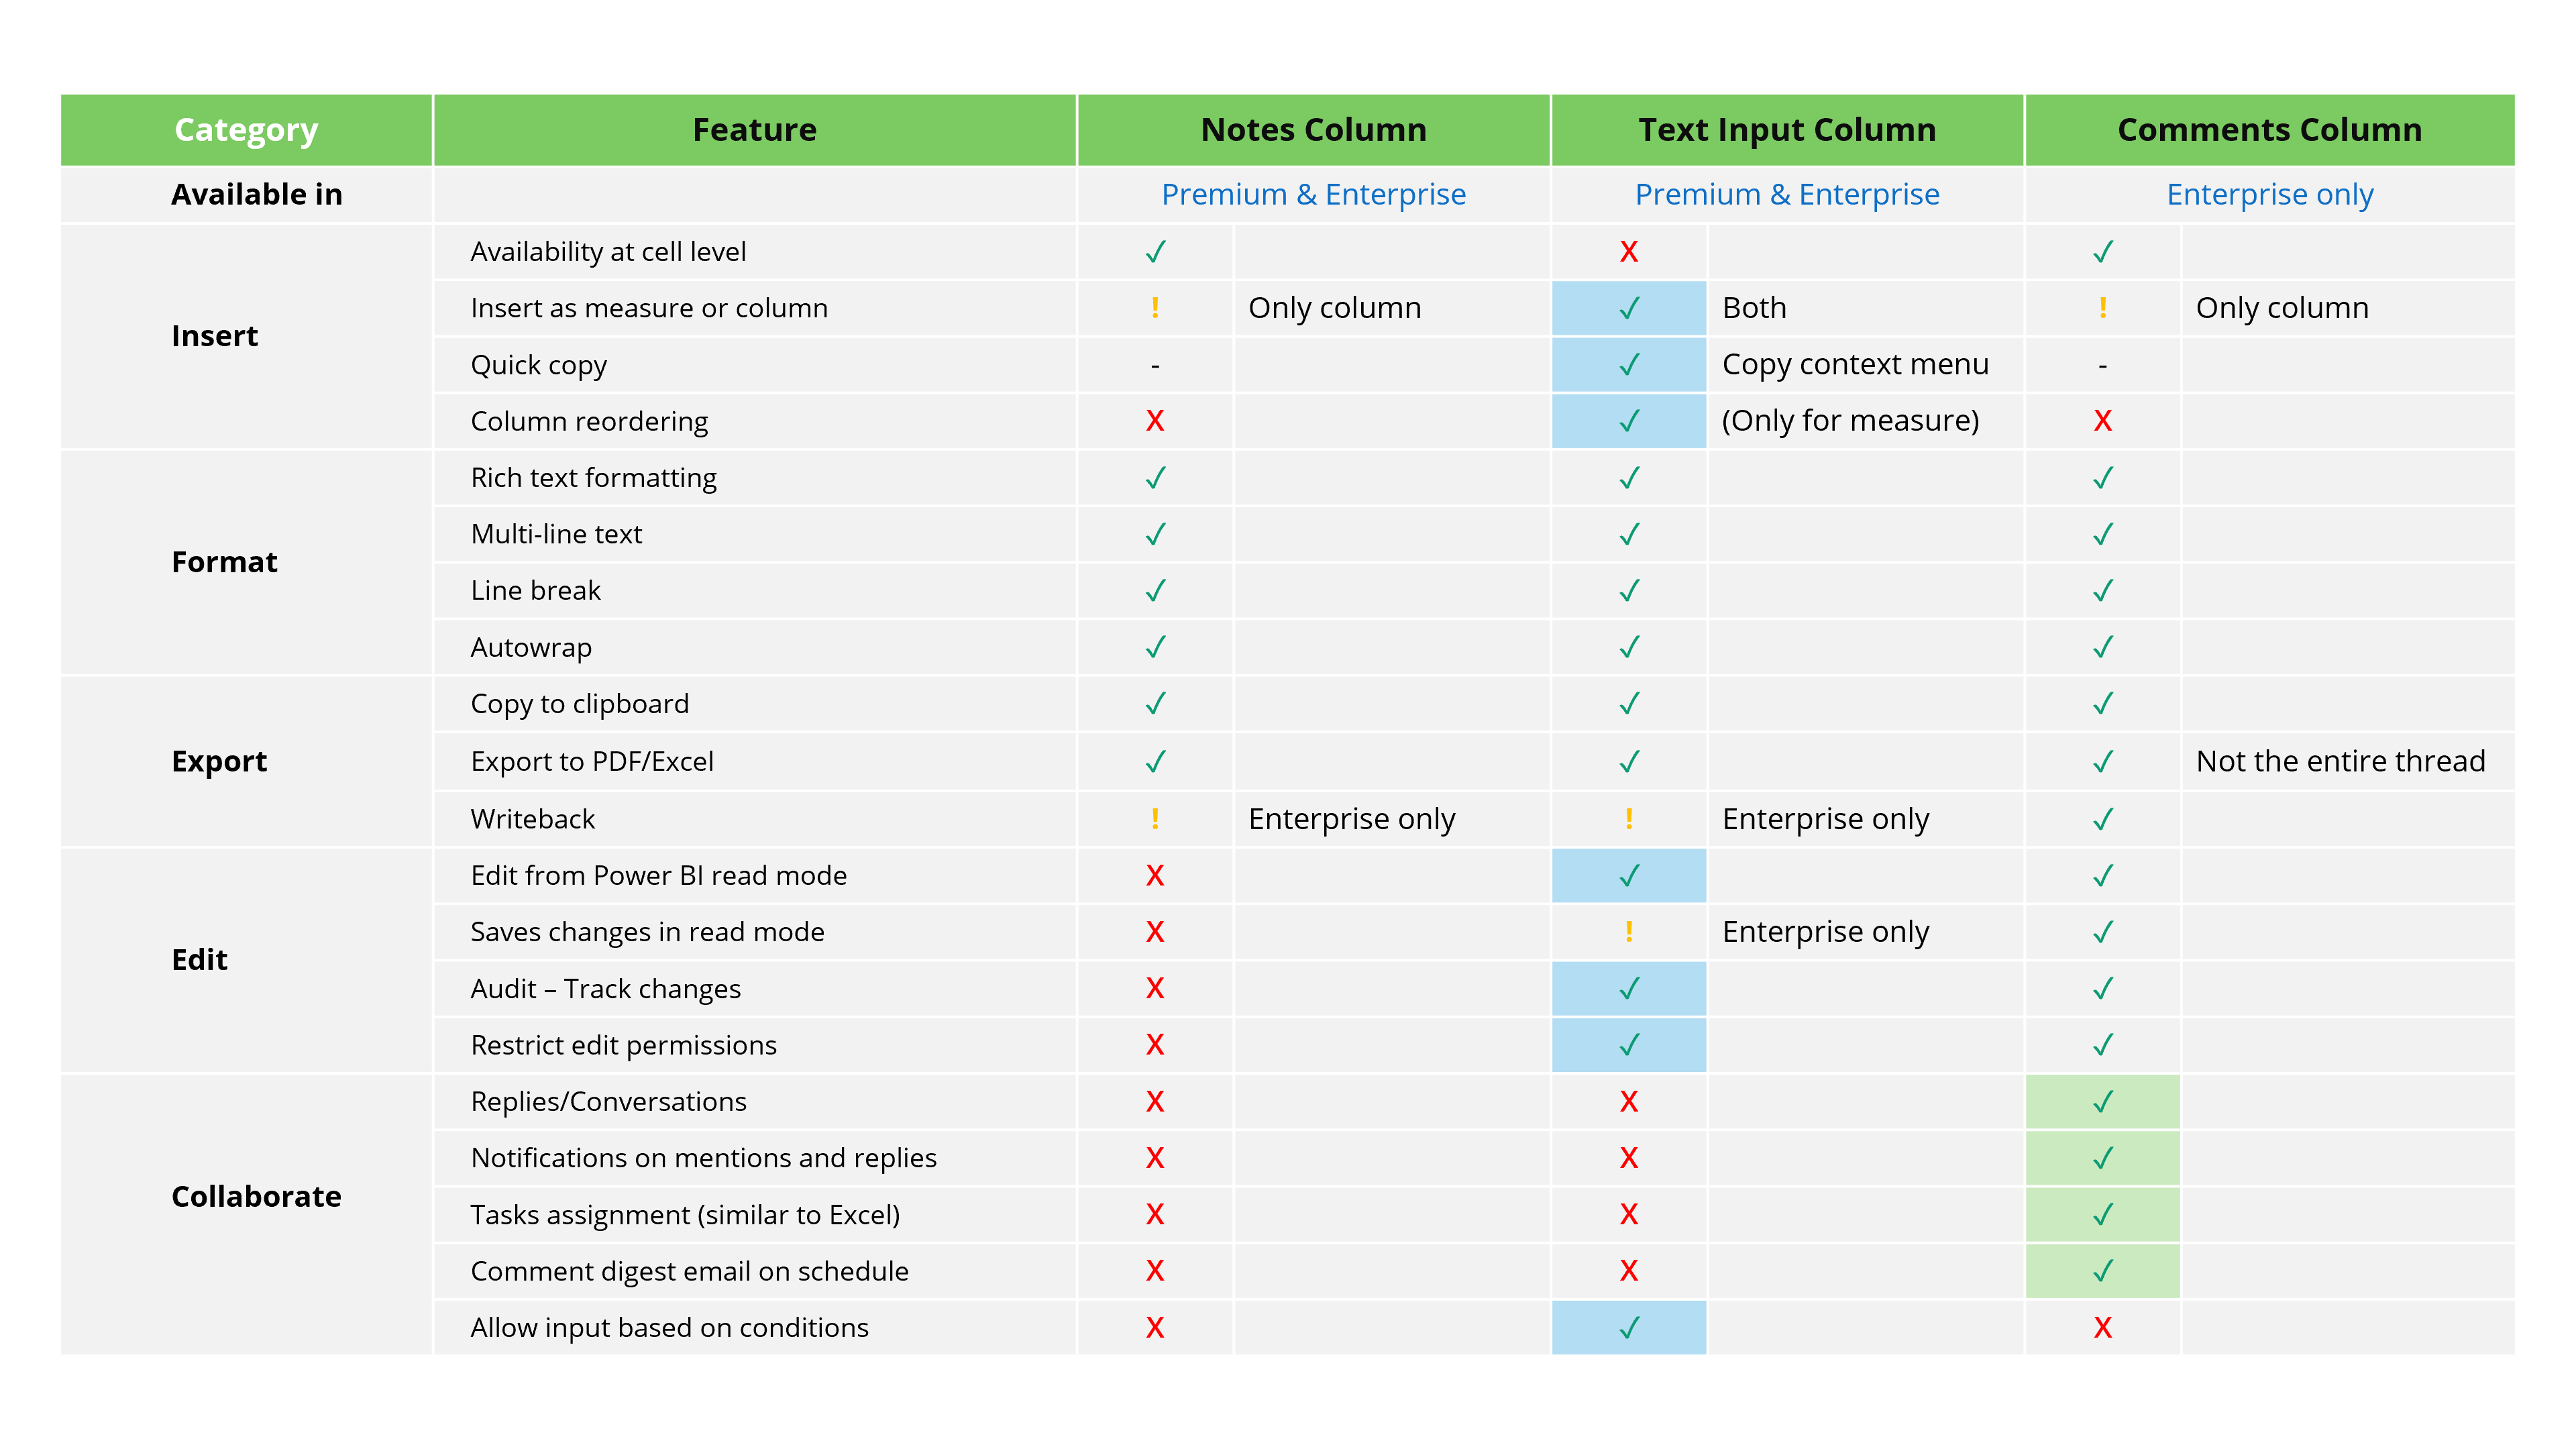
You can capture user text in your report in three ways using Inforiver: a dedicated notes column, a text input column, or a comments column.
A text input column is preferable in the following cases:
A detailed comparison of the three types of columns is shown below.

Discover how Inforiver Analytics+ enhances Power BI with its 3-in-1 visual, for dashboards & storyboards offering 50+ charts, cards, and tables, filling gaps […]
The capabilities listed here are available in Inforiver Analytics+.
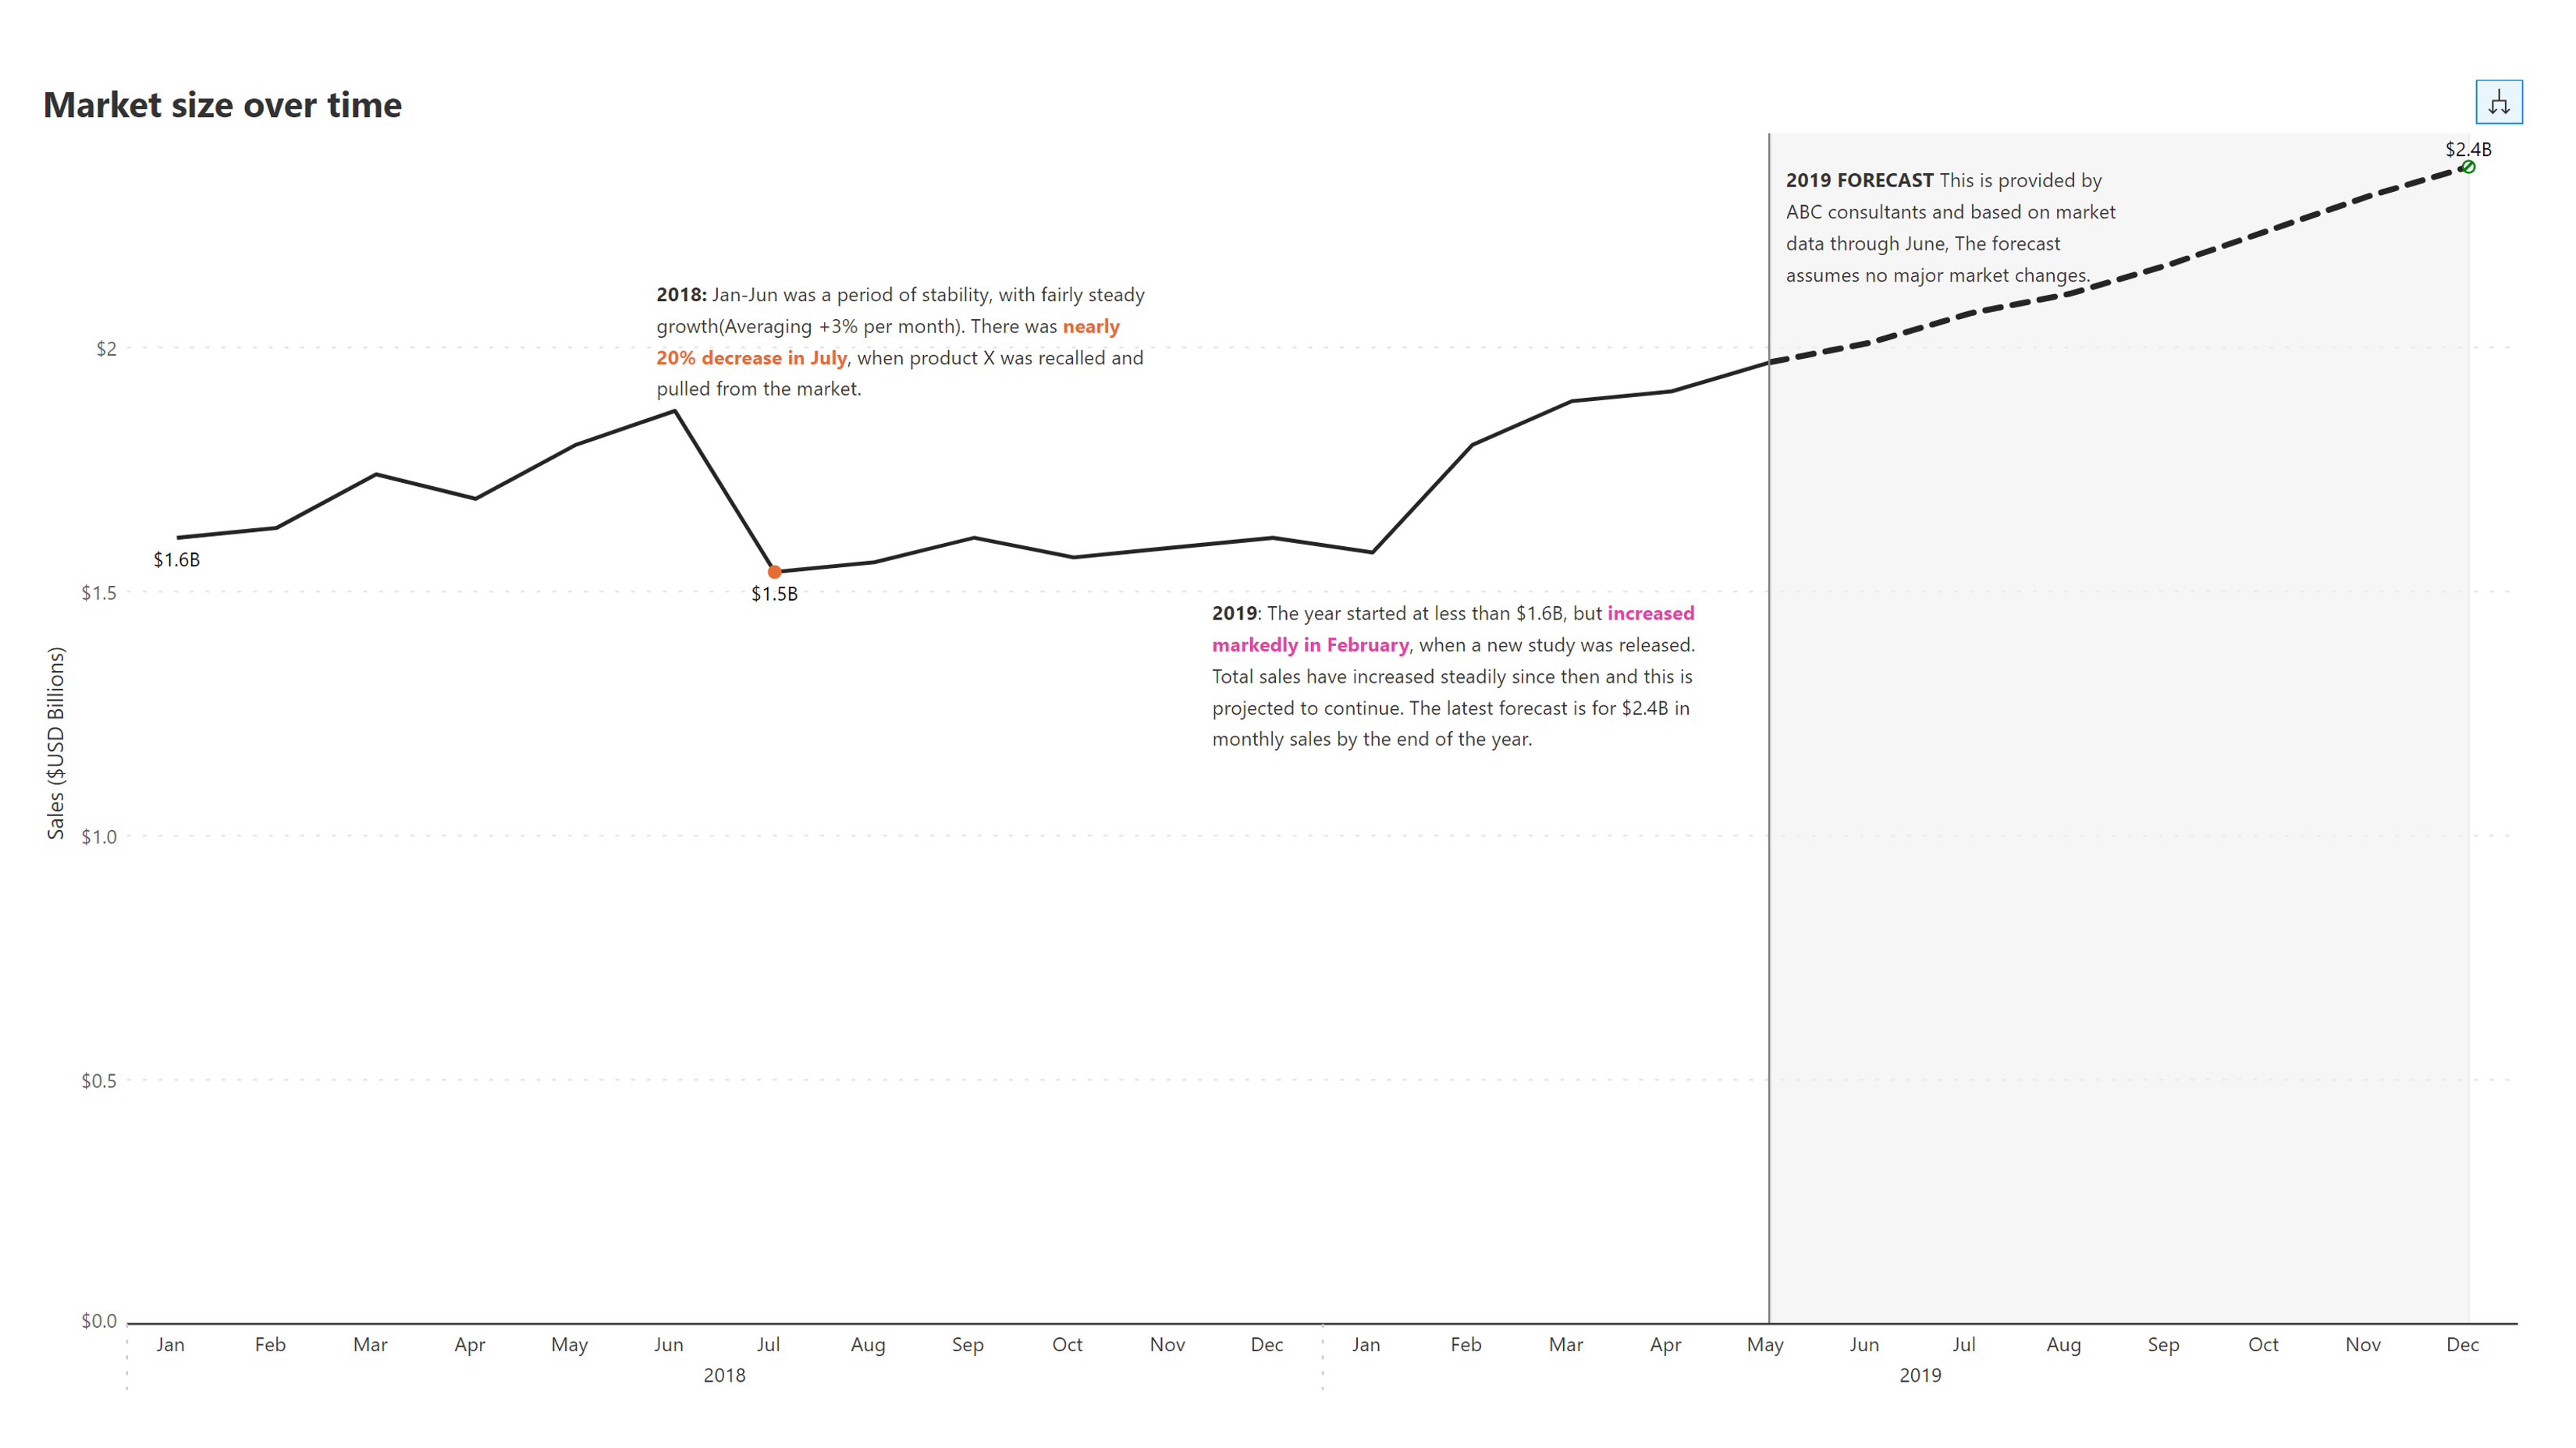
Add filter context-aware, flexible, and dynamic canvas and data-point annotations. Use rich-text formatting and drive attention to critical insights.
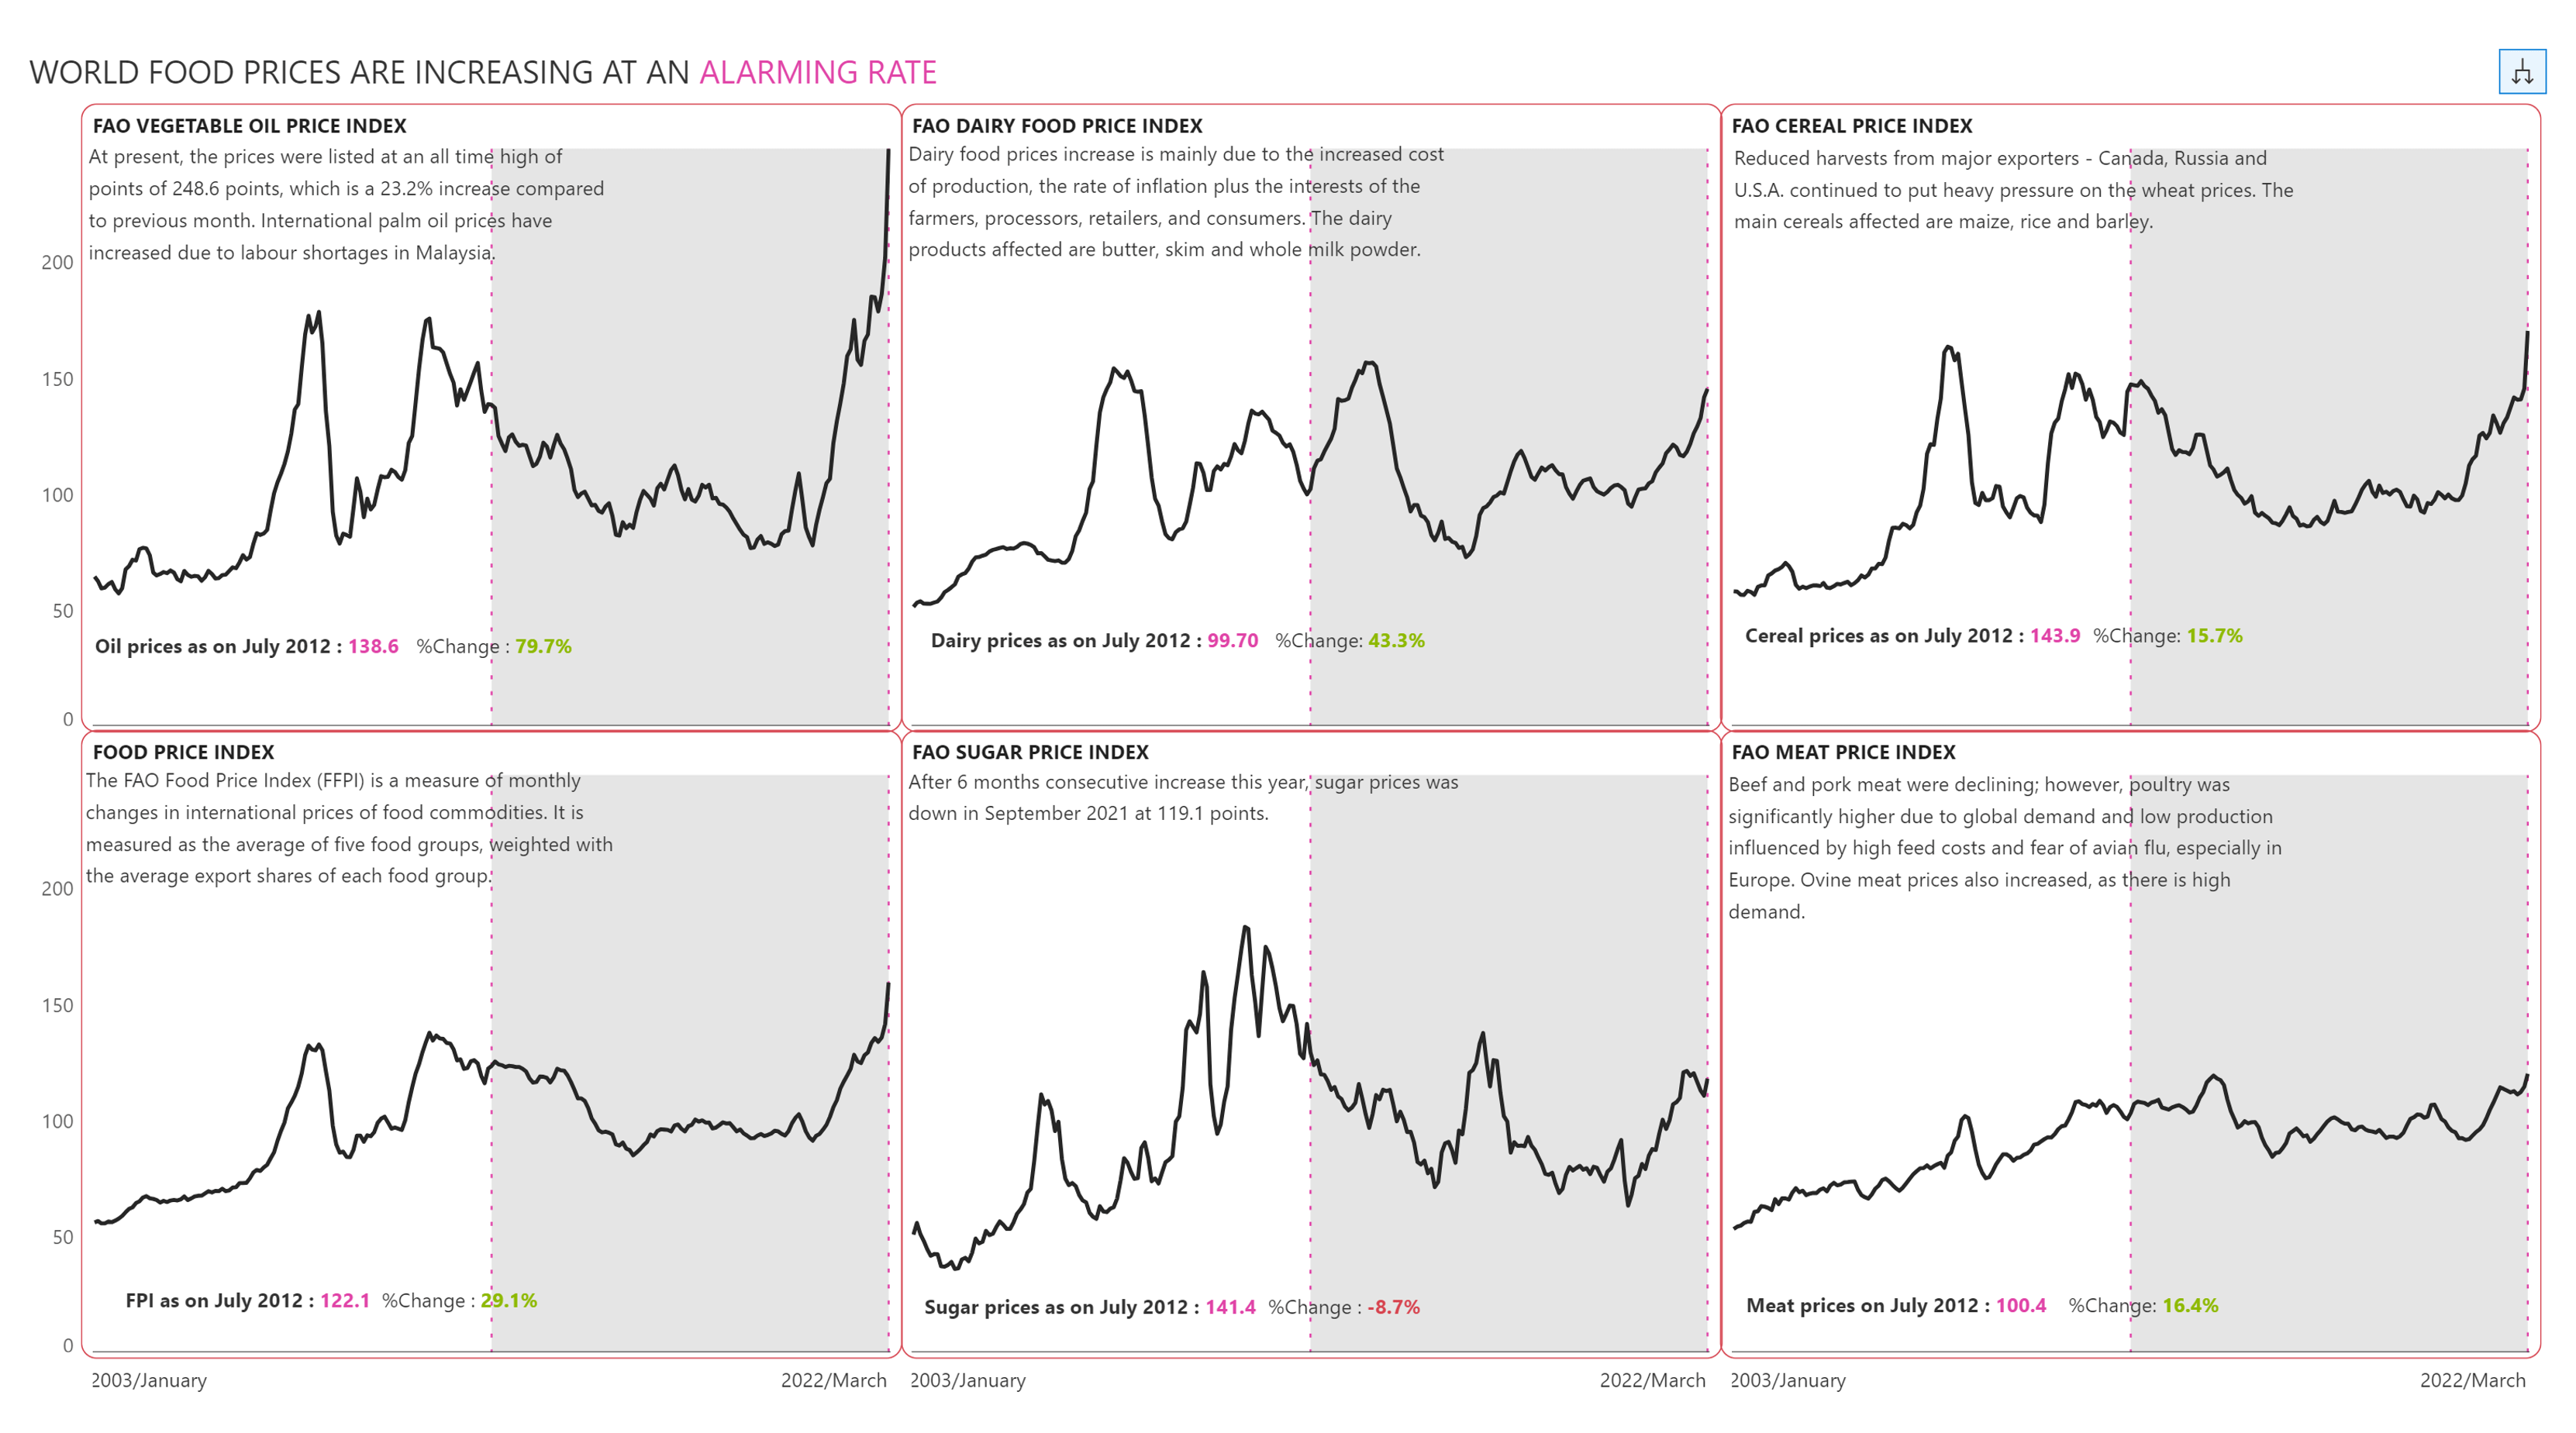
Add annotations to individual panels in a small multiple chart. Resize and position the annotation editor easily using a click-and-drag interface.
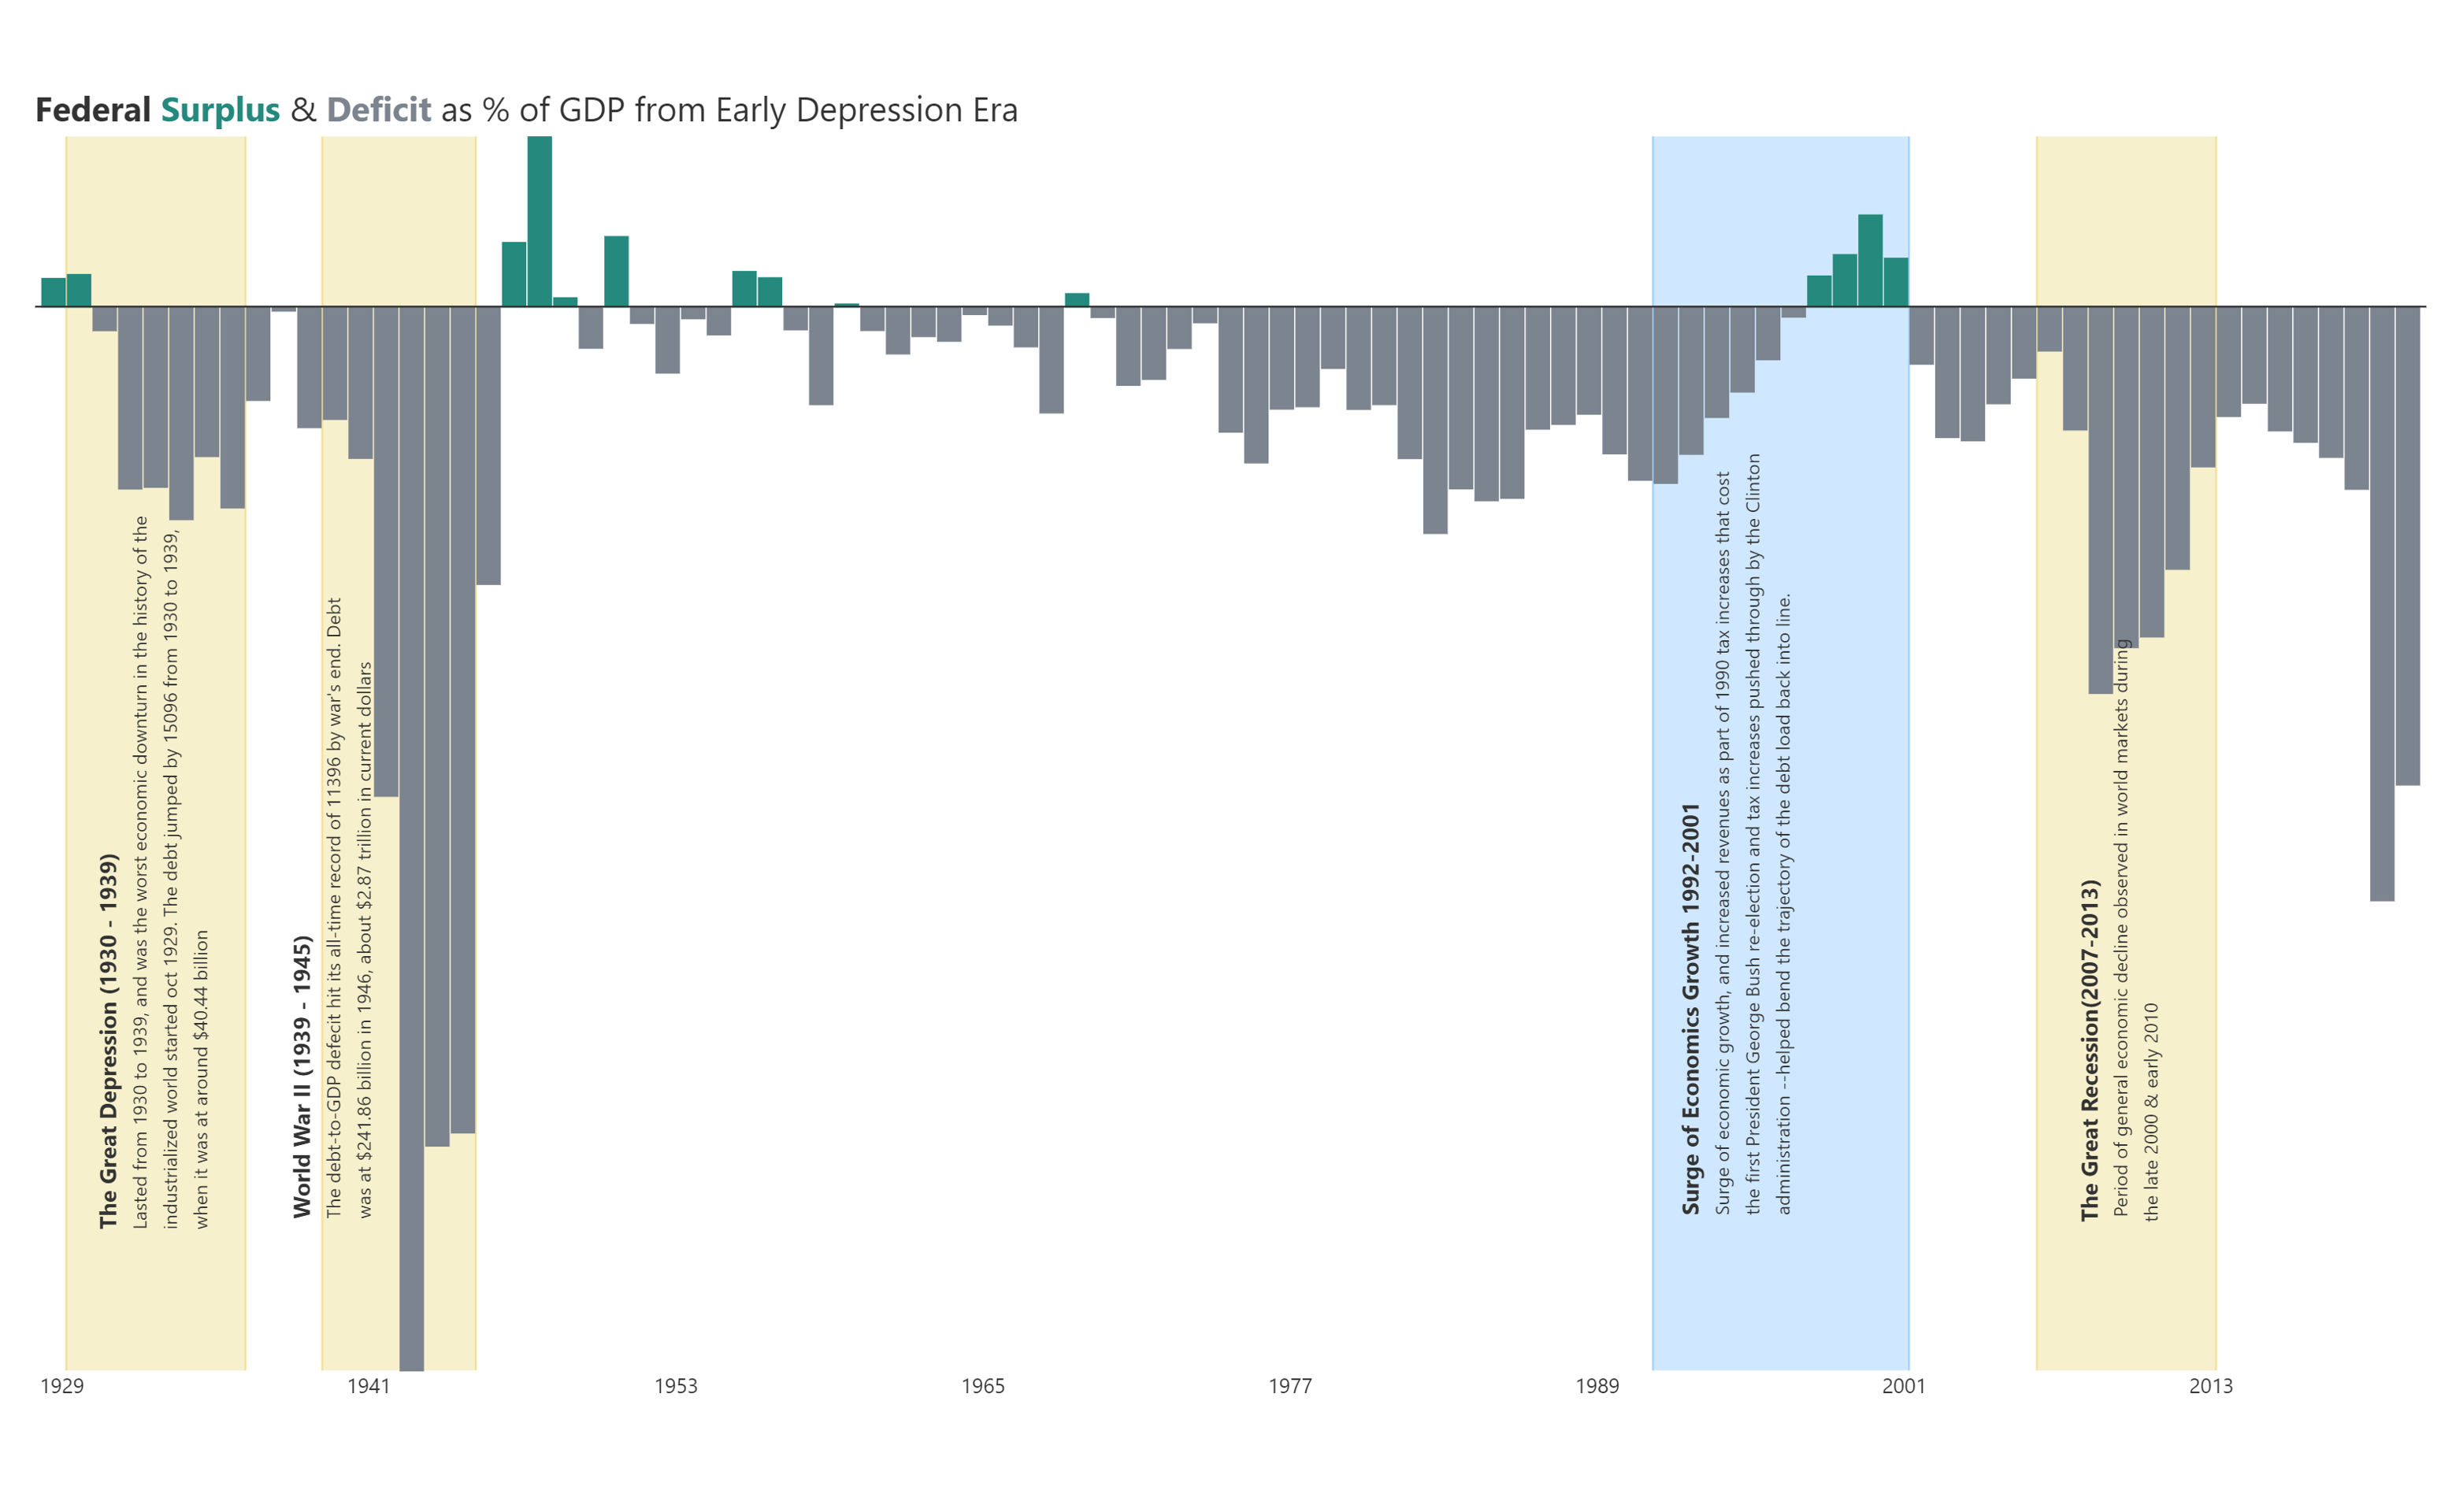
Use reference bands or lines to implement vertical annotations for your visuals that get adjusted dynamically when the reference value changes.
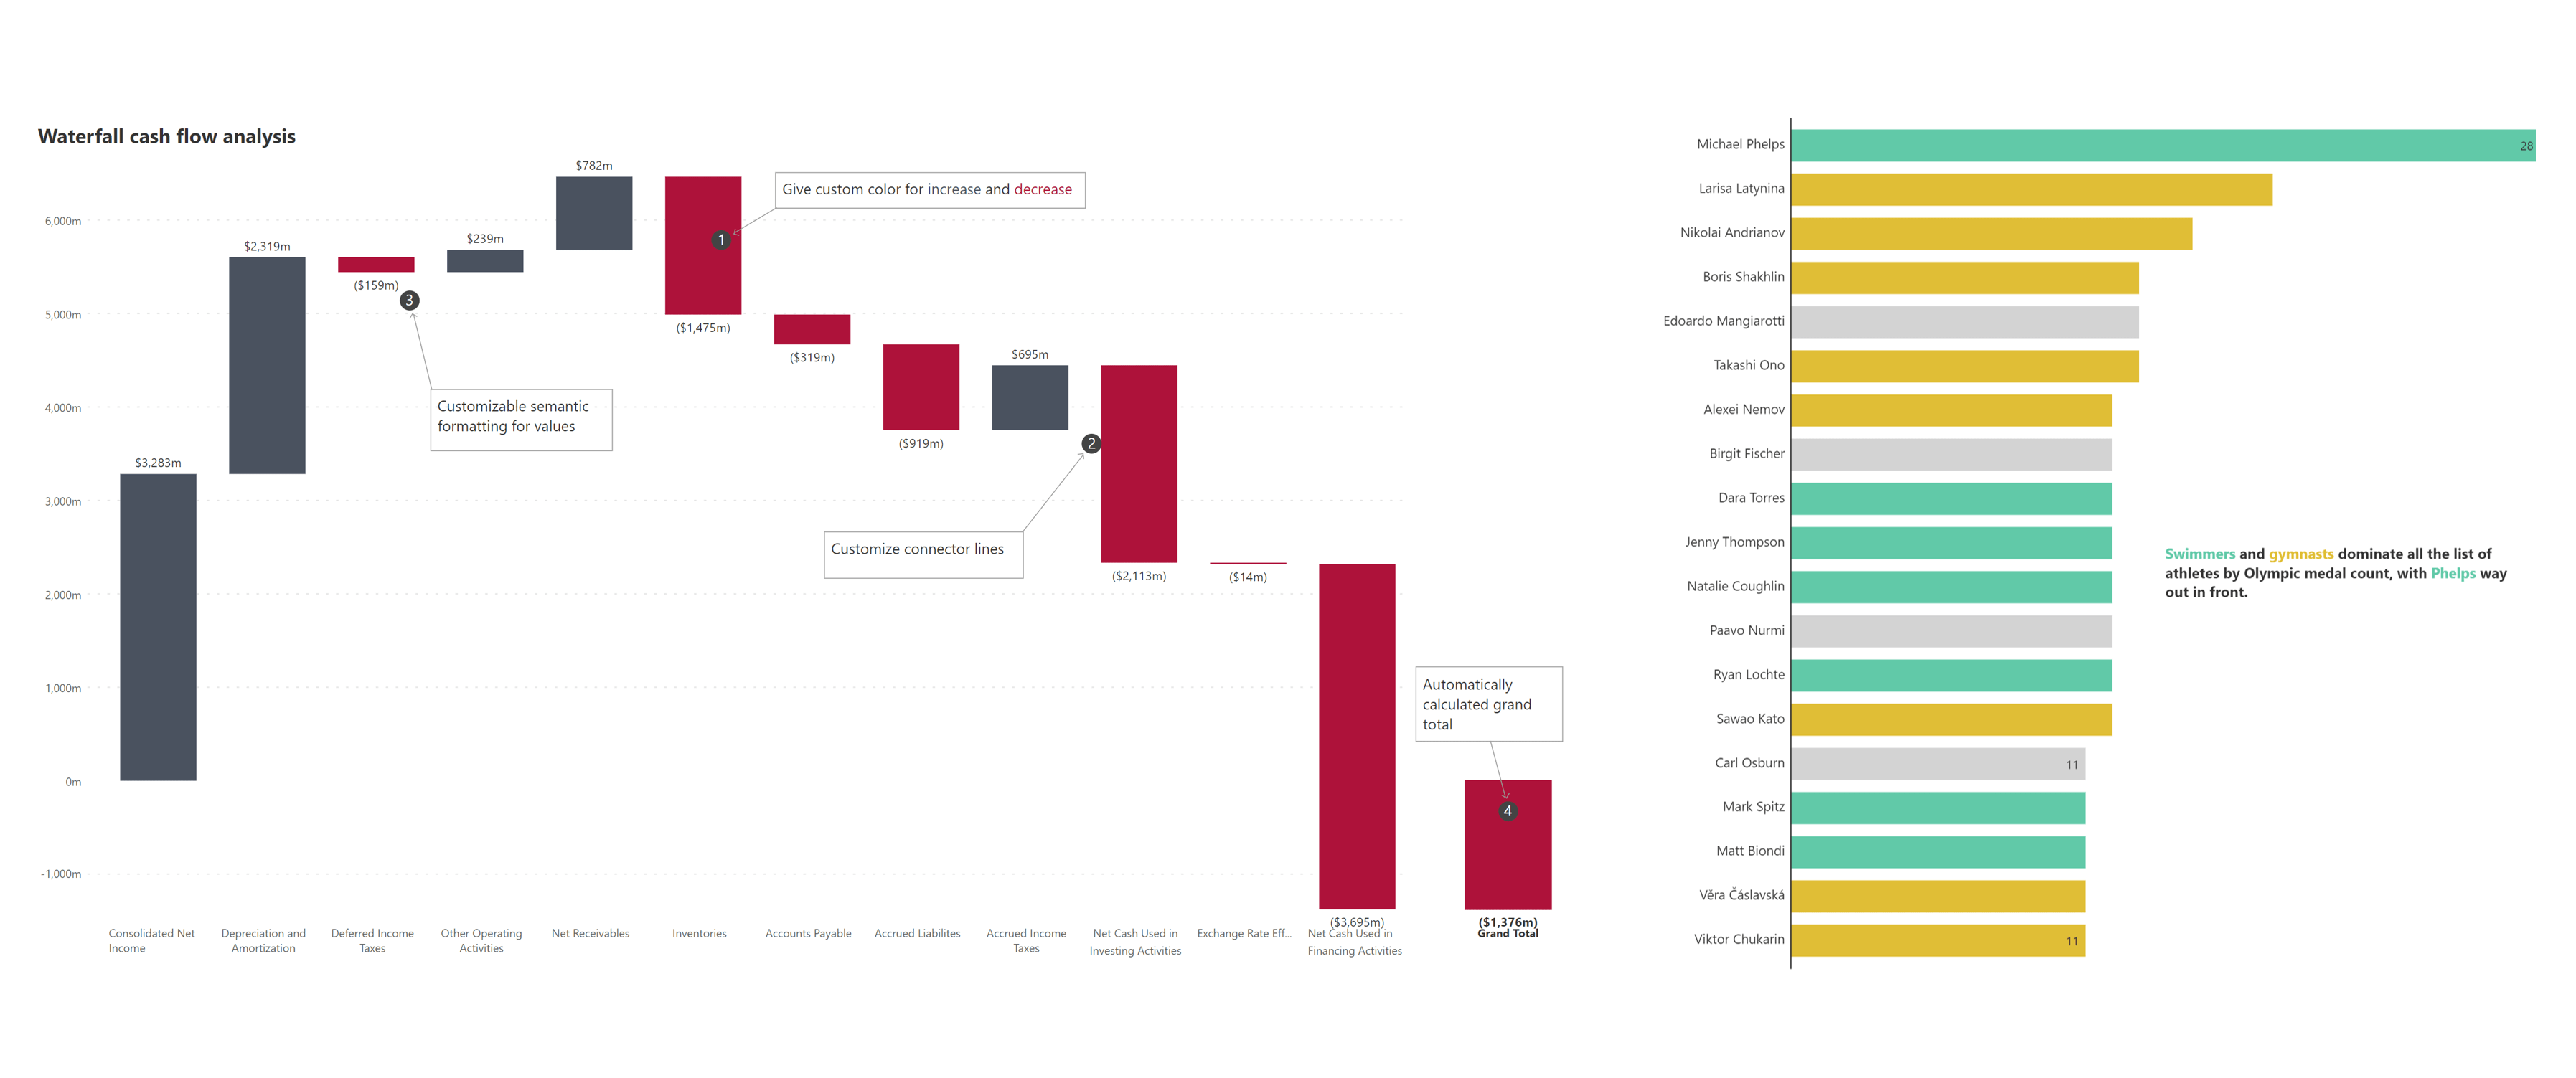
Draw attention to significant trends by color coding annotations and data series, as shown in the below image.
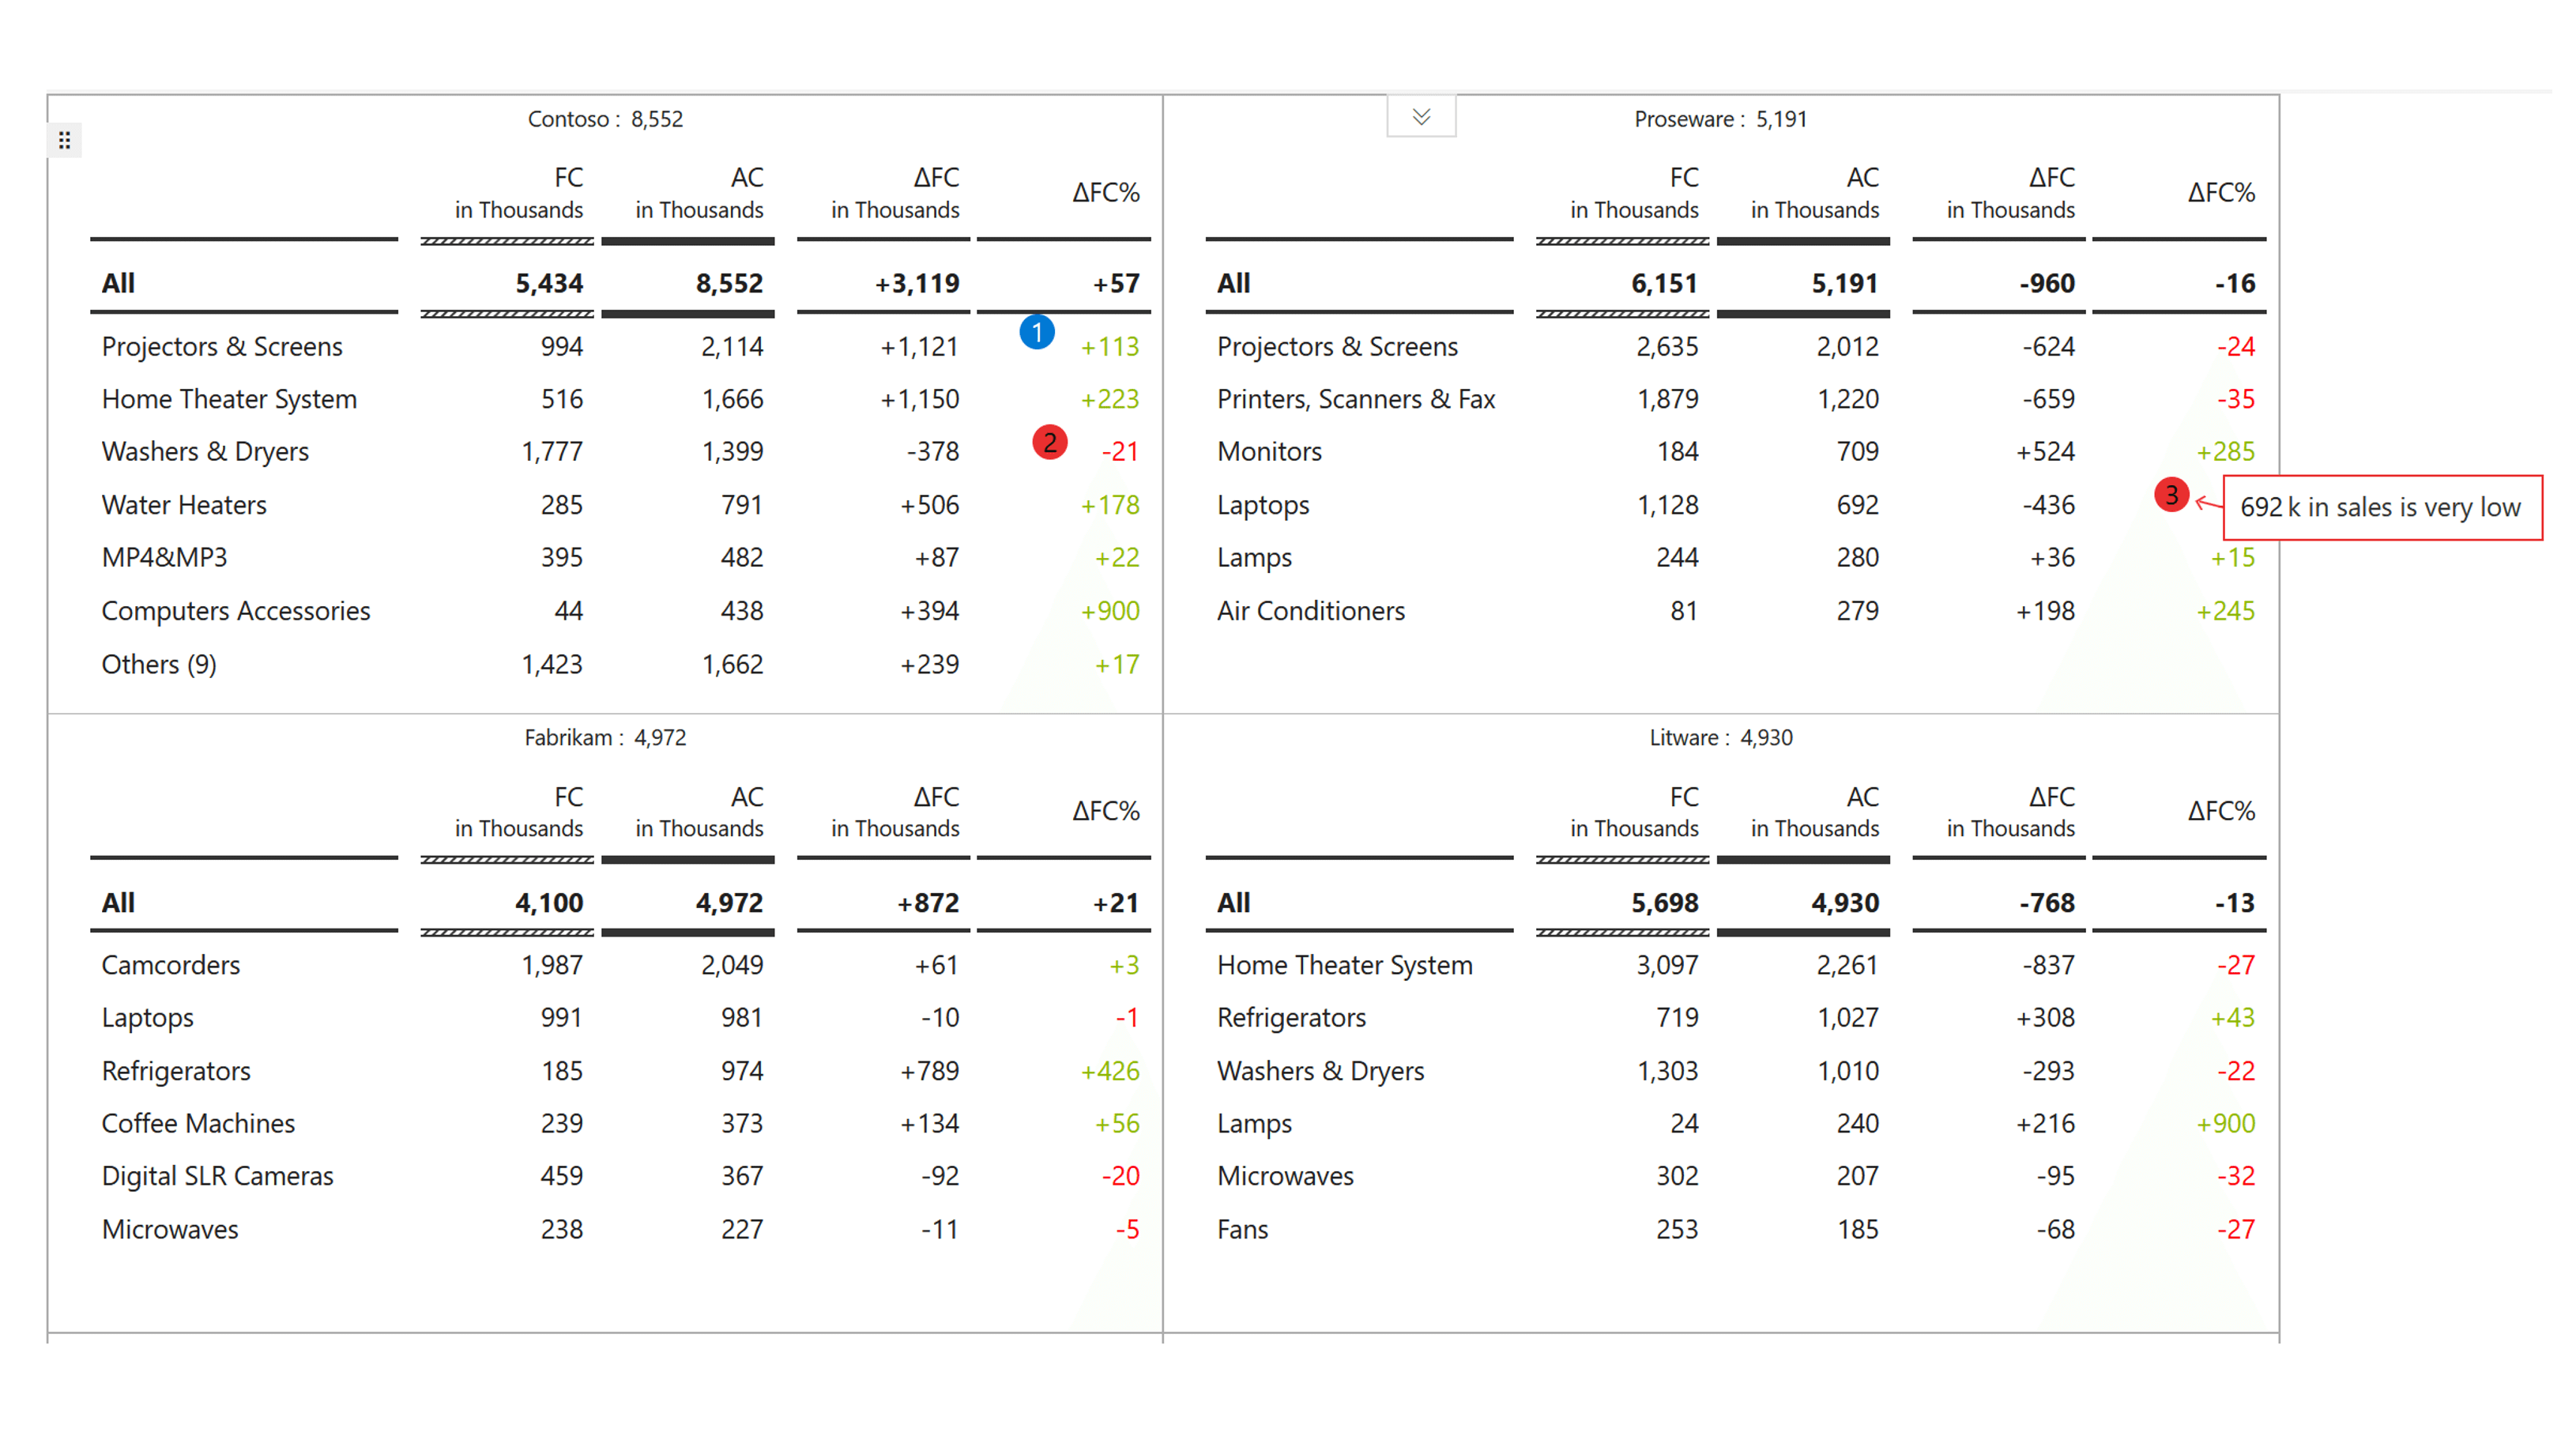
Add annotations at the cell level to tables in normal & small multiple modes. Several customization options are available to format the color and style of arrows, annotation container borders, etc.

Inforiver helps enterprises consolidate planning, reporting & analytics on a single platform (Power BI). The no-code, self-service award-winning platform has been recognized as the industry’s best and is adopted by many Fortune 100 firms.
Inforiver is a product of Lumel, the #1 Power BI AppSource Partner. The firm serves over 3,000 customers worldwide through its portfolio of products offered under the brands Inforiver, EDITable, ValQ, and xViz.