Upcoming webinar on 'Inforiver Charts : The fastest way to deliver stories in Power BI', Aug 29th , Monday, 10.30 AM CST. Register Now
Upcoming webinar on 'Inforiver Charts : The fastest way to deliver stories in Power BI', Aug 29th , Monday, 10.30 AM CST. Register Now
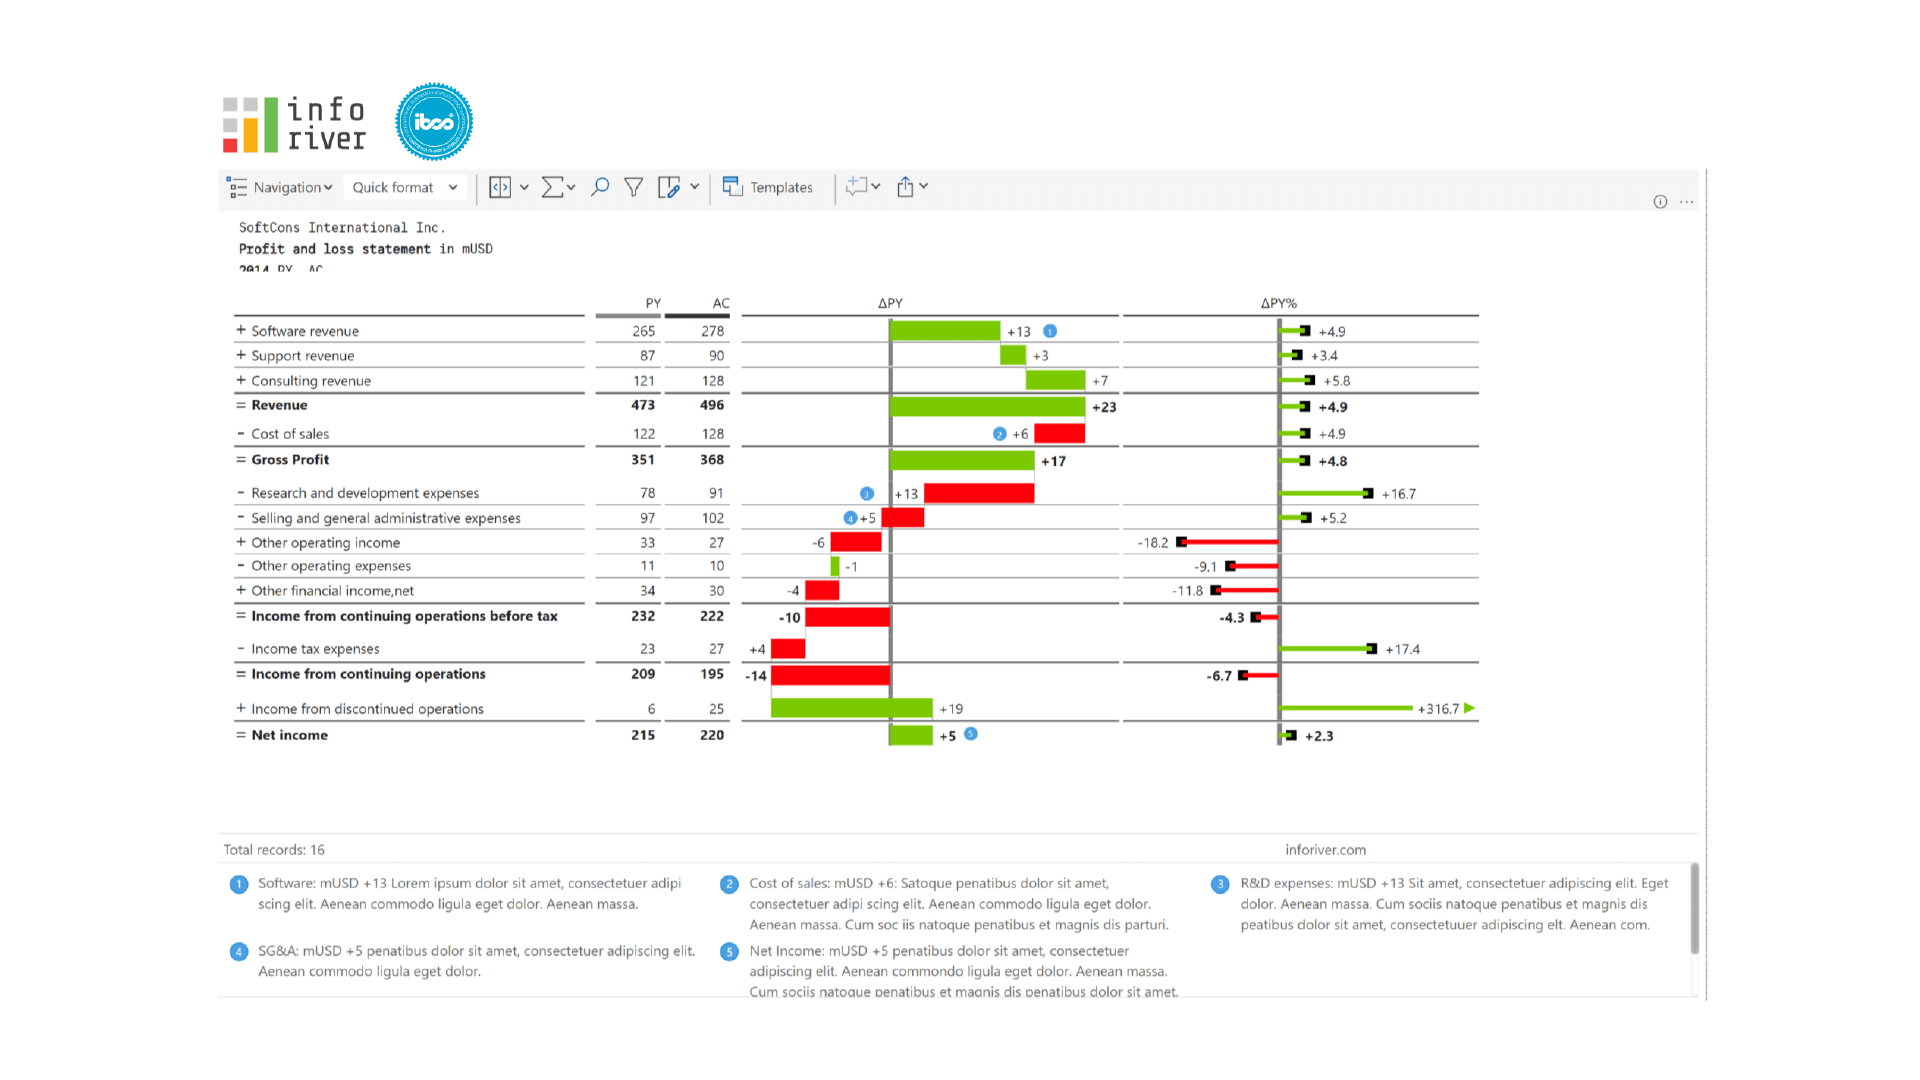
A profit and loss statement with calculation schemes are shown in the rows. The absolute and relative variances relative to the previous year are represented as waterfall bars and pins.
to try advance features
[demo_download_modal title="Variance P&L statement in Microsoft Power BI" link="https://inforiver.com/wp-content/uploads/Variance-PL-ibcs-demo.zip"]
Inforiver helps enterprises consolidate planning, reporting & analytics on a single platform (Power BI). The no-code, self-service award-winning platform has been recognized as the industry’s best and is adopted by many Fortune 100 firms.
Inforiver is a product of Lumel, the #1 Power BI AppSource Partner. The firm serves over 3,000 customers worldwide through its portfolio of products offered under the brands Inforiver, EDITable, ValQ, and xViz.