
Upcoming webinar on 'Inforiver Charts : The fastest way to deliver stories in Power BI', Aug 29th , Monday, 10.30 AM CST. Register Now
Upcoming webinar on 'Inforiver Charts : The fastest way to deliver stories in Power BI', Aug 29th , Monday, 10.30 AM CST. Register Now
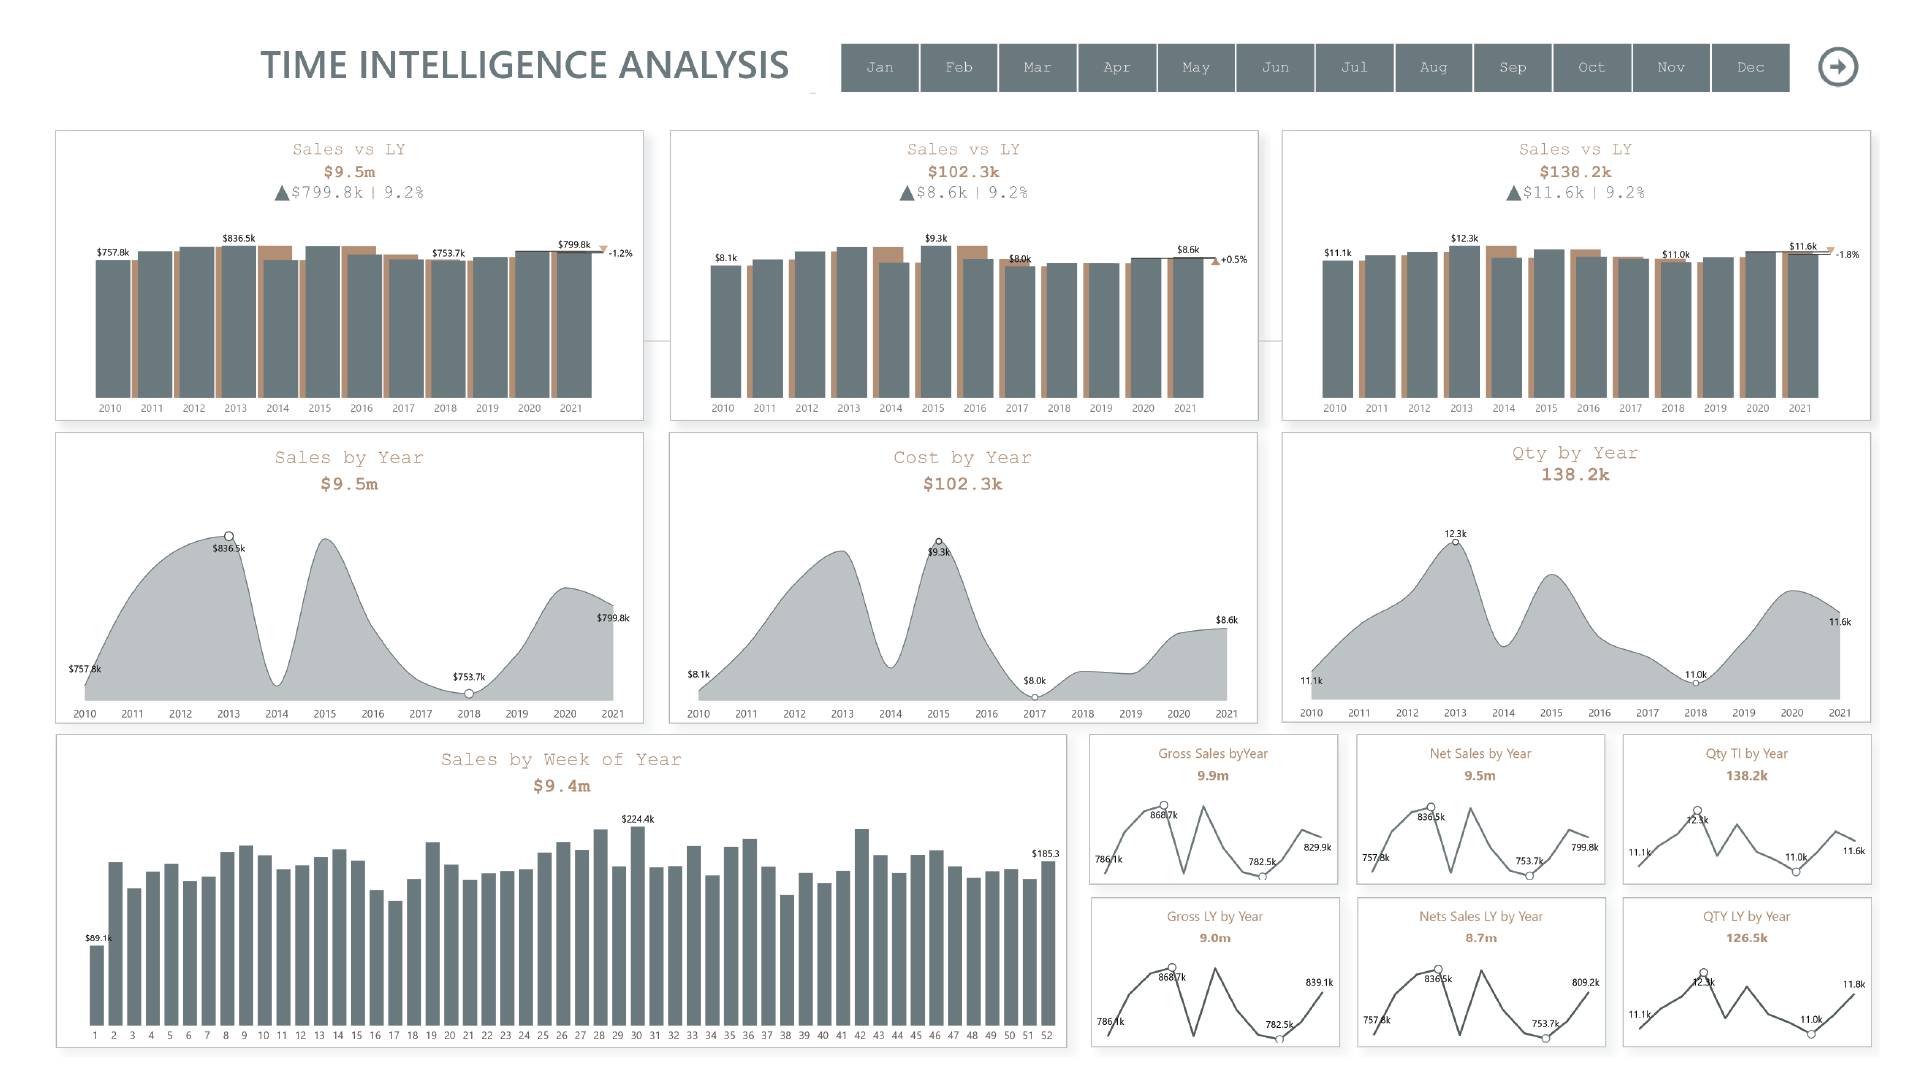
The dashboard provides a detailed summary of the performance of sales, cost, and quantity across months, regions, products, and business divisions. It also visualizes the products that have performed the most and least across categories and regions.
to try advance features
[demo_download_modal title="Time Intelligence Analysis" link="https://inforiver.com/wp-content/uploads/inforiver-time-intelligence-demo.zip"]
Inforiver helps enterprises consolidate planning, reporting & analytics on a single platform (Power BI). The no-code, self-service award-winning platform has been recognized as the industry’s best and is adopted by many Fortune 100 firms.
Inforiver is a product of Lumel, the #1 Power BI AppSource Partner. The firm serves over 3,000 customers worldwide through its portfolio of products offered under the brands Inforiver, EDITable, ValQ, and xViz.


