Upcoming webinar on 'Inforiver Charts : The fastest way to deliver stories in Power BI', Aug 29th , Monday, 10.30 AM CST. Register Now
Upcoming webinar on 'Inforiver Charts : The fastest way to deliver stories in Power BI', Aug 29th , Monday, 10.30 AM CST. Register Now
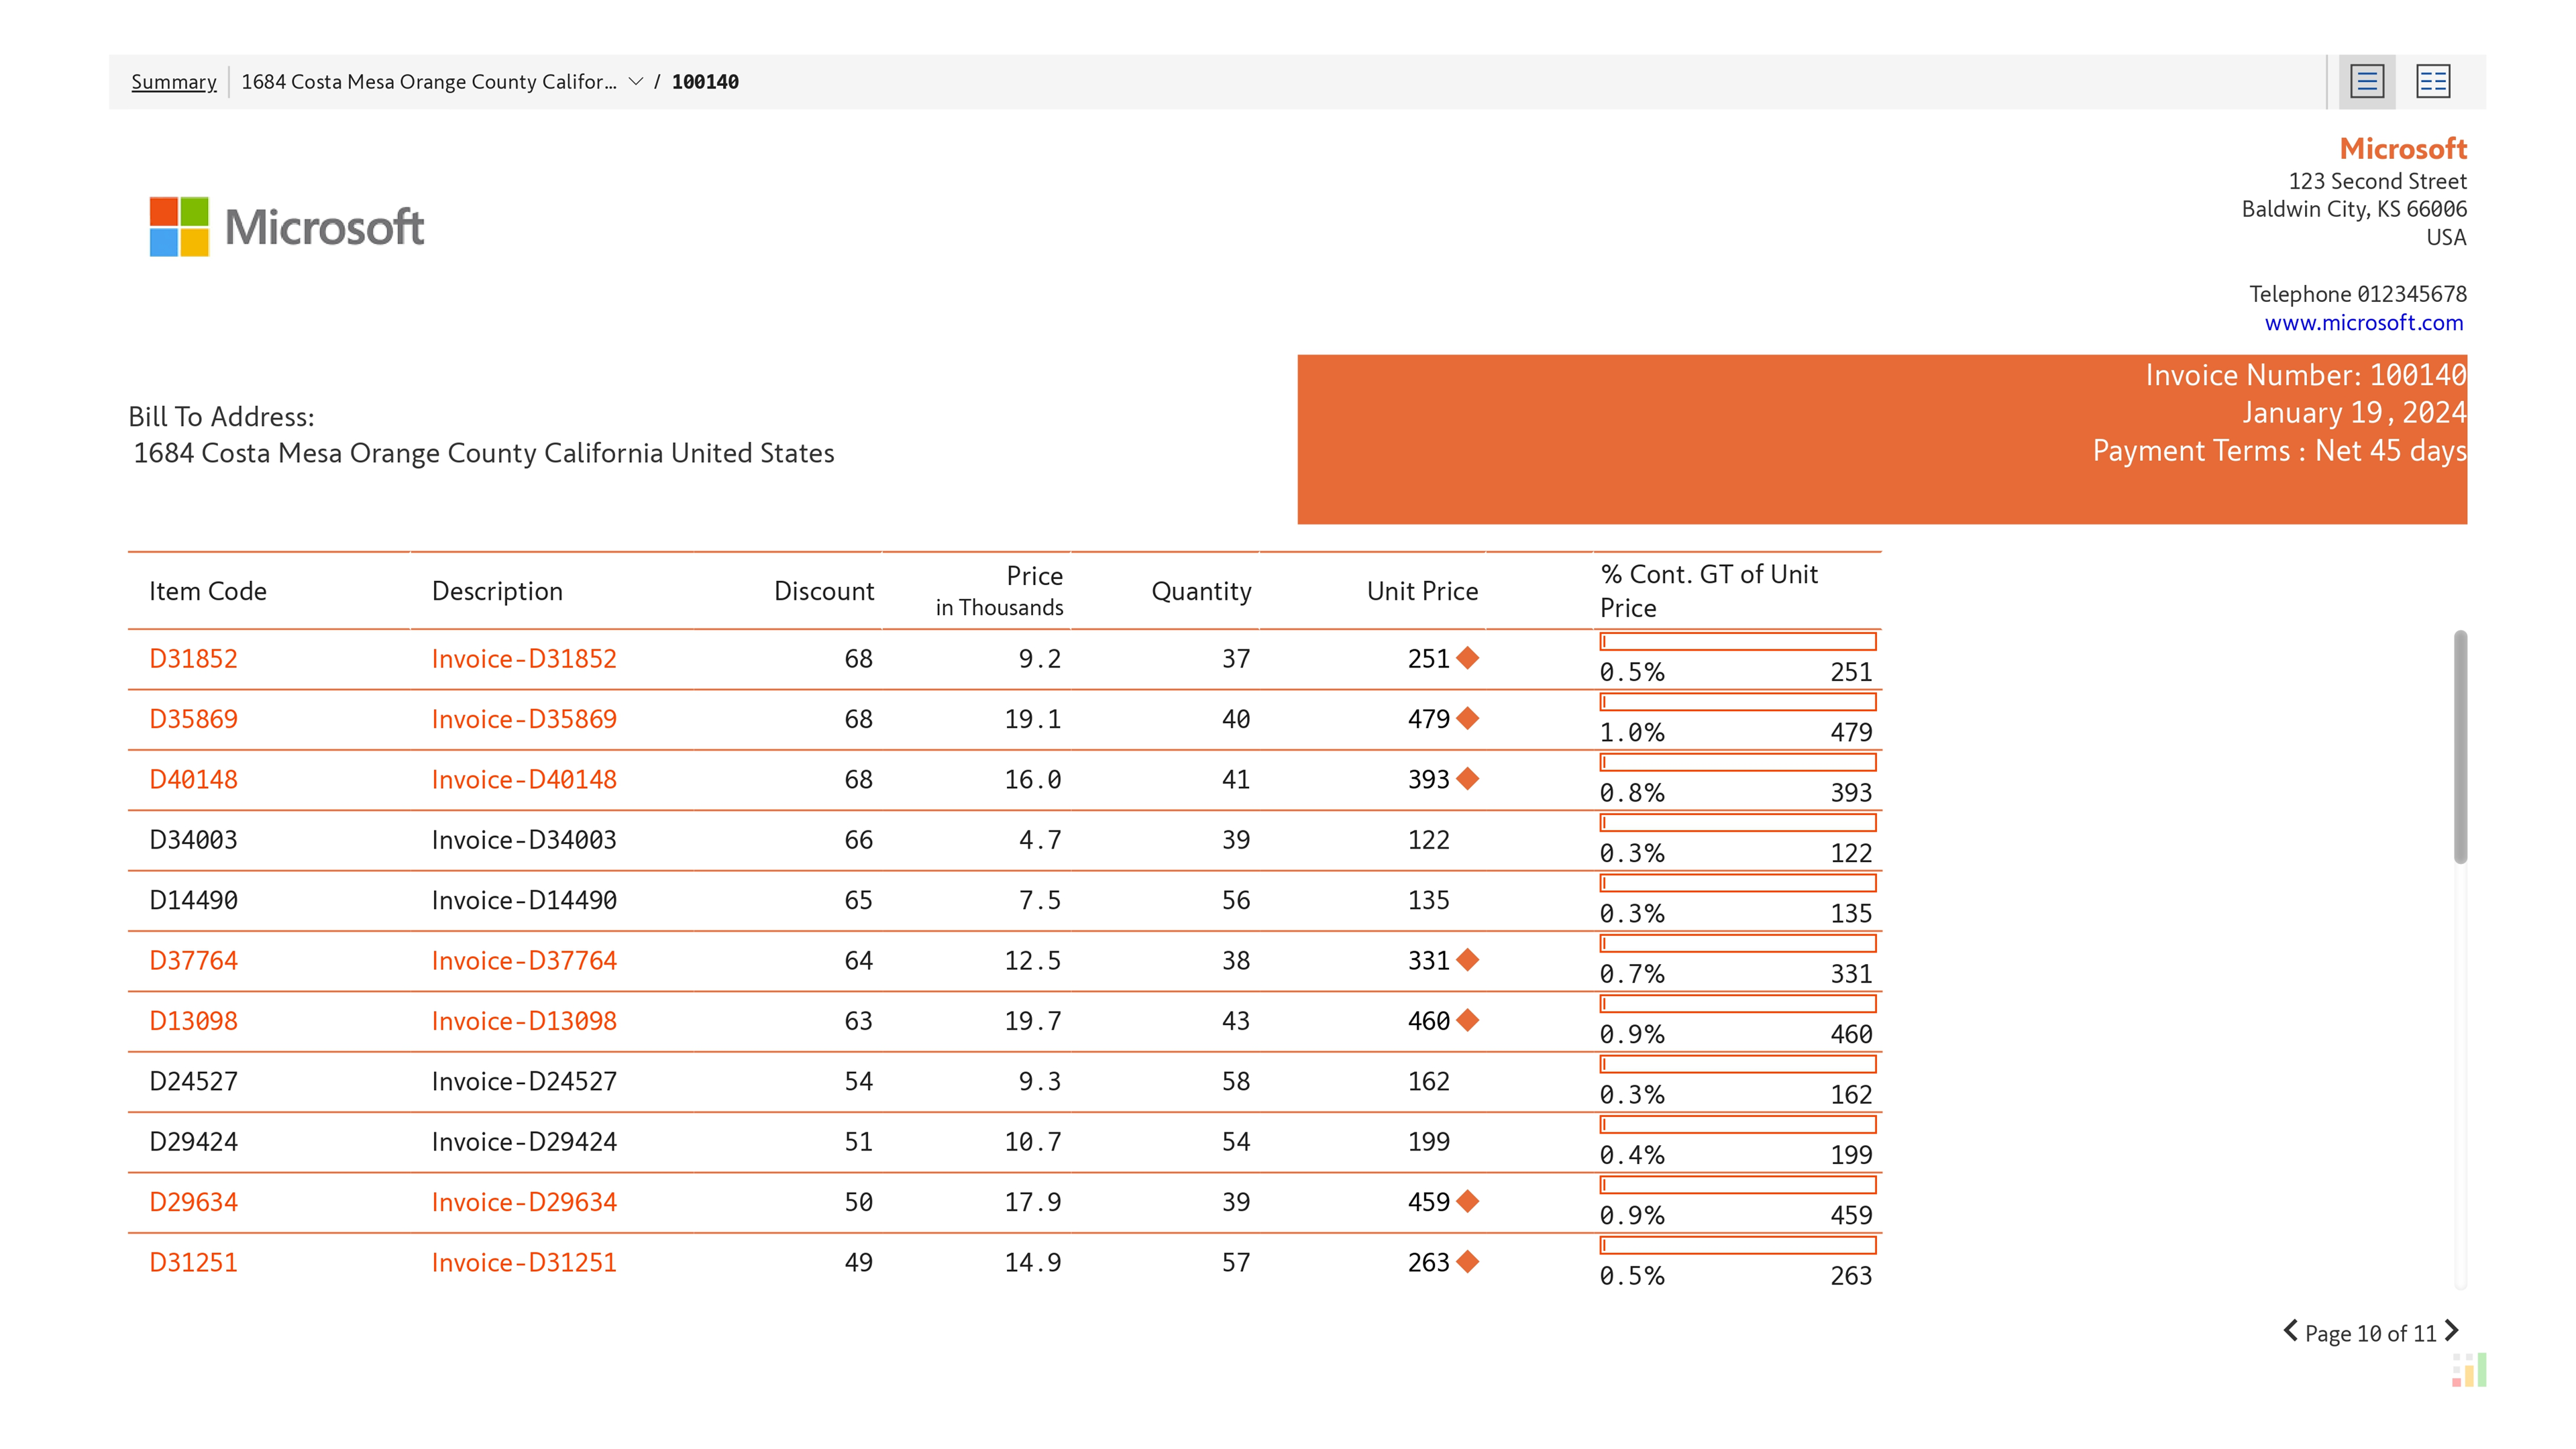
Using Report+ in Inforiver Matrix, you can easily create invoices with header/footers that you can customize or select from the existing designs. You can also apply conditional formatting, blended measures, quick measures to emphasize the line items.With Inforiver, you can export these highly formatted invoices as PDF files that are simple to print or share.
to try advance features
[demo_download_modal title="Paginated Reporting - Invoice" link="https://inforiver.com/wp-content/uploads/inforiver-demo-paginated-report-invoice.zip"]
Inforiver helps enterprises consolidate planning, reporting & analytics on a single platform (Power BI). The no-code, self-service award-winning platform has been recognized as the industry’s best and is adopted by many Fortune 100 firms.
Inforiver is a product of Lumel, the #1 Power BI AppSource Partner. The firm serves over 3,000 customers worldwide through its portfolio of products offered under the brands Inforiver, EDITable, ValQ, and xViz.