Upcoming webinar on 'Inforiver Charts : The fastest way to deliver stories in Power BI', Aug 29th , Monday, 10.30 AM CST. Register Now
Upcoming webinar on 'Inforiver Charts : The fastest way to deliver stories in Power BI', Aug 29th , Monday, 10.30 AM CST. Register Now
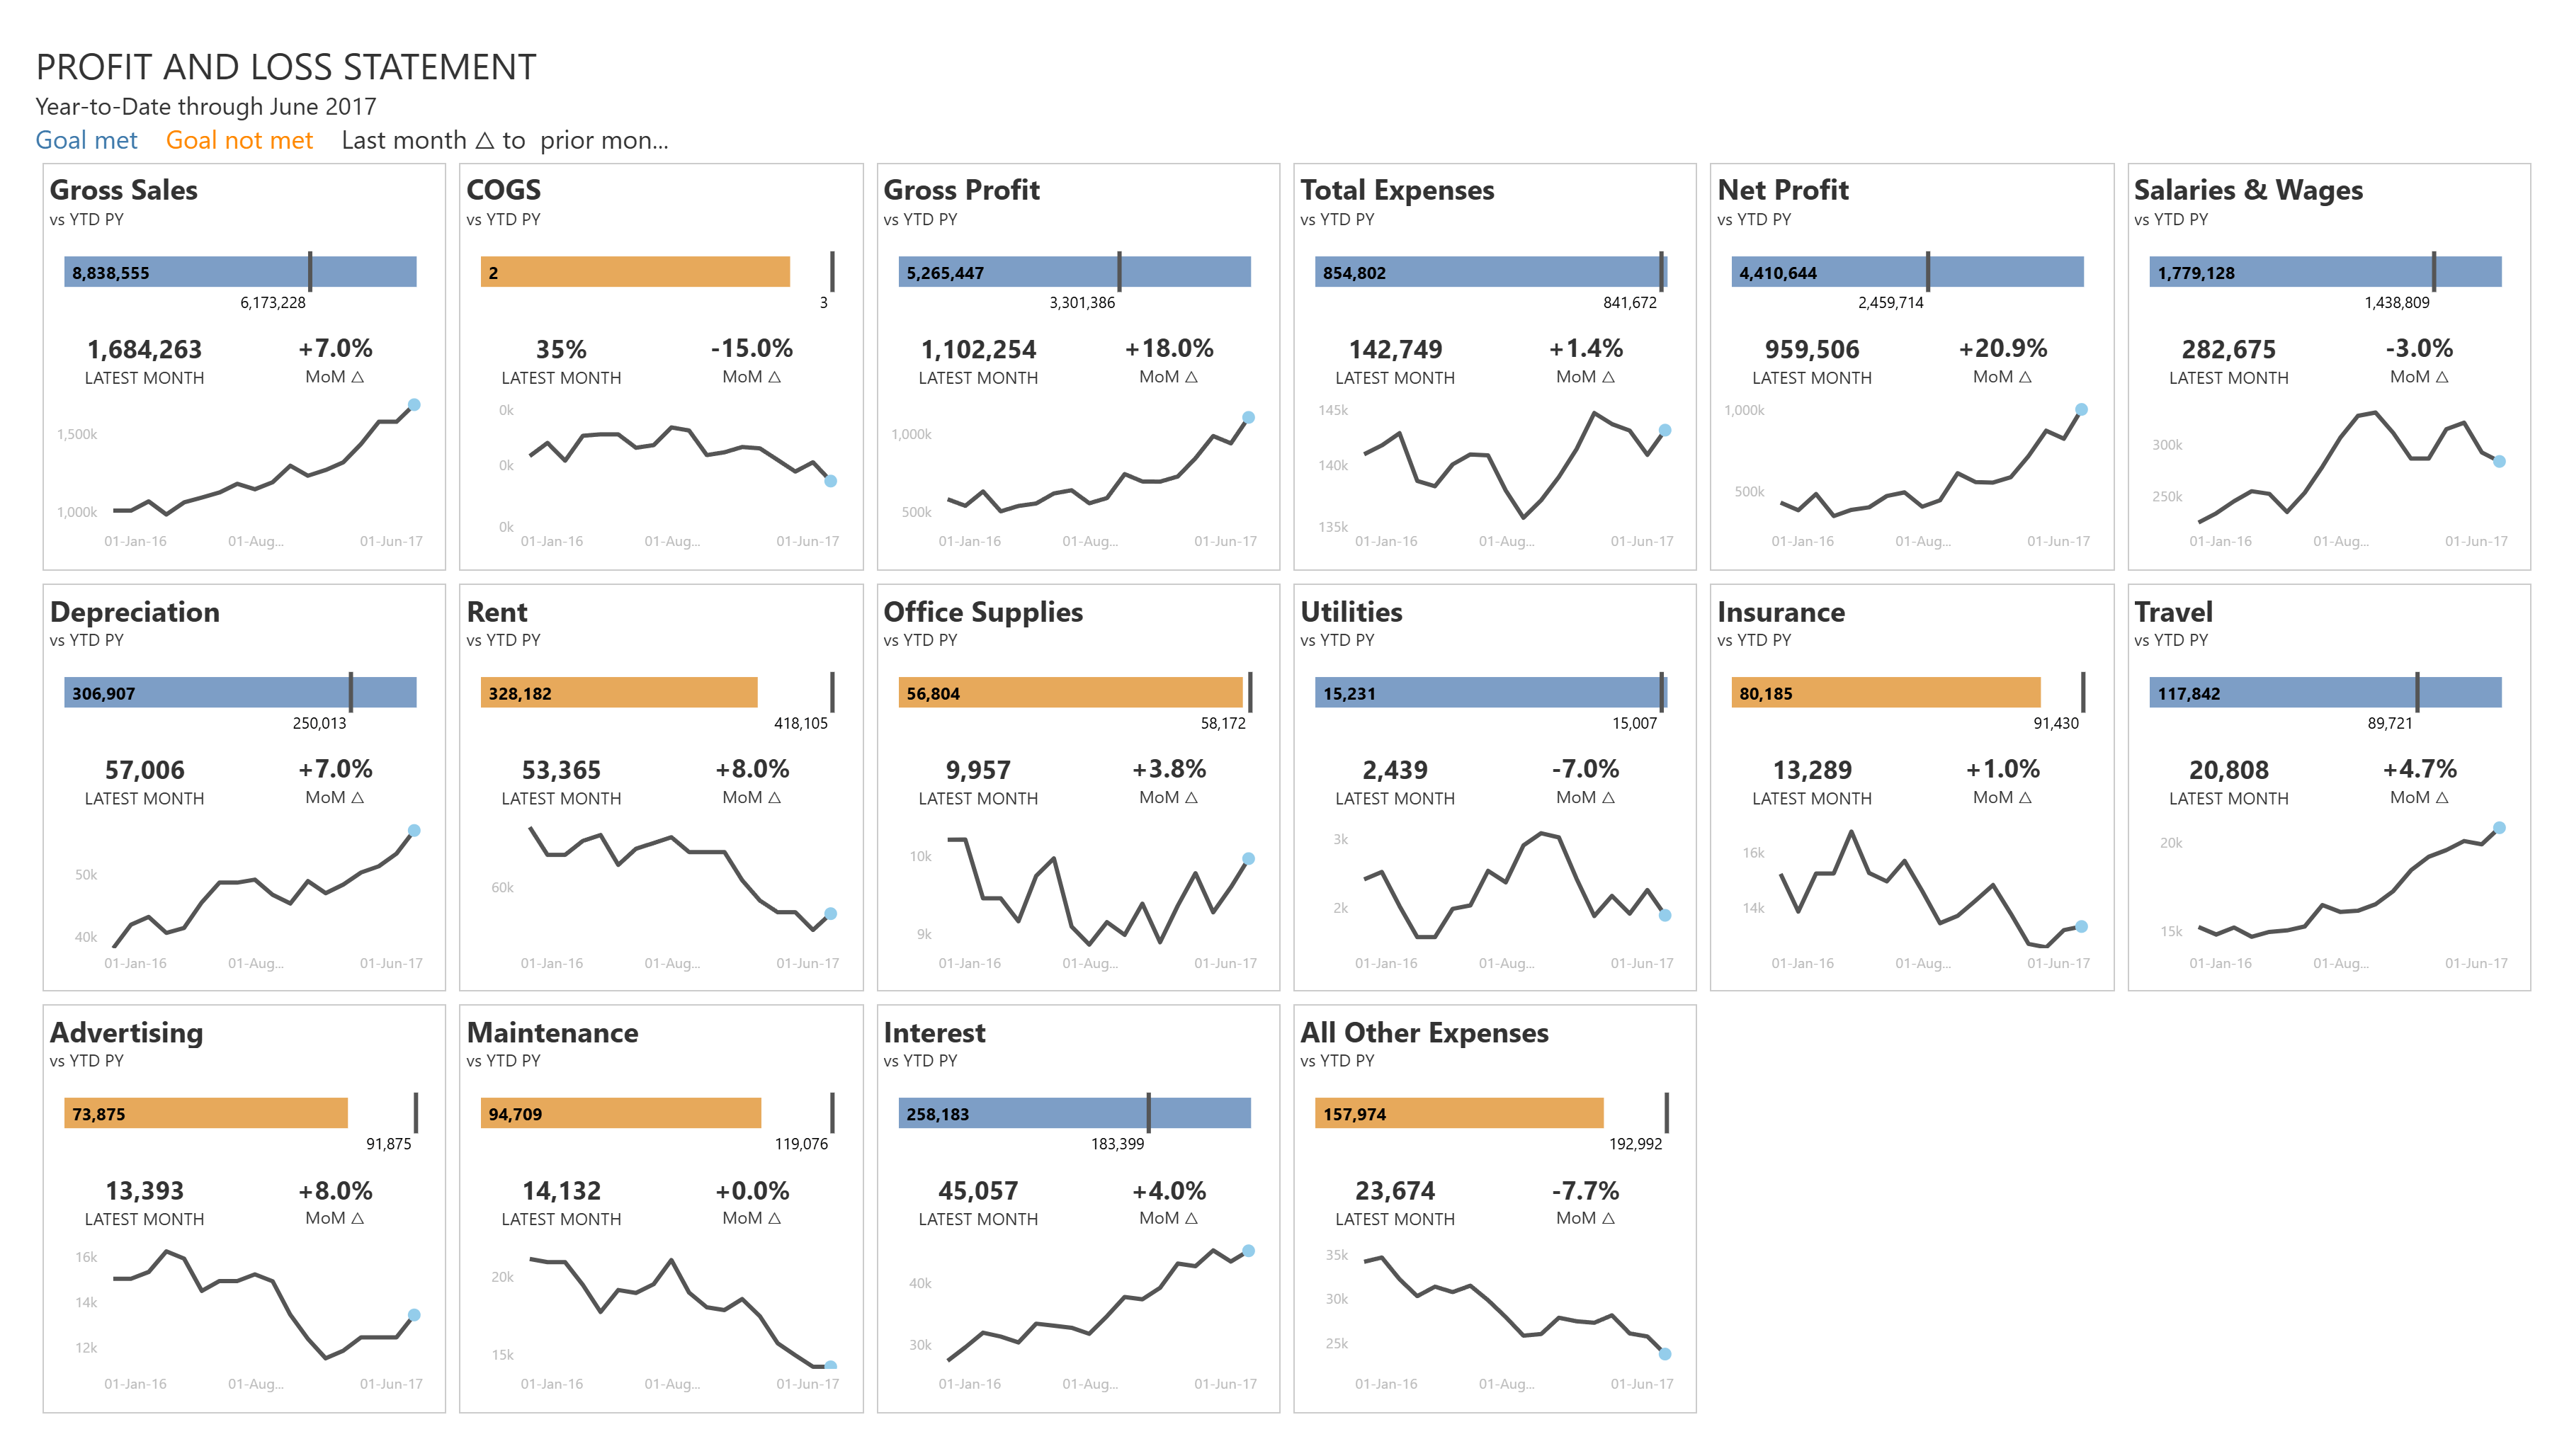
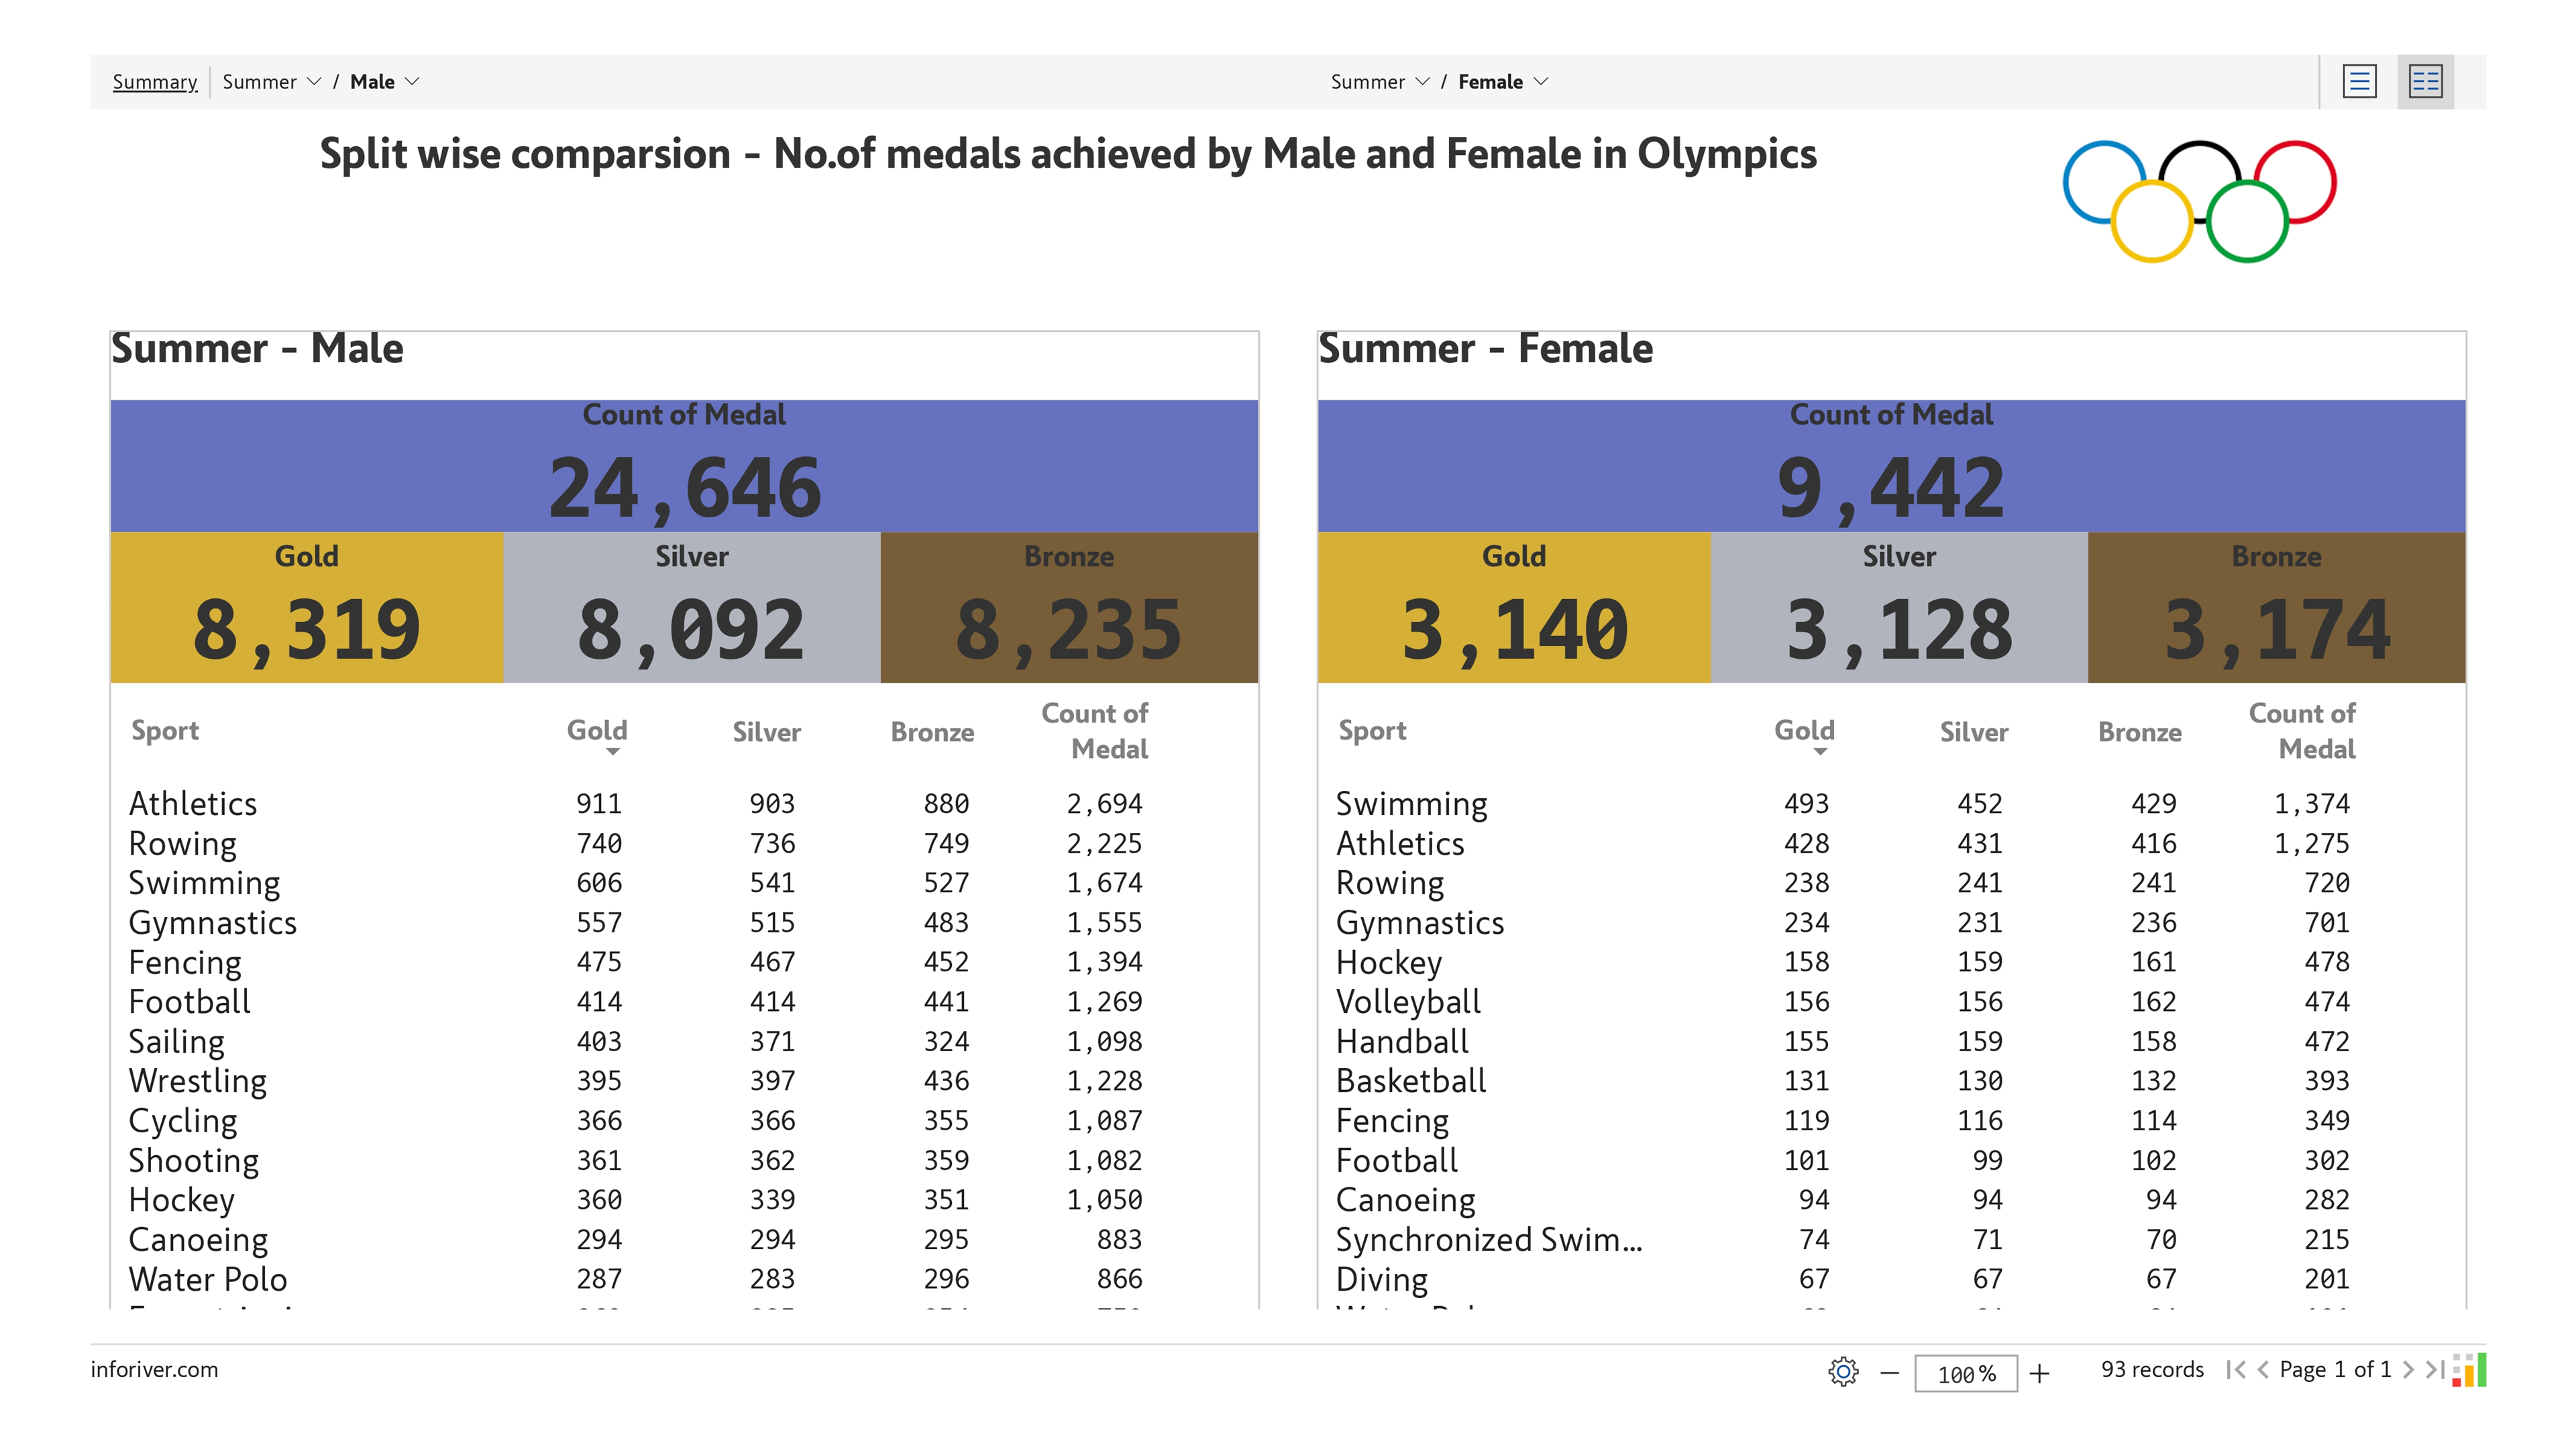
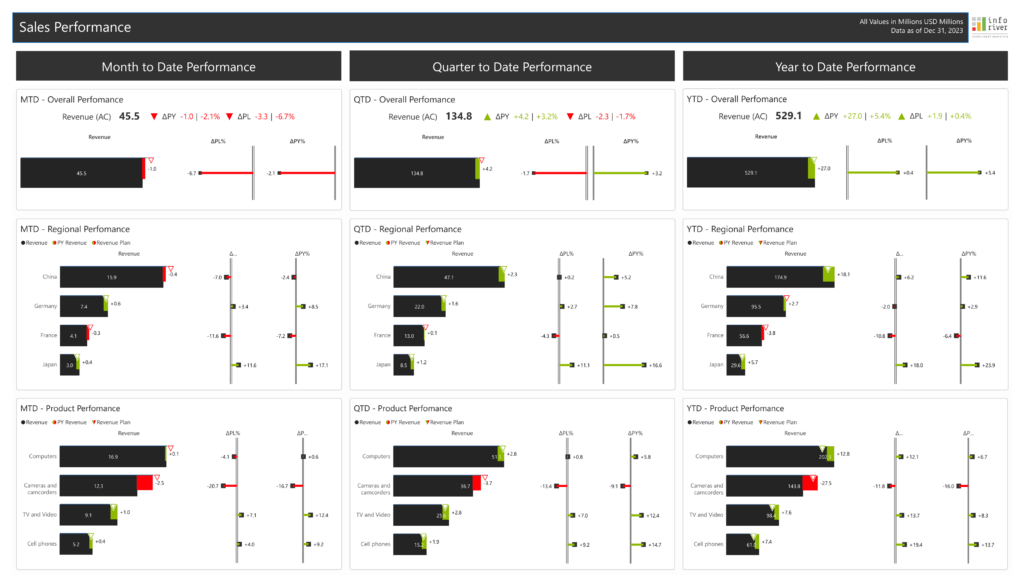
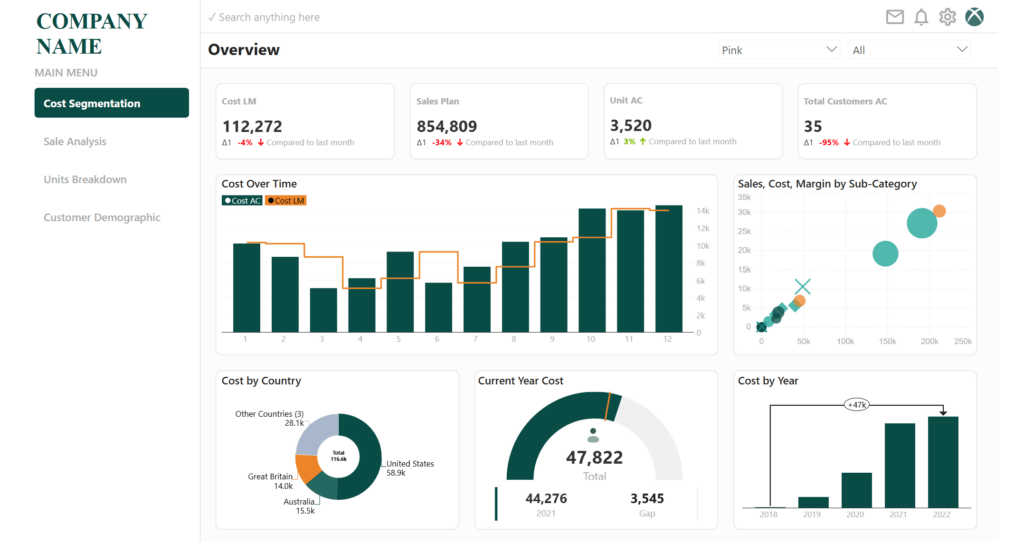
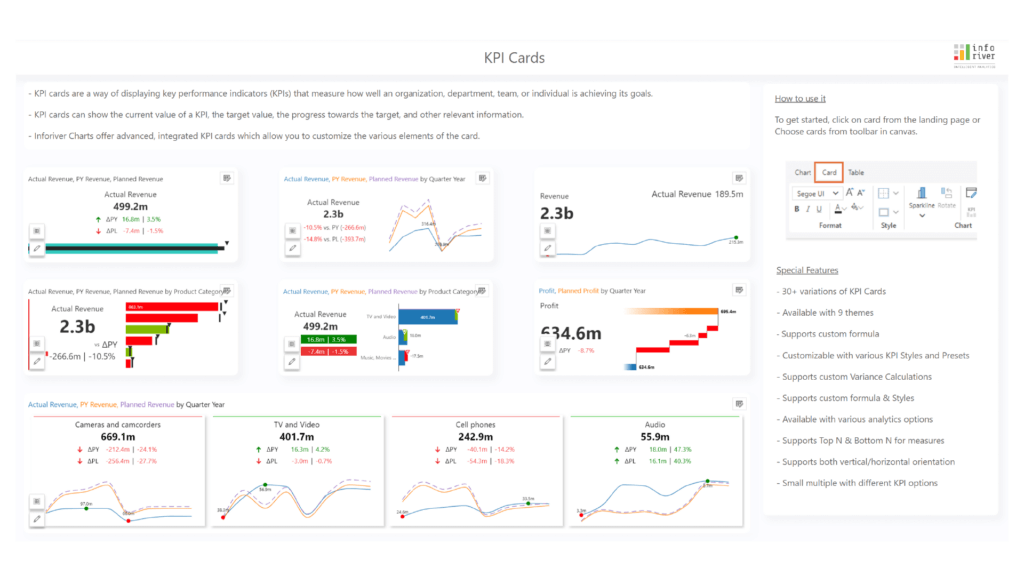
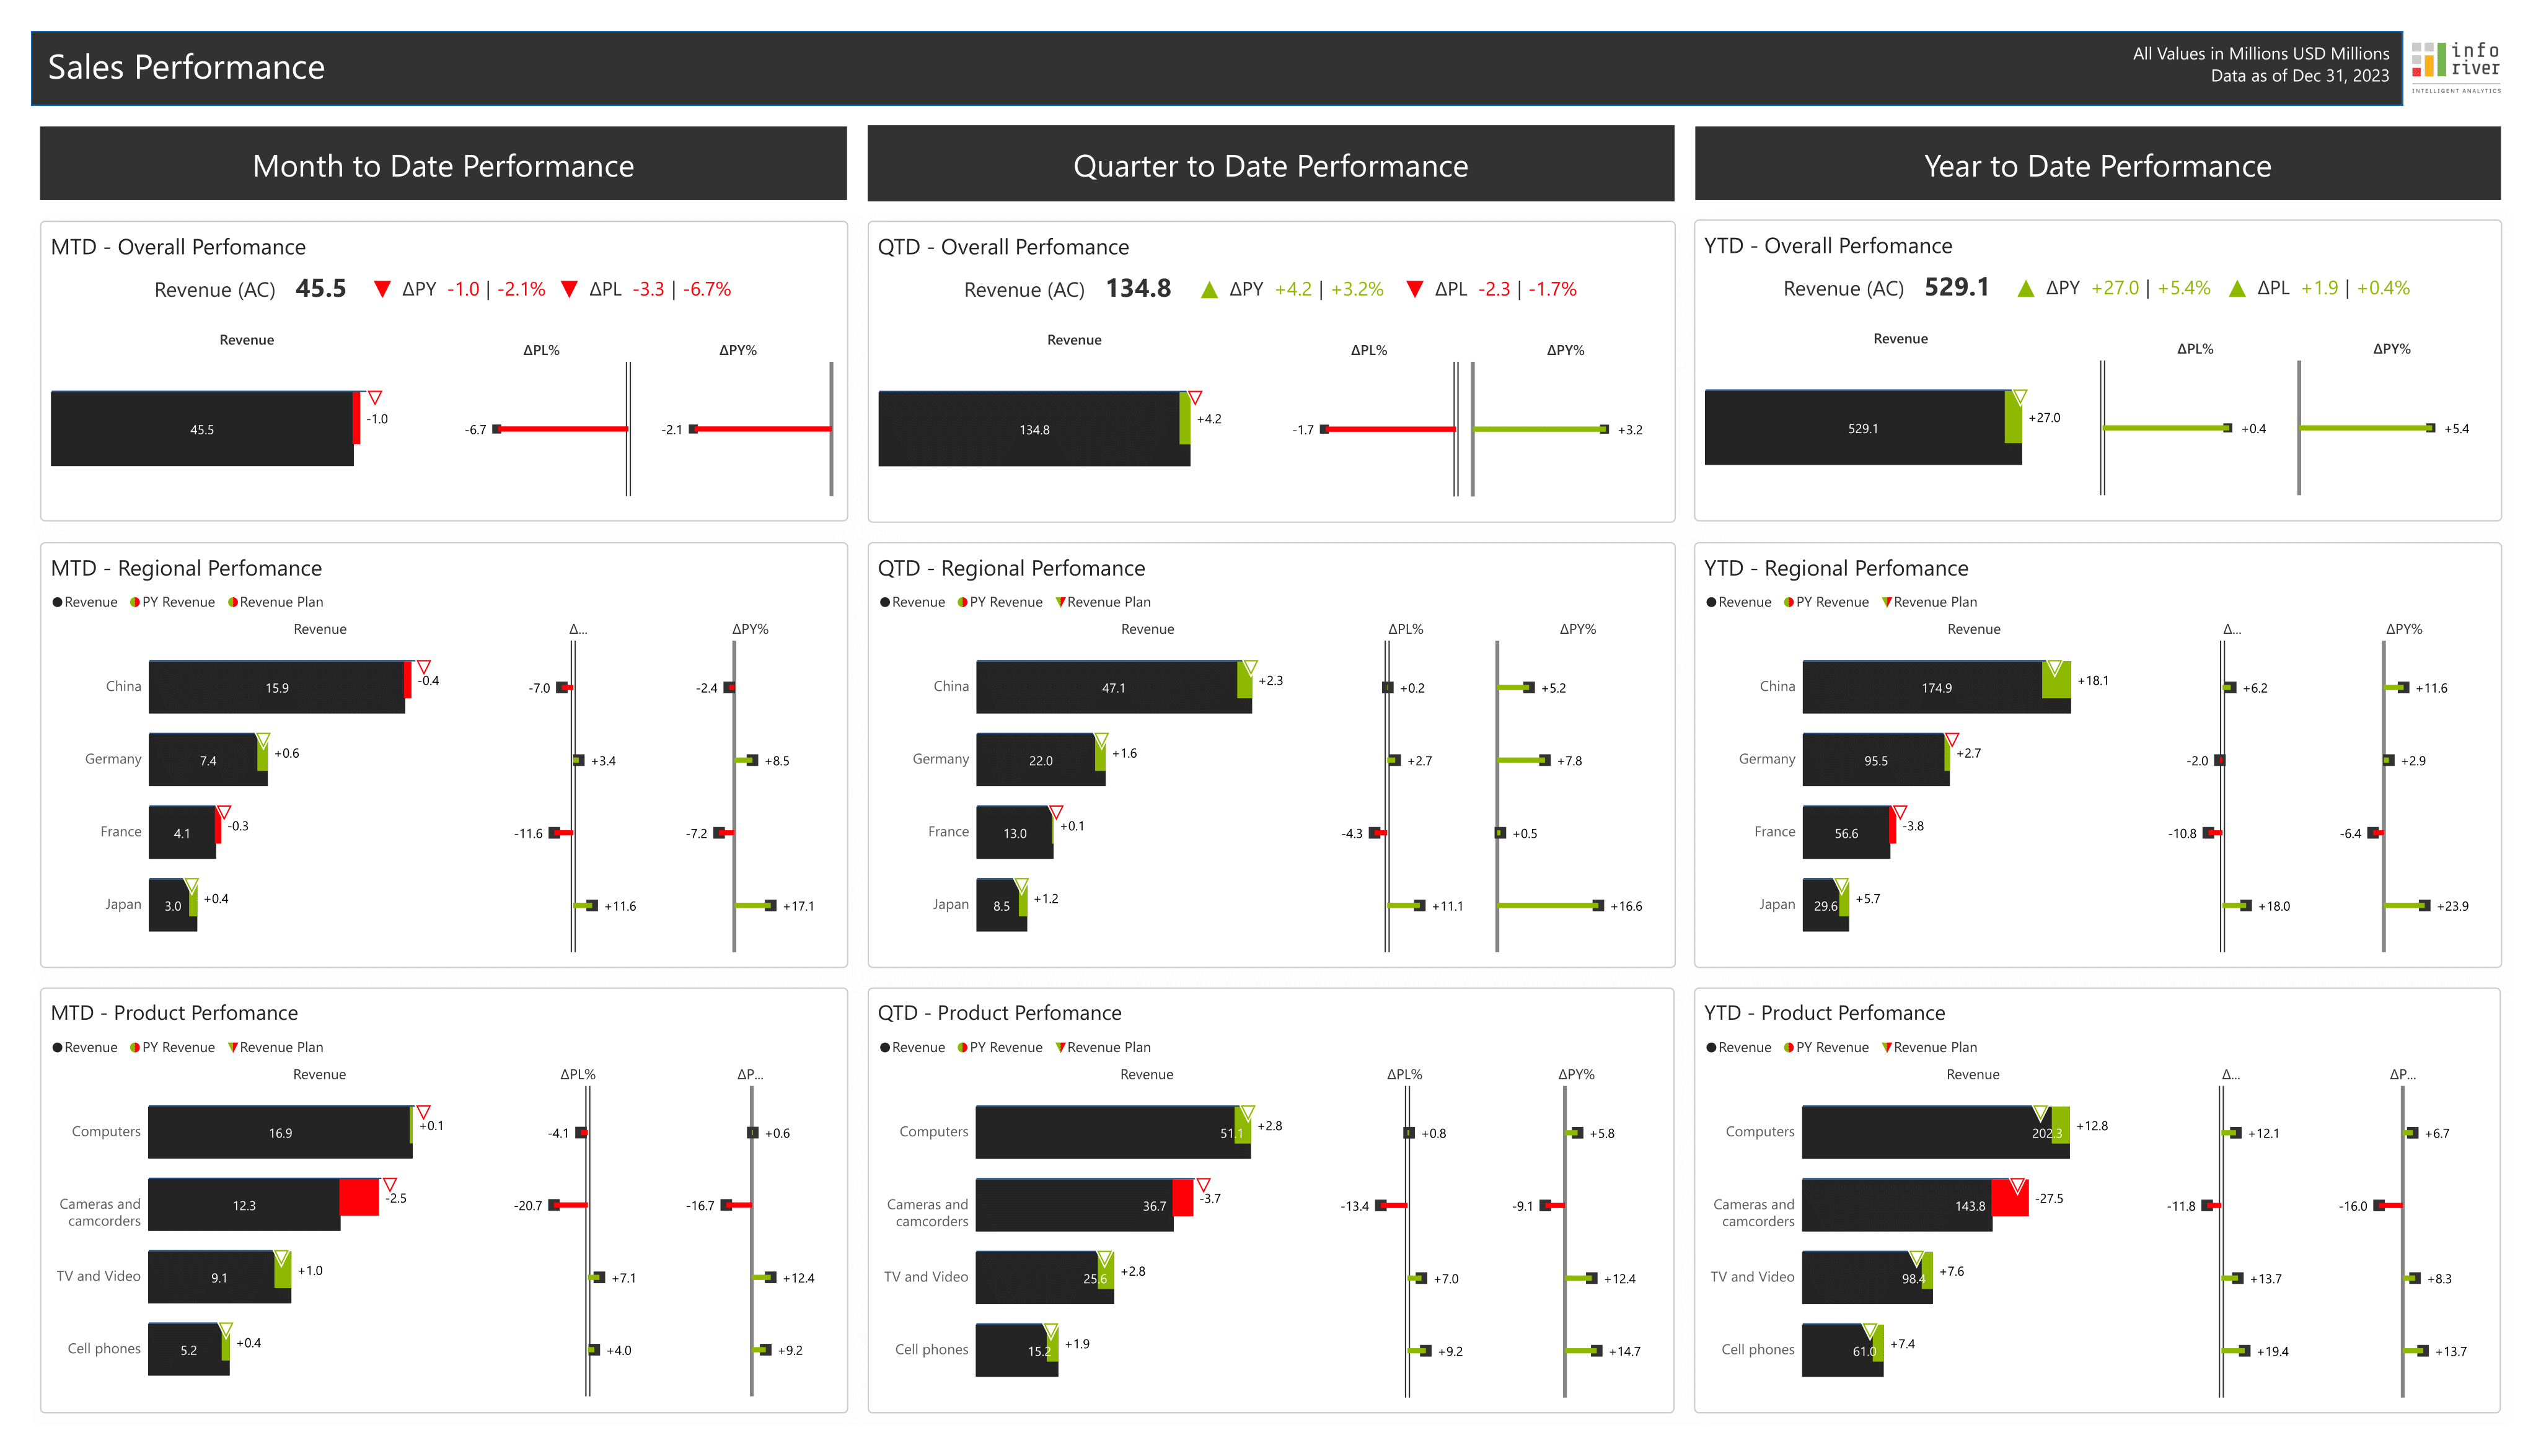
Inforiver Analytics+ KPI cards provide a dynamic and superior way to visualize and track key performance indicators (KPIs) for Profit and Loss (P&L) statements. These cards offer a comprehensive view of your financial metrics, combining three levels of detail: overview, insight chart, and sparkline. This integration allows for quick snapshots, detailed analysis, and trend visualization, all in one place, enhancing decision-making and efficiency.
Visualize your financial statements with Inforiver Analytics+ KPI Cards just like you would in Tableau, but with enhanced features. This is perfect for those looking to streamline their reporting process and gain deeper insights into their business performance.
This design was inspired by Andy Kriebel.
to try advance features
[demo_download_modal title="Profit & Loss Statements with Inforiver Analytics+ KPI Cards" link="https://inforiver.com/wp-content/uploads/kpi-tableau-public.zip"]
Inforiver helps enterprises consolidate planning, reporting & analytics on a single platform (Power BI). The no-code, self-service award-winning platform has been recognized as the industry’s best and is adopted by many Fortune 100 firms.
Inforiver is a product of Lumel, the #1 Power BI AppSource Partner. The firm serves over 3,000 customers worldwide through its portfolio of products offered under the brands Inforiver, EDITable, ValQ, and xViz.