Upcoming webinar on 'Inforiver Charts : The fastest way to deliver stories in Power BI', Aug 29th , Monday, 10.30 AM CST. Register Now
Upcoming webinar on 'Inforiver Charts : The fastest way to deliver stories in Power BI', Aug 29th , Monday, 10.30 AM CST. Register Now
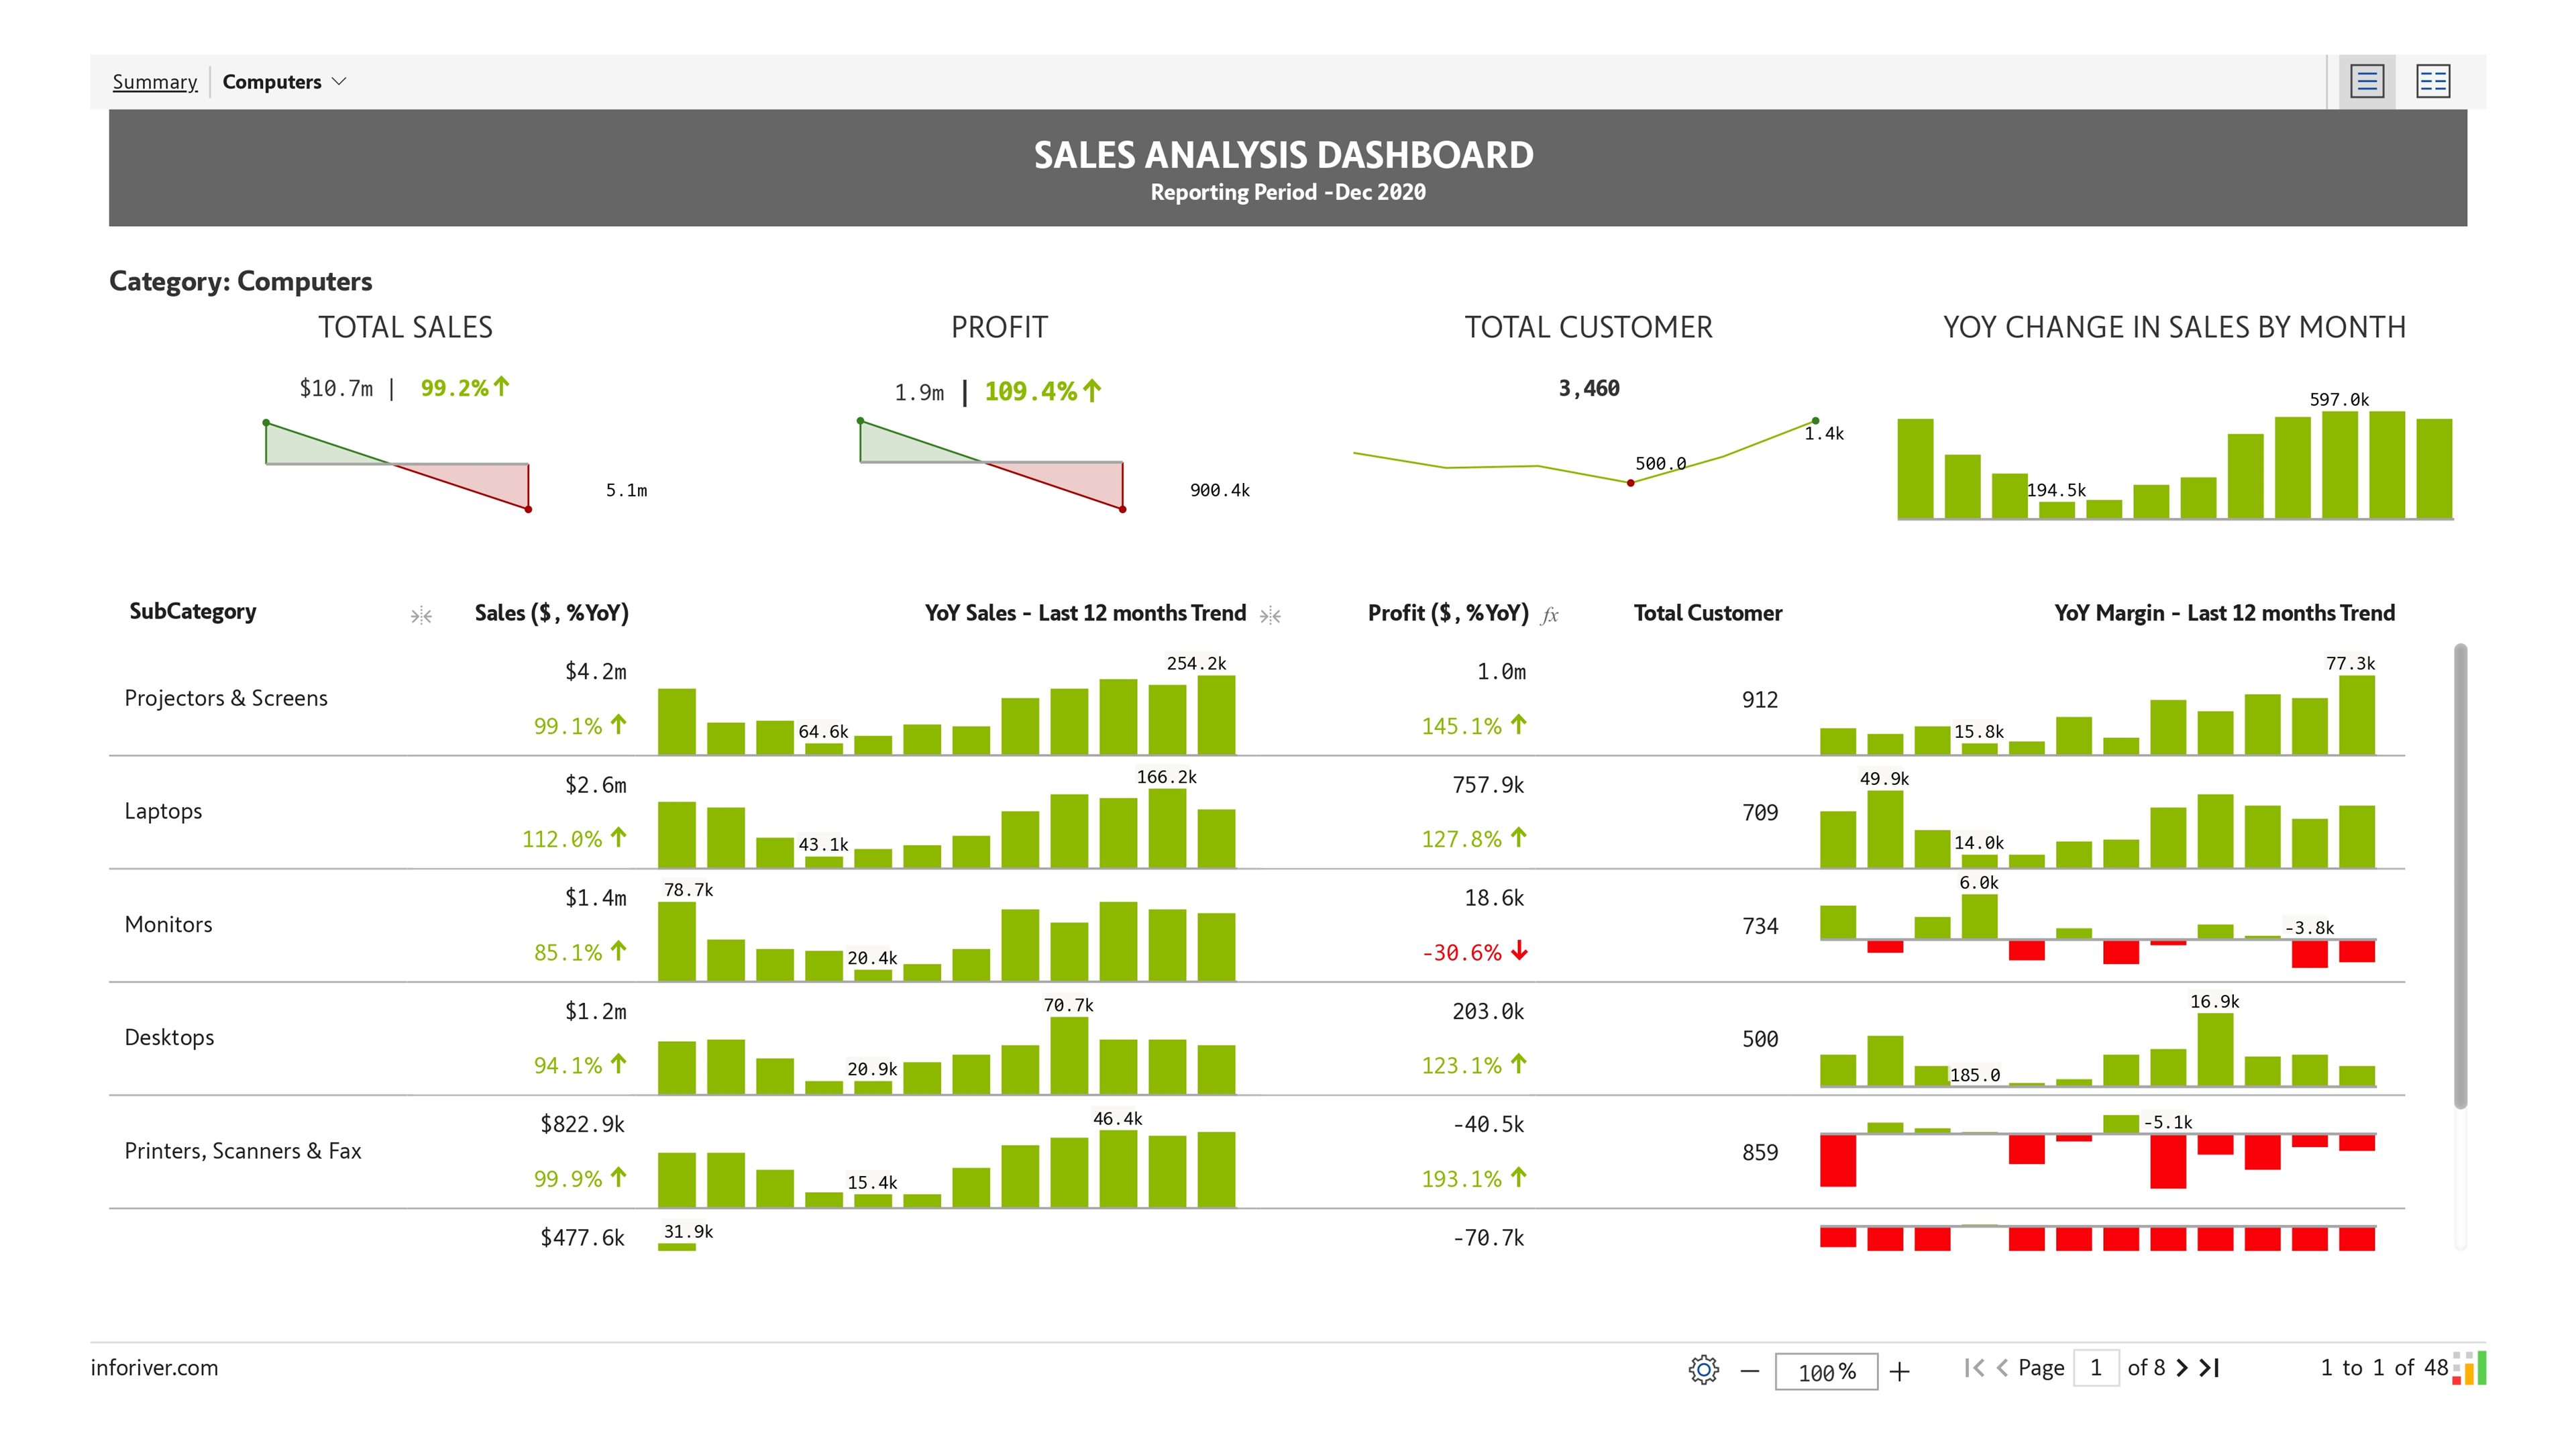
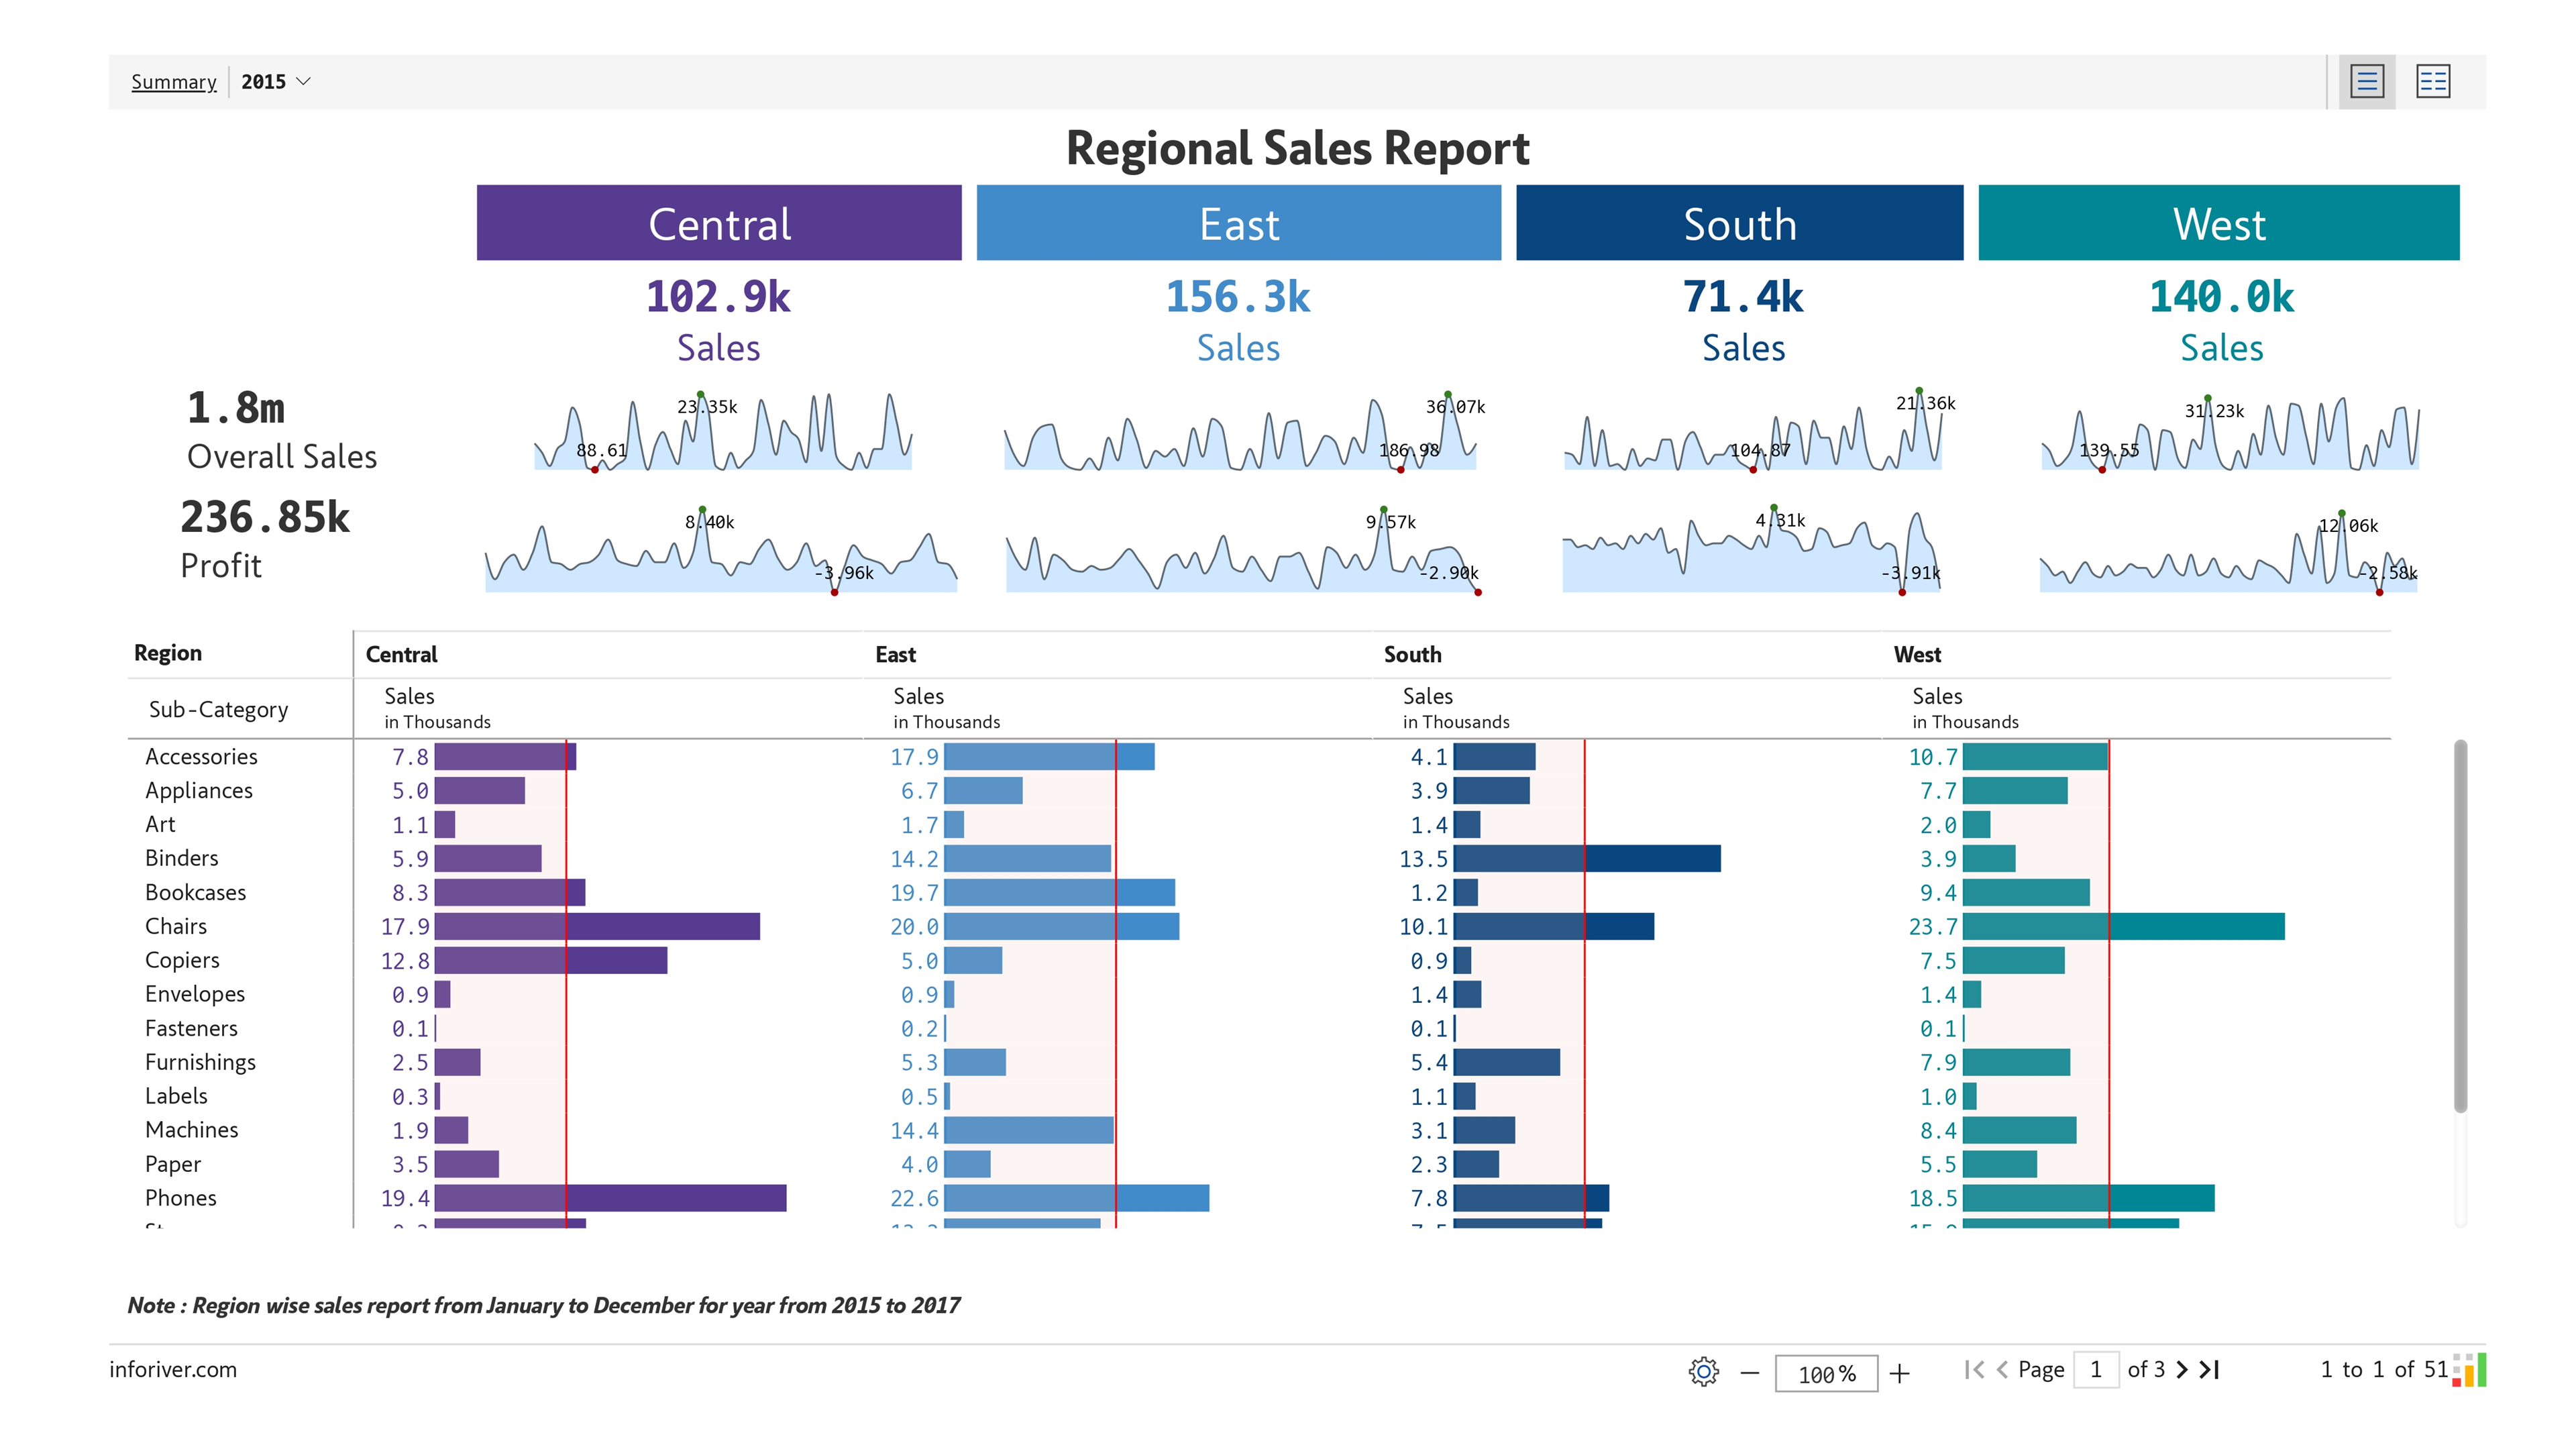
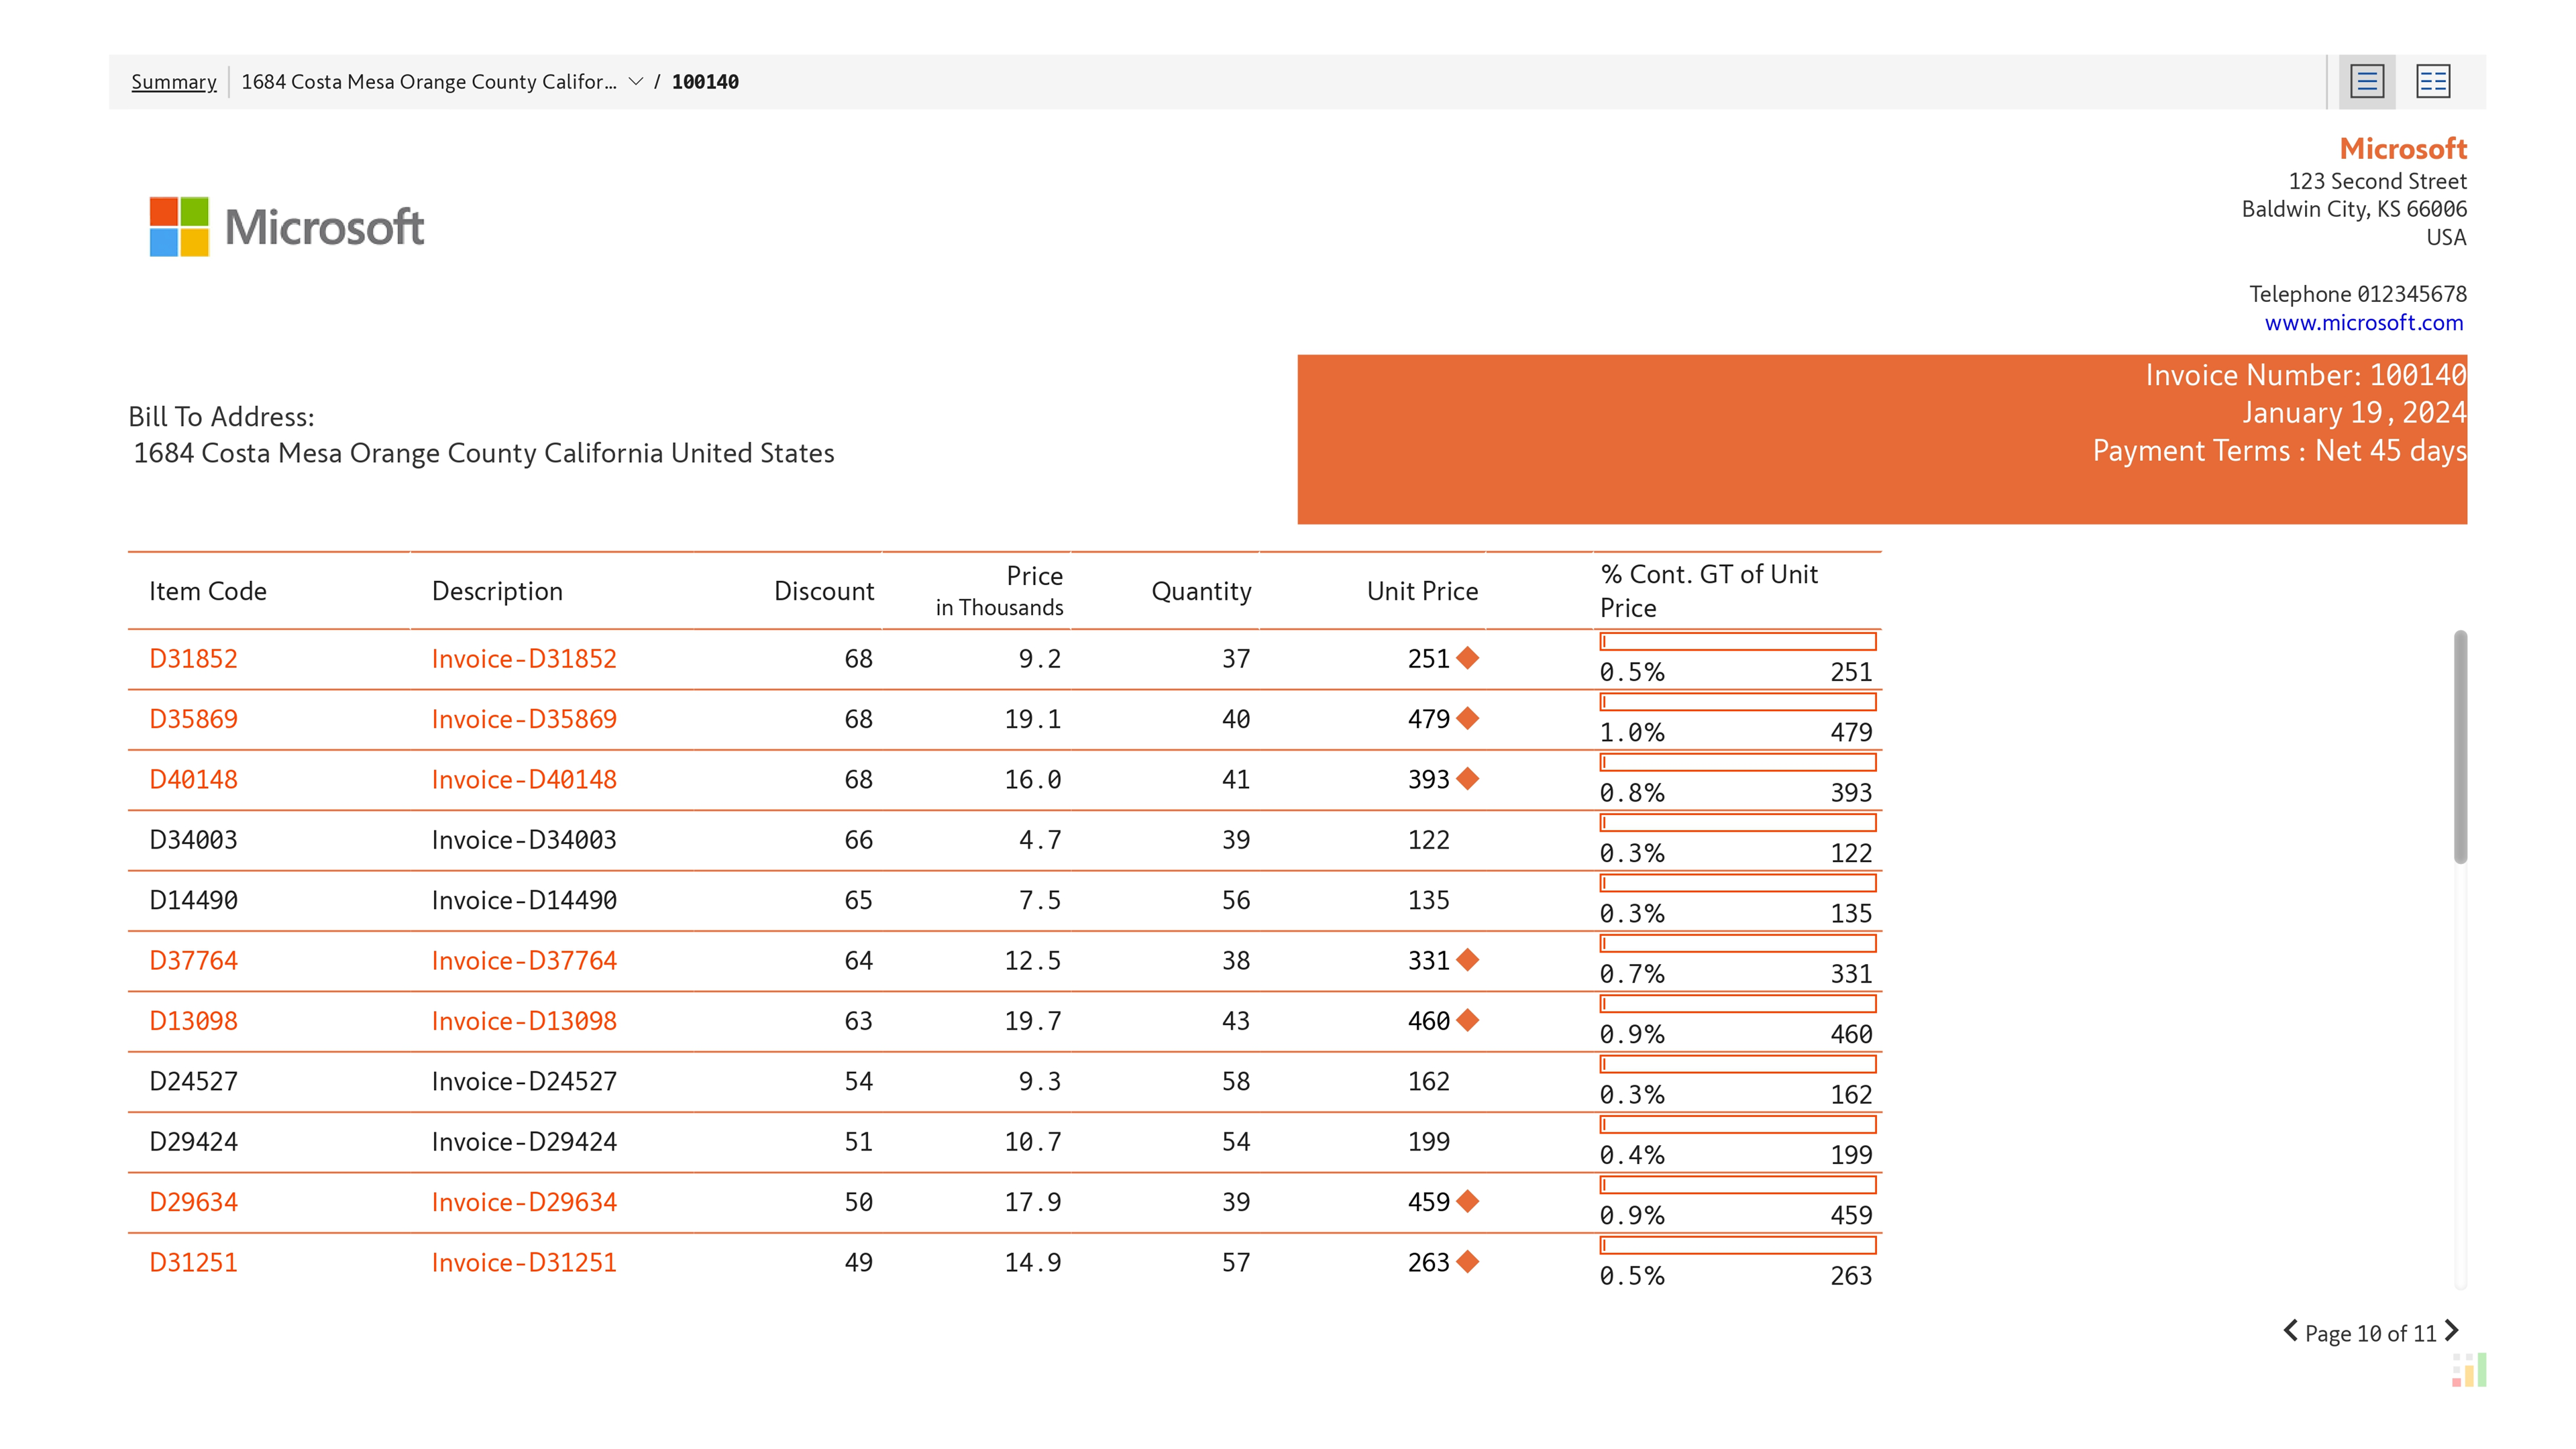
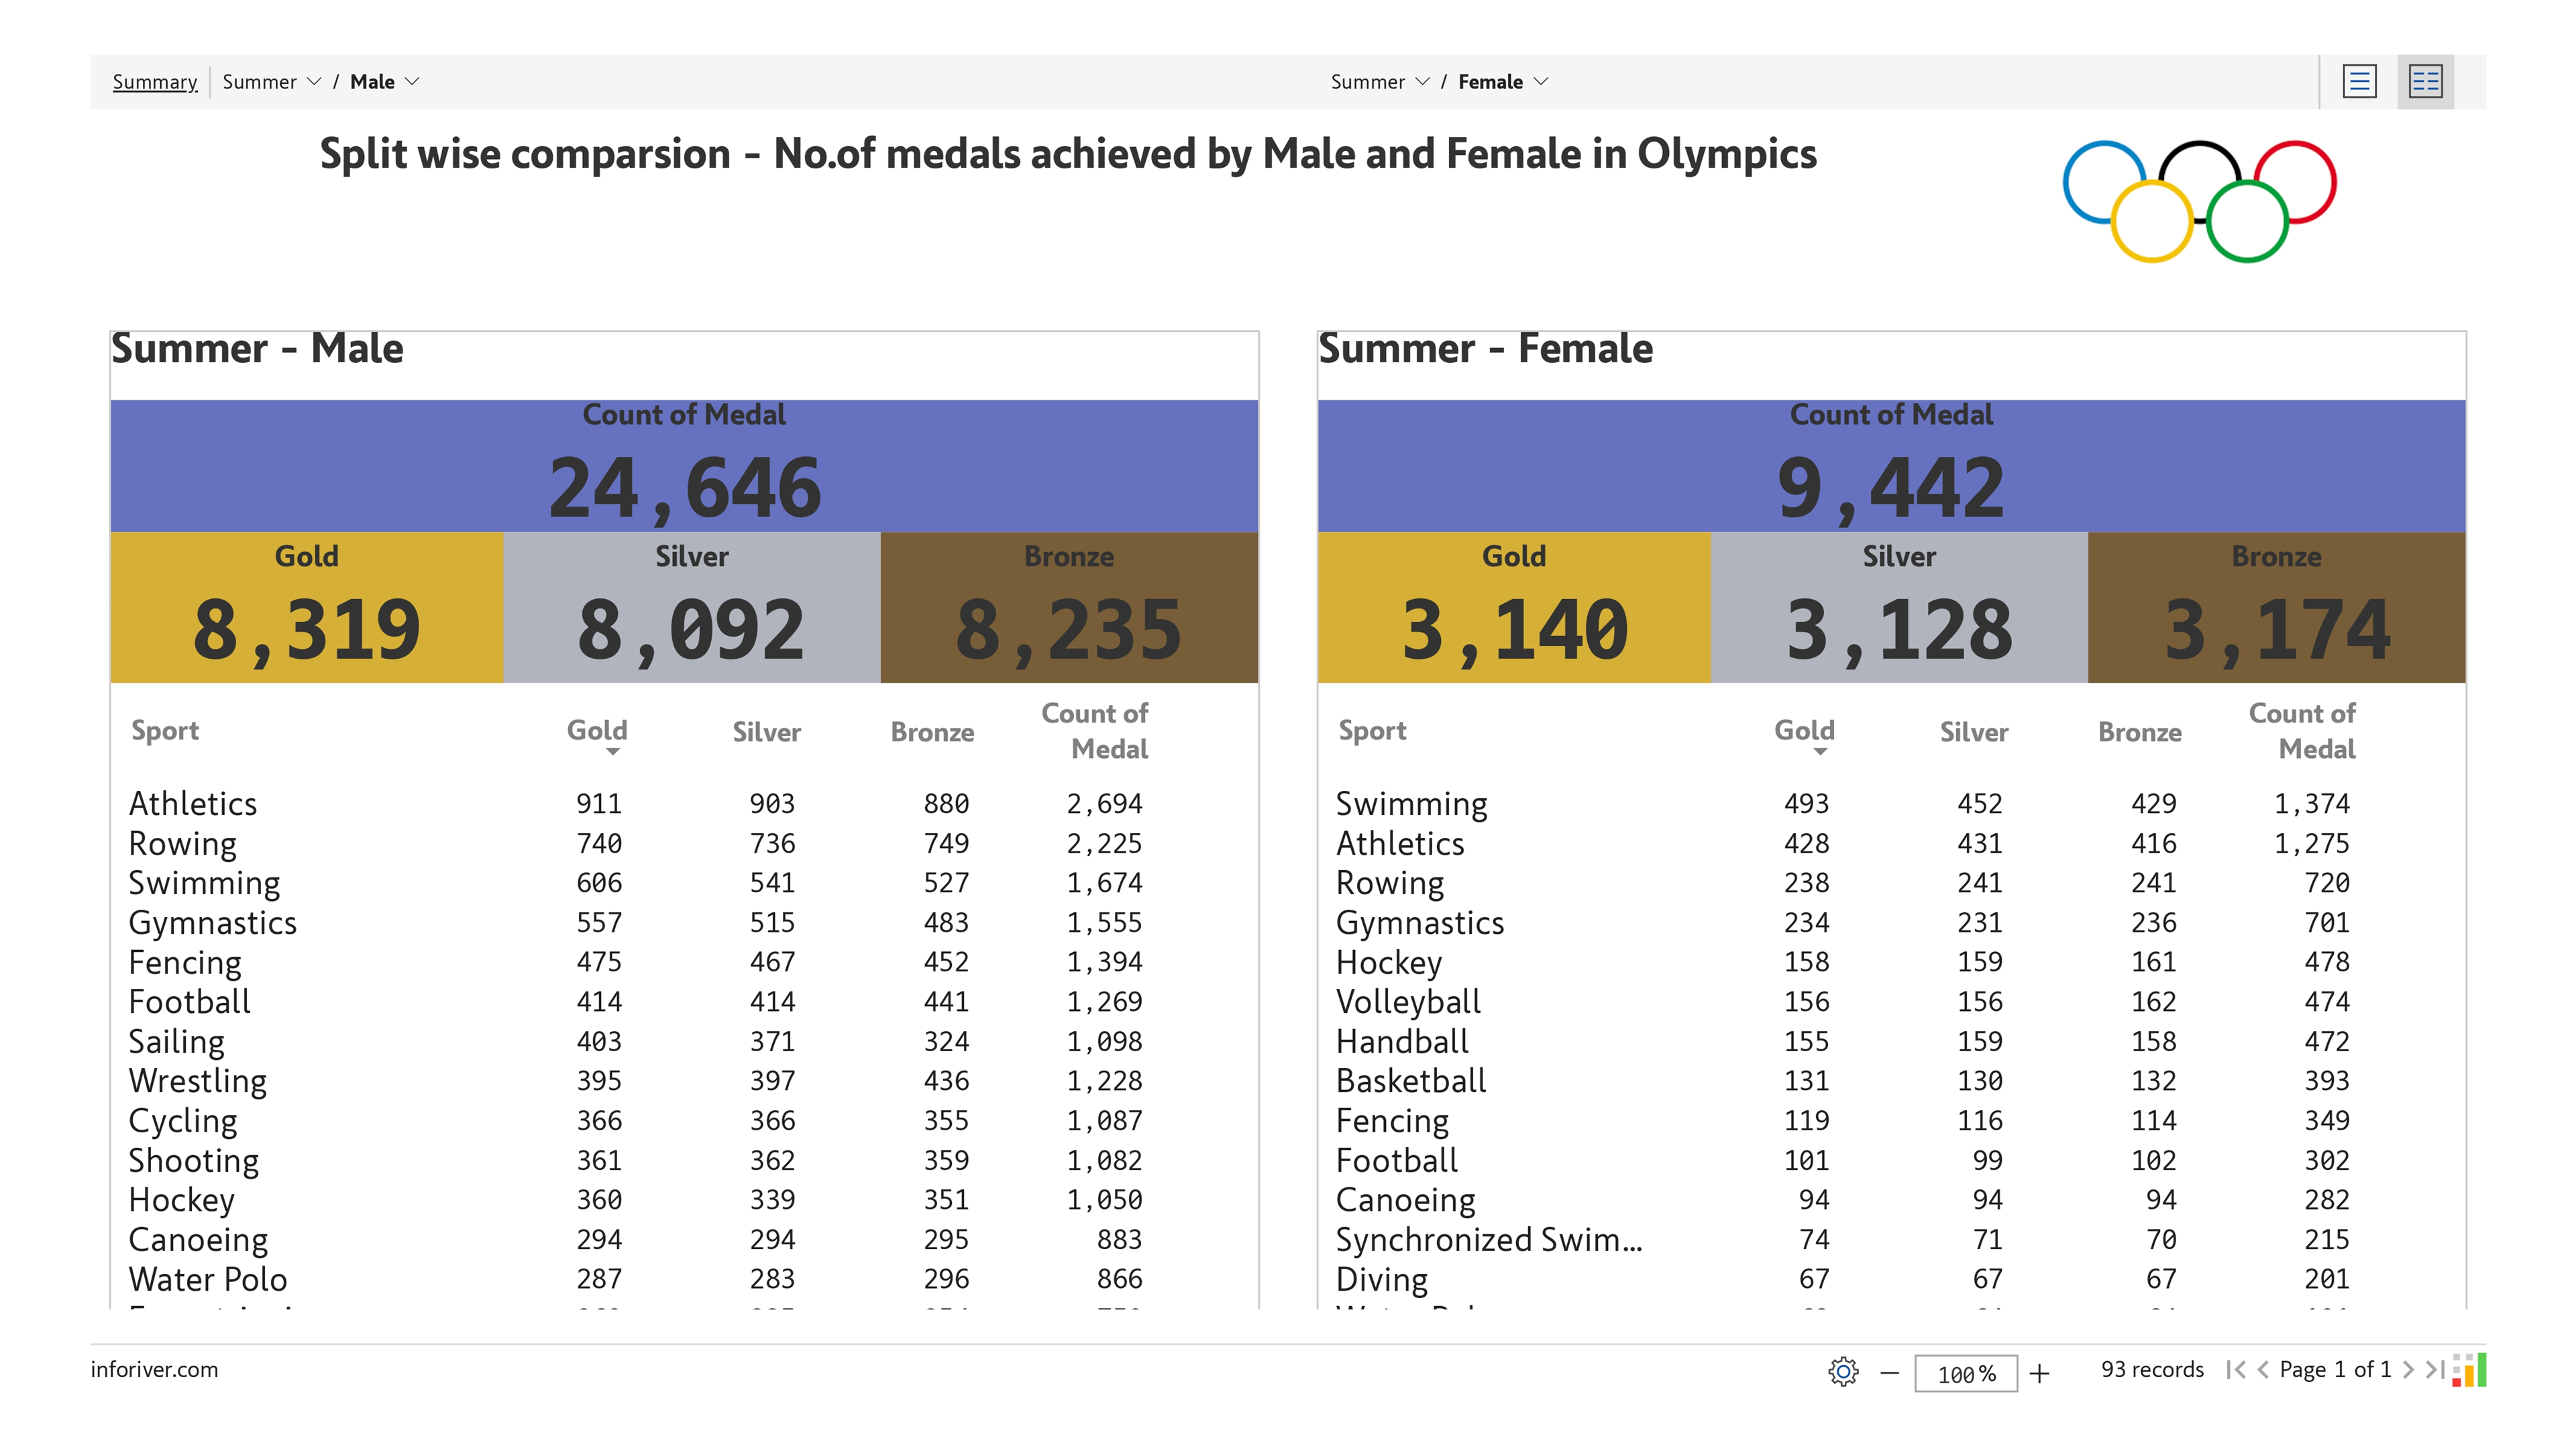
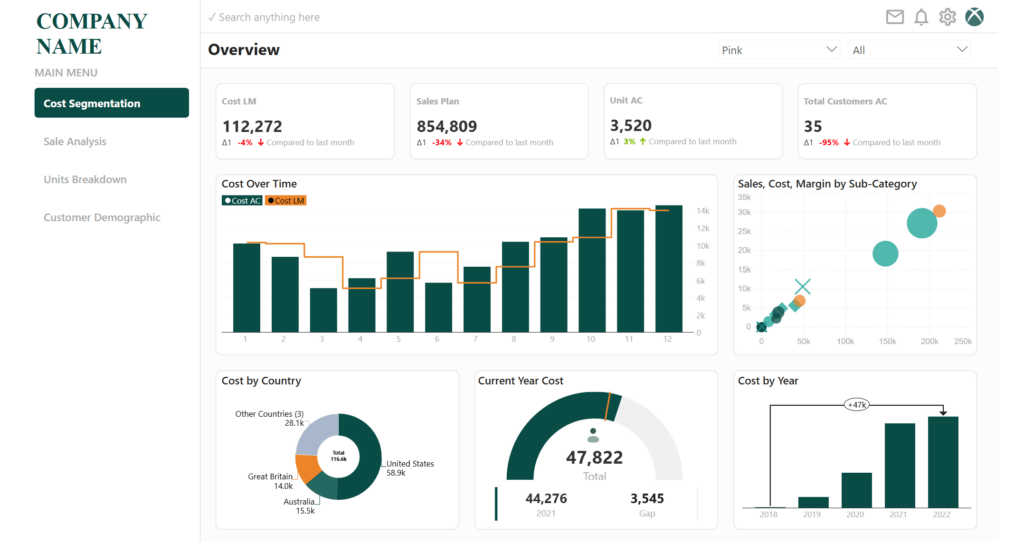
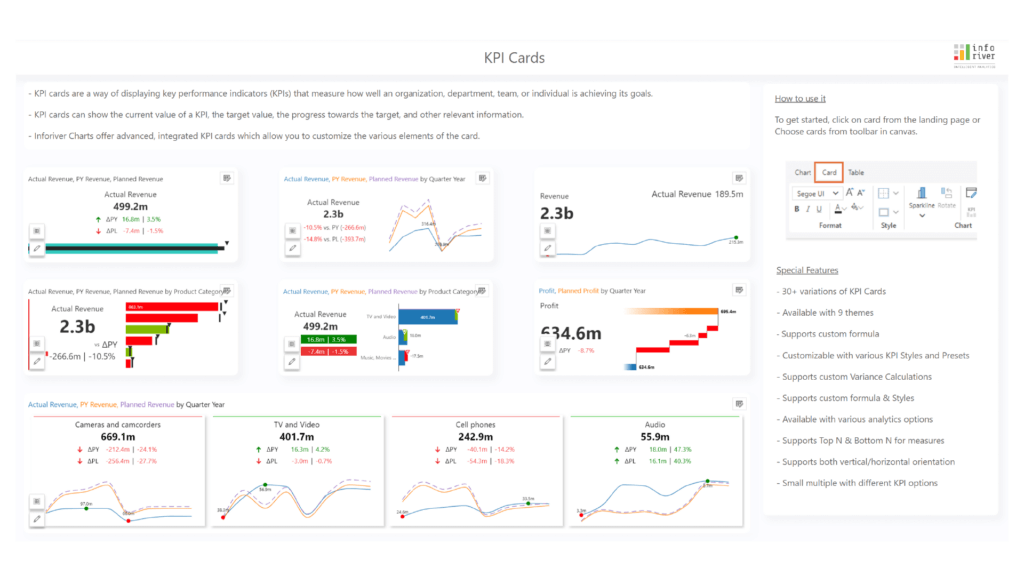
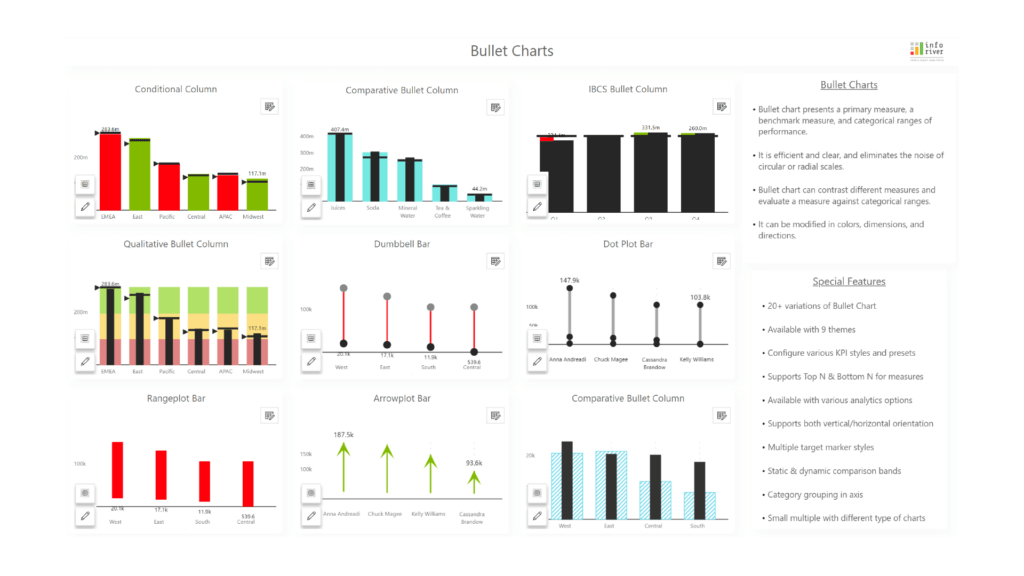
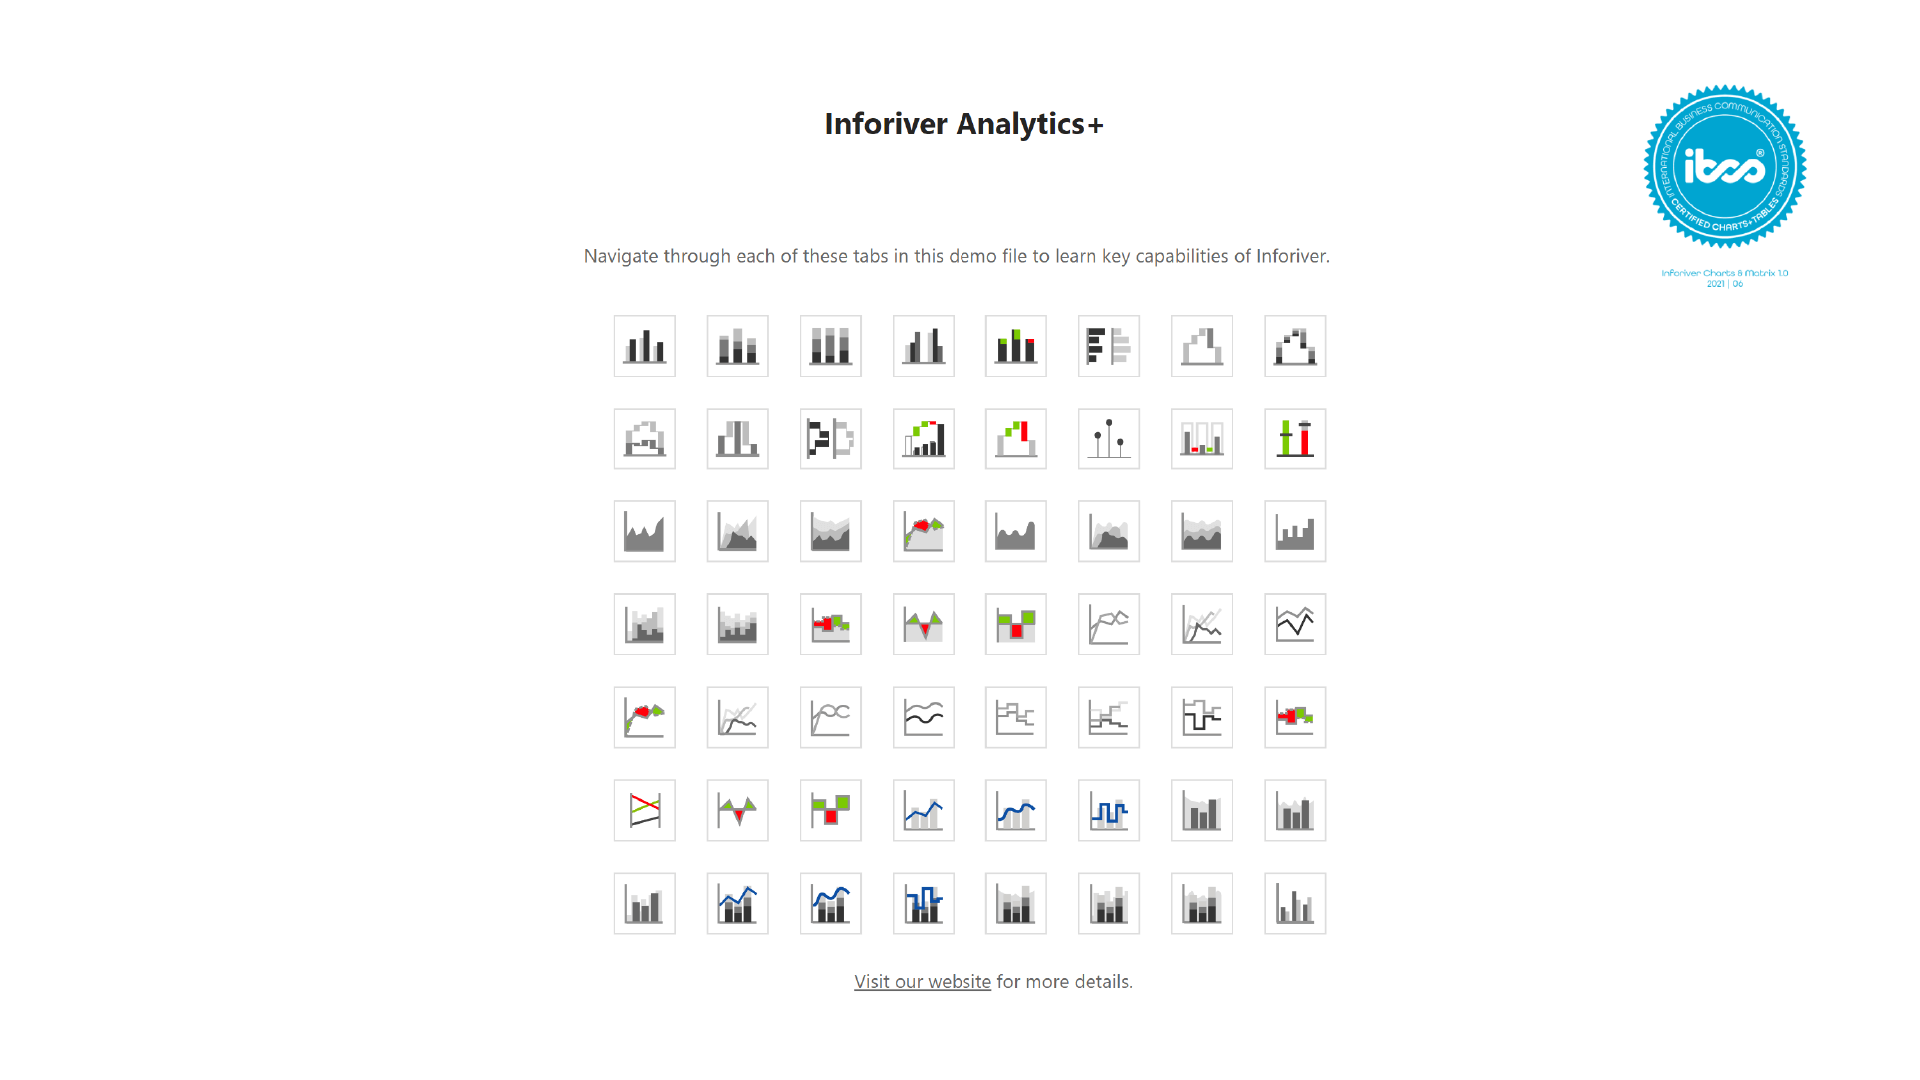
Inforiver Analytics+ is a 3-in-1 visual for dashboards and storyboards delivering 100+ charts, KPI cards, and tables. It offers powerful capabilities such as a visual pivot table for hierarchical data on all three axes (x,y,z) like Spotfire, small multiple for all charts like Tableau and Spotfire, split and group measures into small multiple panels like Tableau, flexible chart combinations in small multiples like Tableau, small-multiple tables with Excel-like formatting and more.
to try advance features
[demo_download_modal title="Inforiver Analytics+ for Power BI – Introduction Demo" link="https://inforiver.com/wp-content/uploads/Introduction-demo-analytics.zip"]
Inforiver helps enterprises consolidate planning, reporting & analytics on a single platform (Power BI). The no-code, self-service award-winning platform has been recognized as the industry’s best and is adopted by many Fortune 100 firms.
Inforiver is a product of Lumel, the #1 Power BI AppSource Partner. The firm serves over 3,000 customers worldwide through its portfolio of products offered under the brands Inforiver, EDITable, ValQ, and xViz.