Upcoming webinar on 'Inforiver Charts : The fastest way to deliver stories in Power BI', Aug 29th , Monday, 10.30 AM CST. Register Now
Upcoming webinar on 'Inforiver Charts : The fastest way to deliver stories in Power BI', Aug 29th , Monday, 10.30 AM CST. Register Now
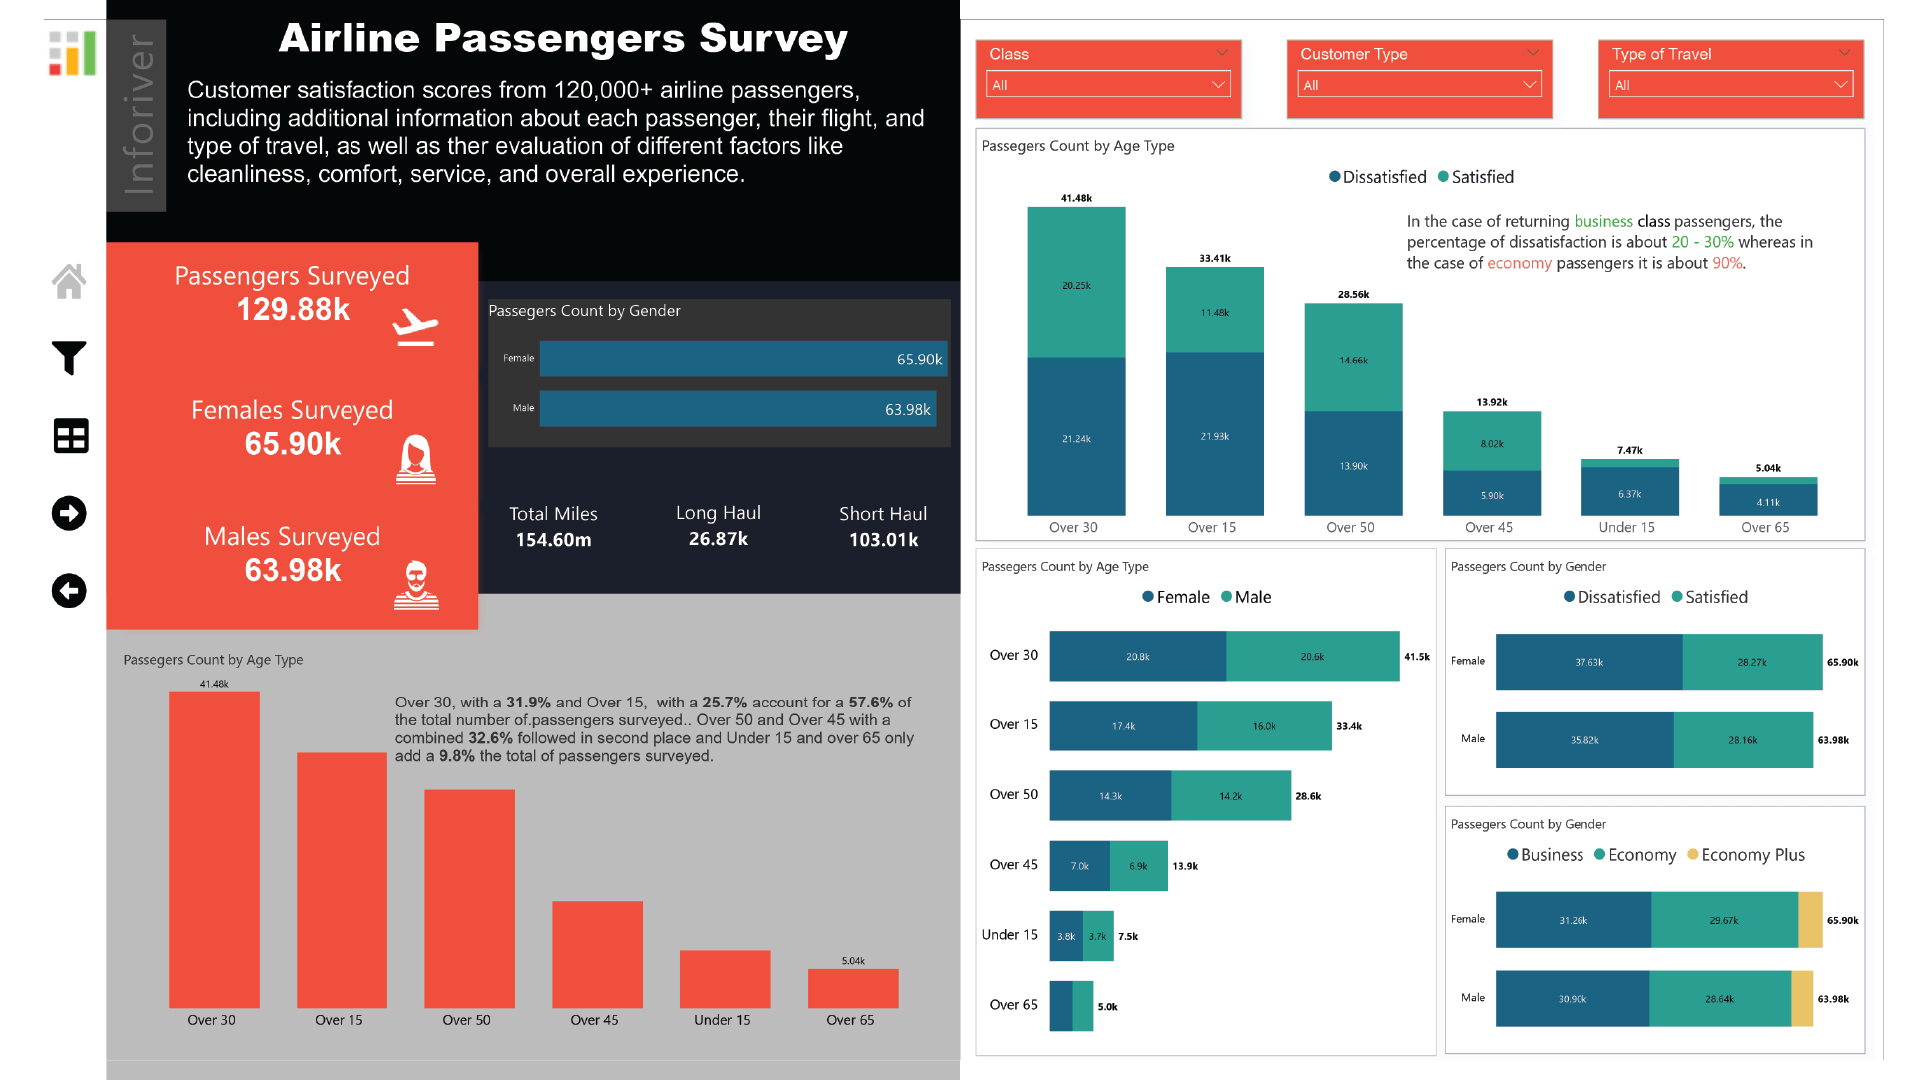
This data dashboard provides a visual representation of airline passengers based on gender, flight type and short/long haul flights. The passenger rating across services is analyzed using a heatmap, which provides a clear and concise overview of the overall passenger experience. The dashboard is intended to provide insights into passenger preferences and behaviors, and can be used to inform decision-making and improve the overall passenger experience.
to try advance features
[demo_download_modal title="Airline Passengers Survey" link="https://inforiver.com/wp-content/uploads/inforiver-airline-passenger-demo.zip"]
Inforiver helps enterprises consolidate planning, reporting & analytics on a single platform (Power BI). The no-code, self-service award-winning platform has been recognized as the industry’s best and is adopted by many Fortune 100 firms.
Inforiver is a product of Lumel, the #1 Power BI AppSource Partner. The firm serves over 3,000 customers worldwide through its portfolio of products offered under the brands Inforiver, EDITable, ValQ, and xViz.