Upcoming webinar on 'Inforiver Charts : The fastest way to deliver stories in Power BI', Aug 29th , Monday, 10.30 AM CST. Register Now
Upcoming webinar on 'Inforiver Charts : The fastest way to deliver stories in Power BI', Aug 29th , Monday, 10.30 AM CST. Register Now
The March 2024 – 3.6 release for Analytics+ is a small yet impactful release that introduces two important features: visualizing variances with integrated column charts for tables and creating visual-level rows with the calculated row feature.
Let’s dive in!
Since tabular data has higher information density, adding visualizations enable report users to grasp insights quickly. If your tables have two measures, you can visualize variances by selecting the AC measure and inserting an integrated column chart.
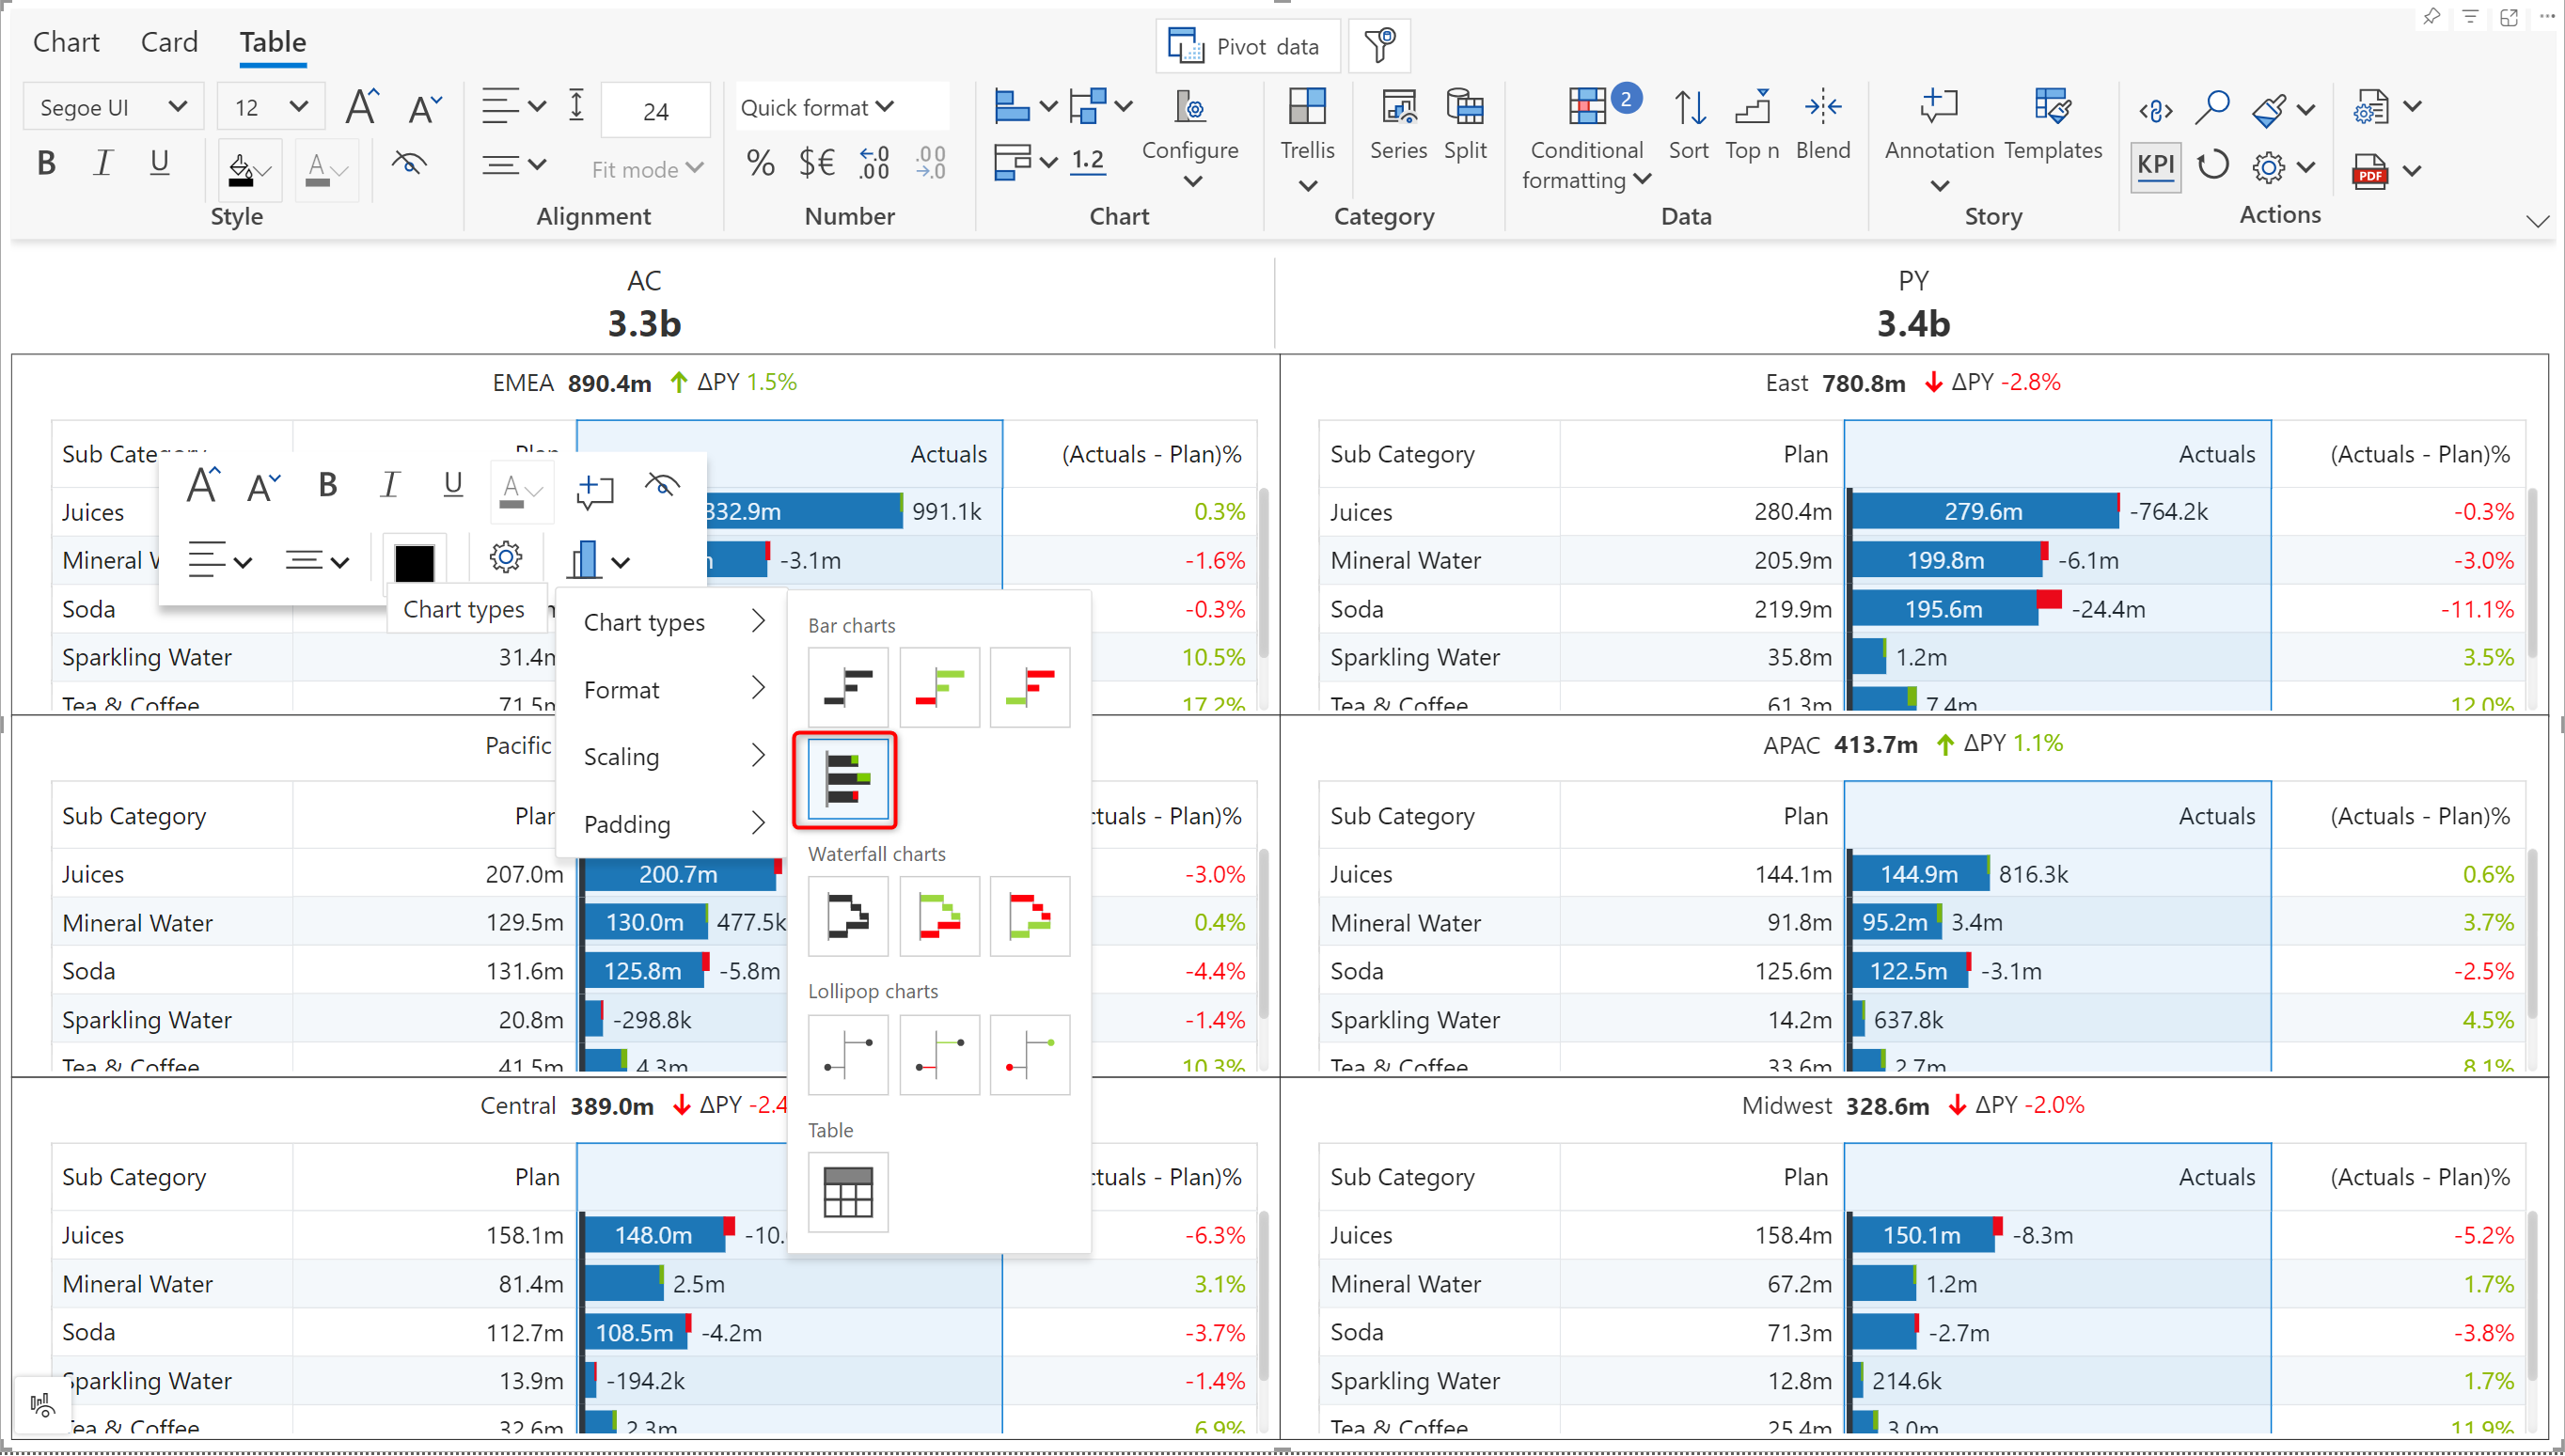
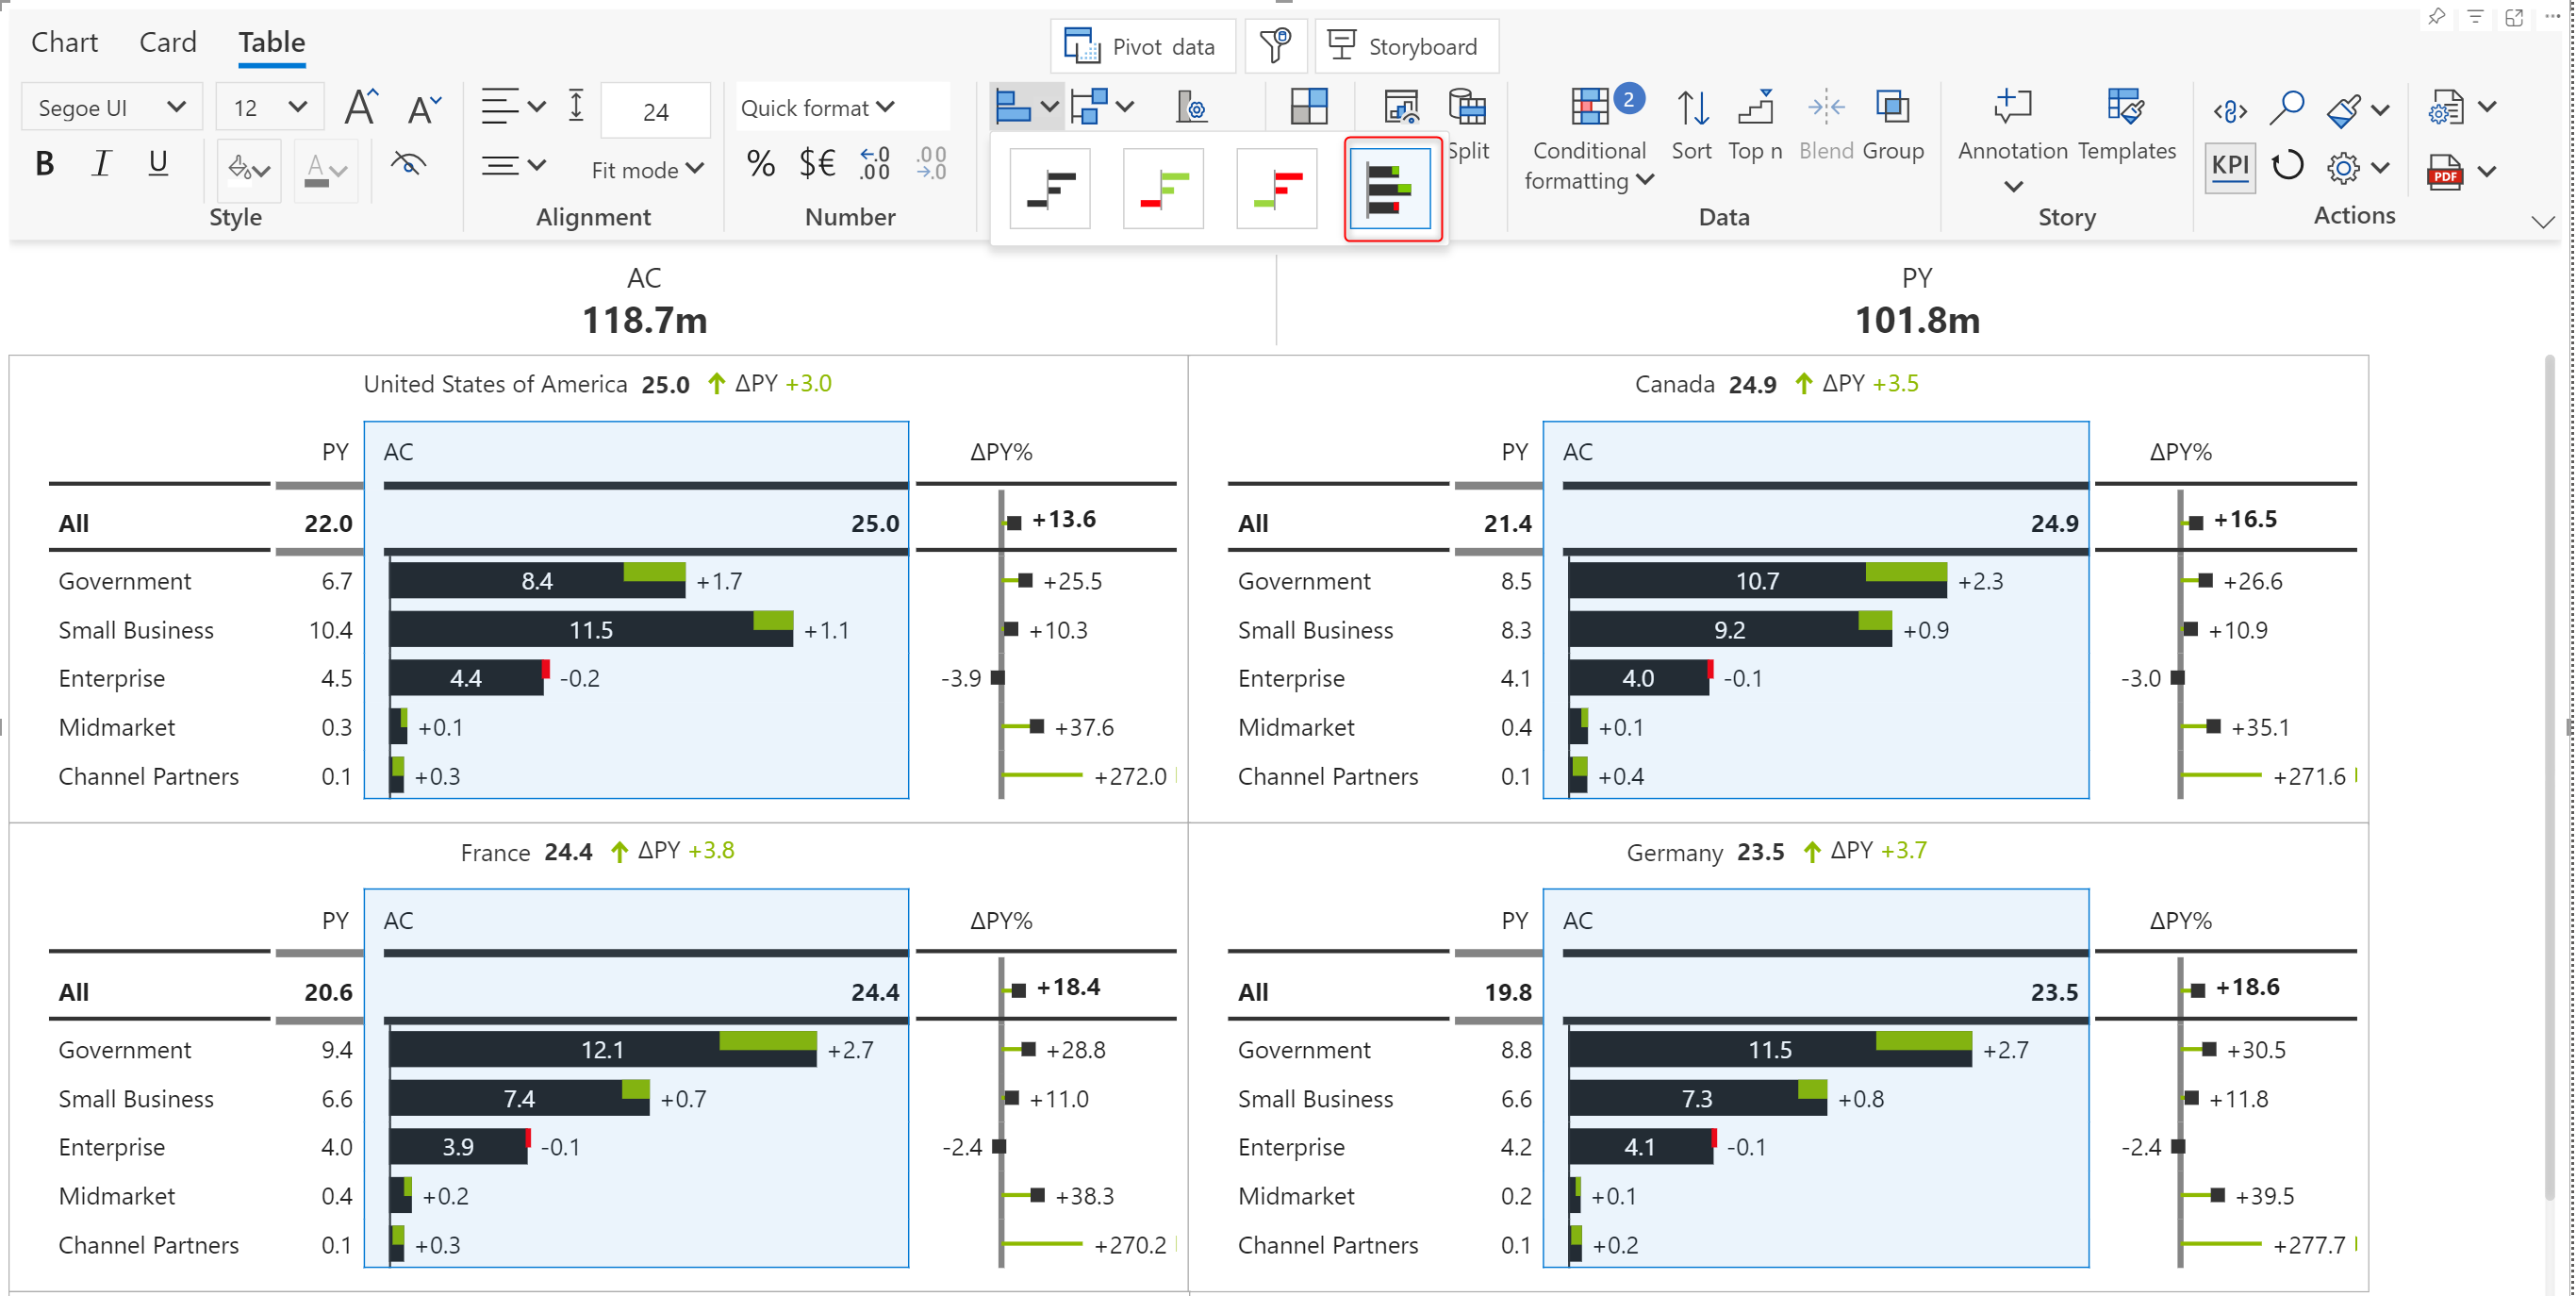
Analytics+ offers IBCS templates with embedded charts that you can render in a single click. With the latest release, you can select the AC measure and change the bar chart to an integrated variance chart. This applies to the T05 IBCS template.
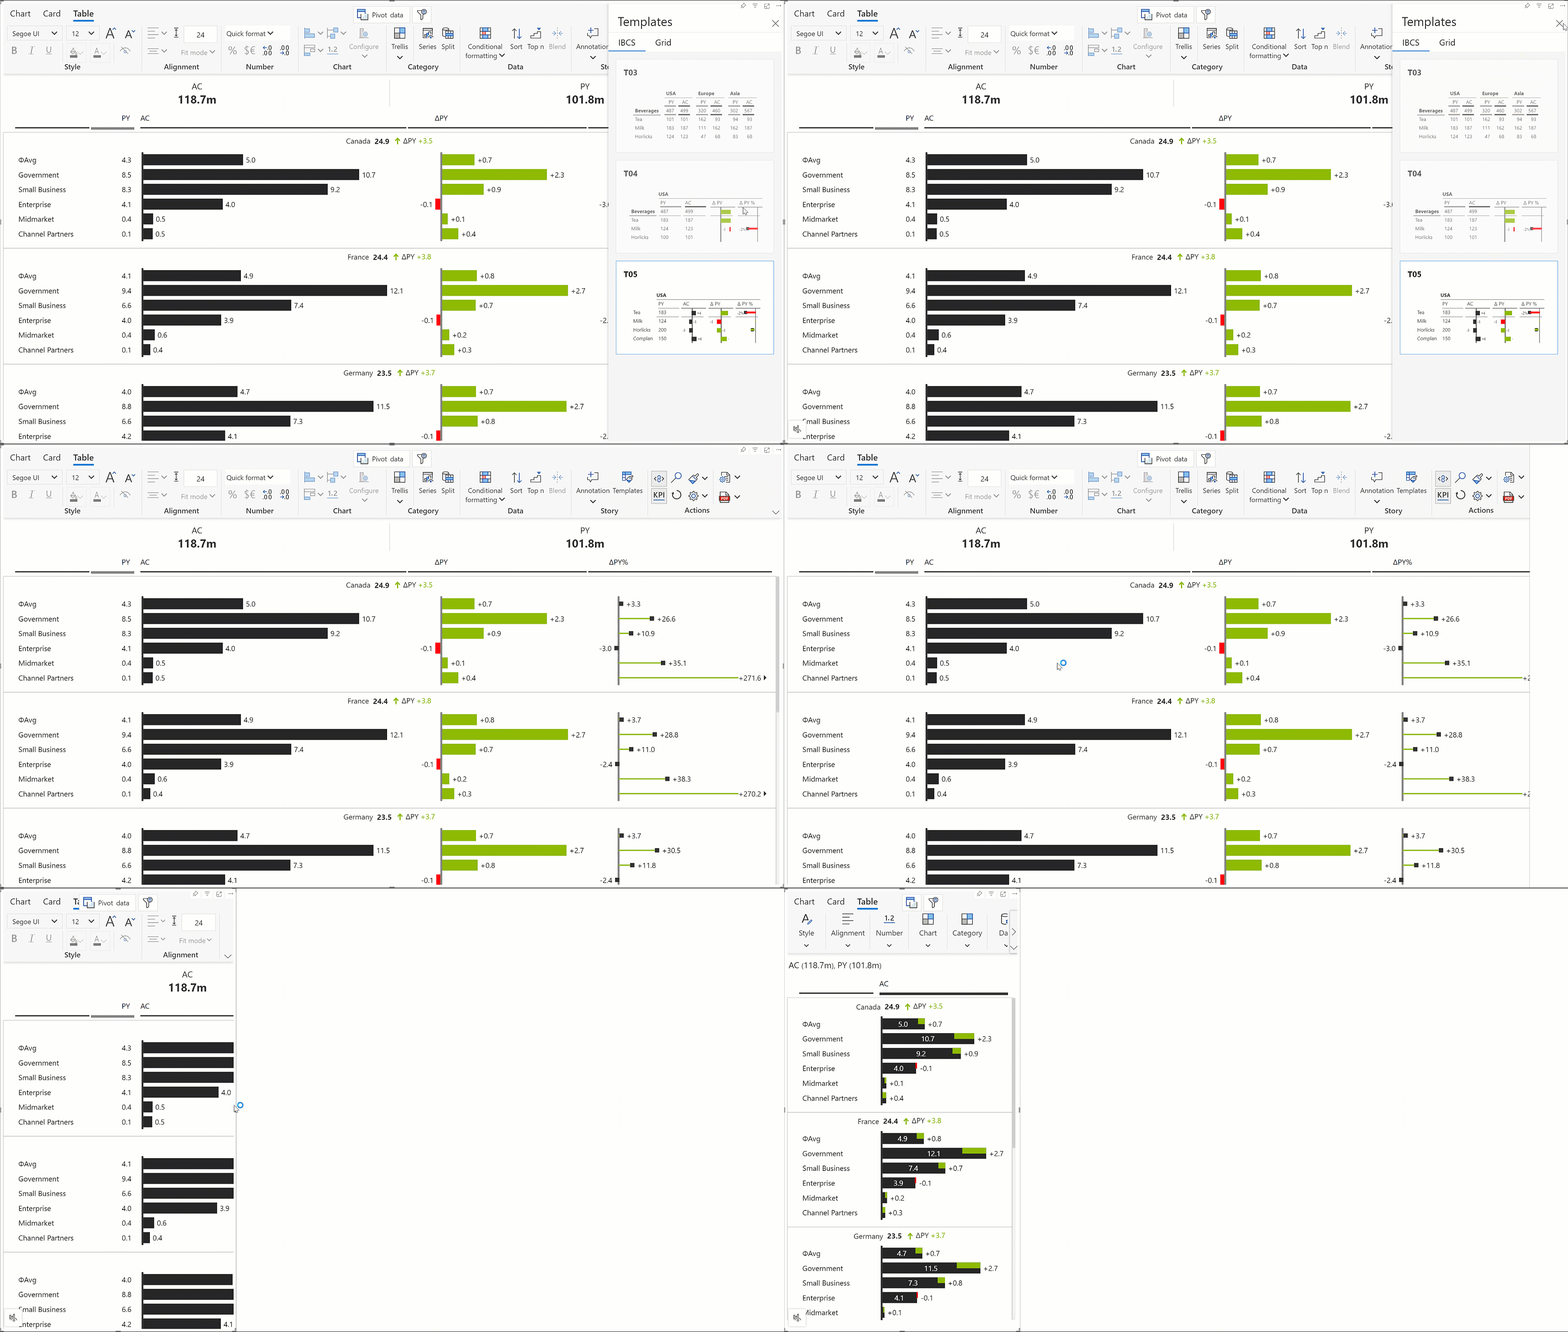
Analytics+ visuals are highly responsive, with the ability to adjust the font, spacing, and even dynamically update charts on resizing the canvas. When the trellis layout is set to Single column with the IBCS T05 template, on resizing the canvas, the AC chart is automatically converted to integrated variance column.
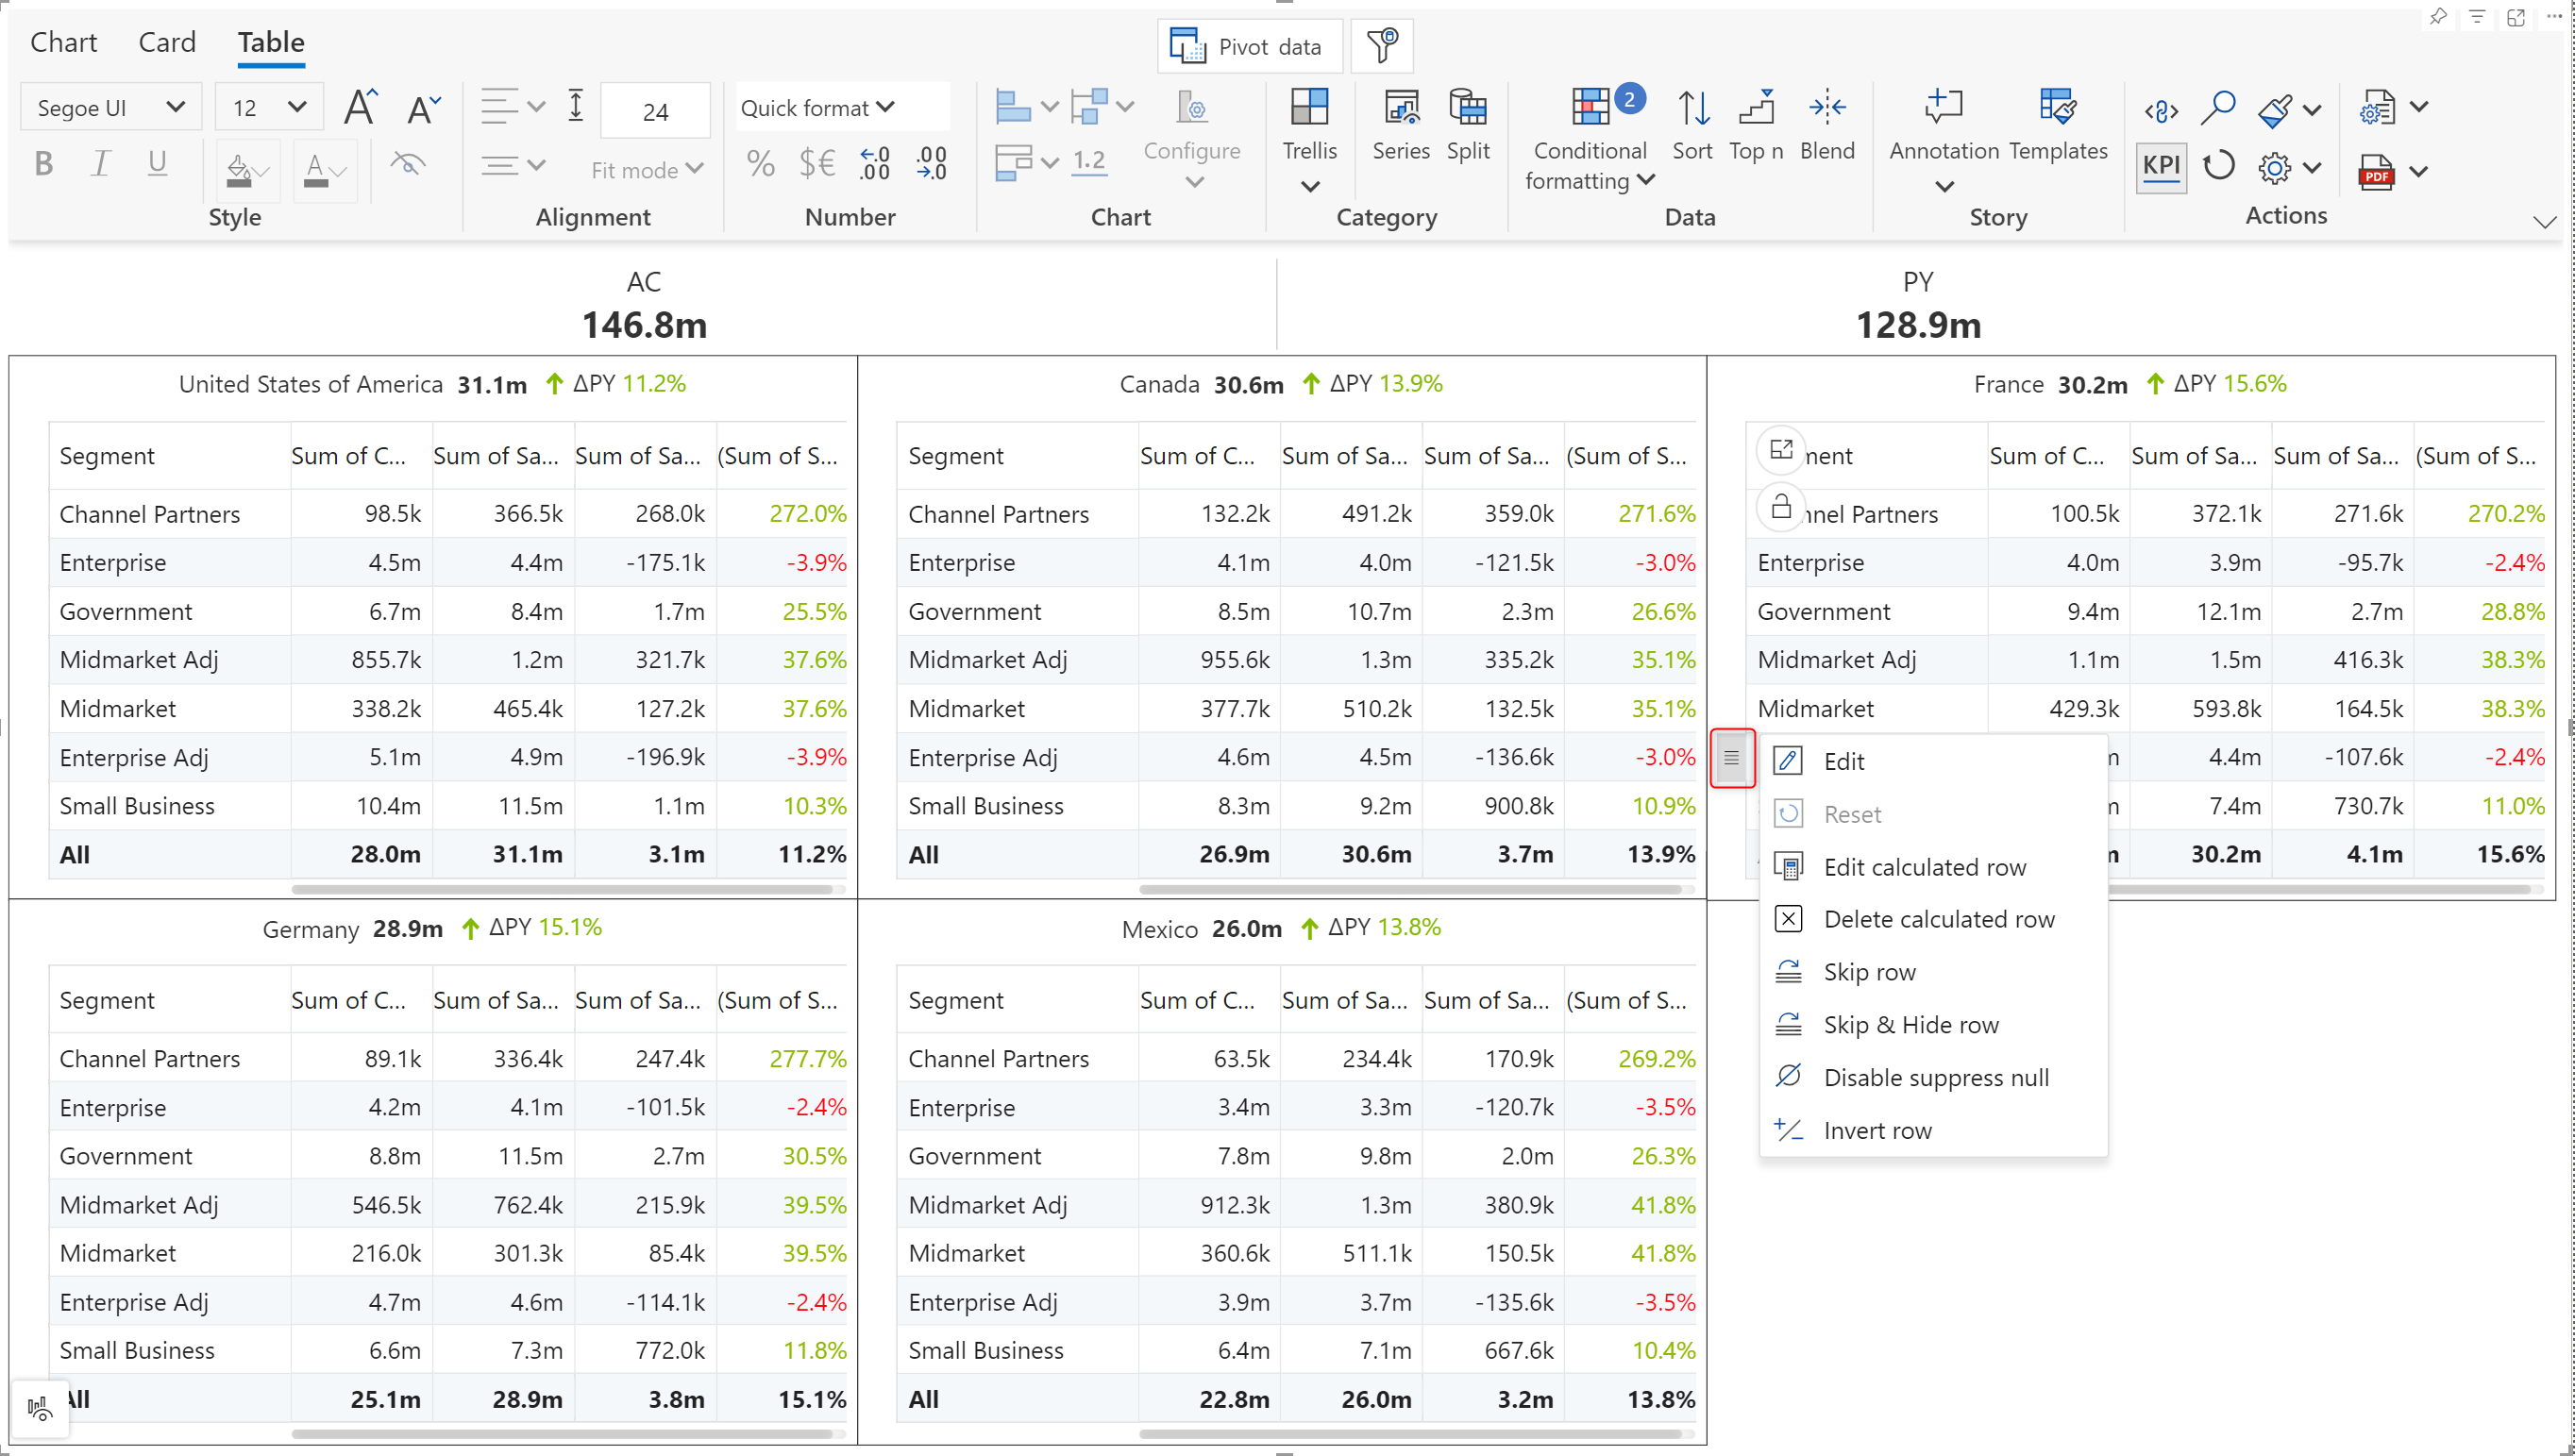
With Analytics+ you can create calculated rows and seamlessly insert new categories at the visual level without modifying the underlying dataset. In the 3.6. release, you can use the row gripper in summary tables or in table mode to insert calculated rows.
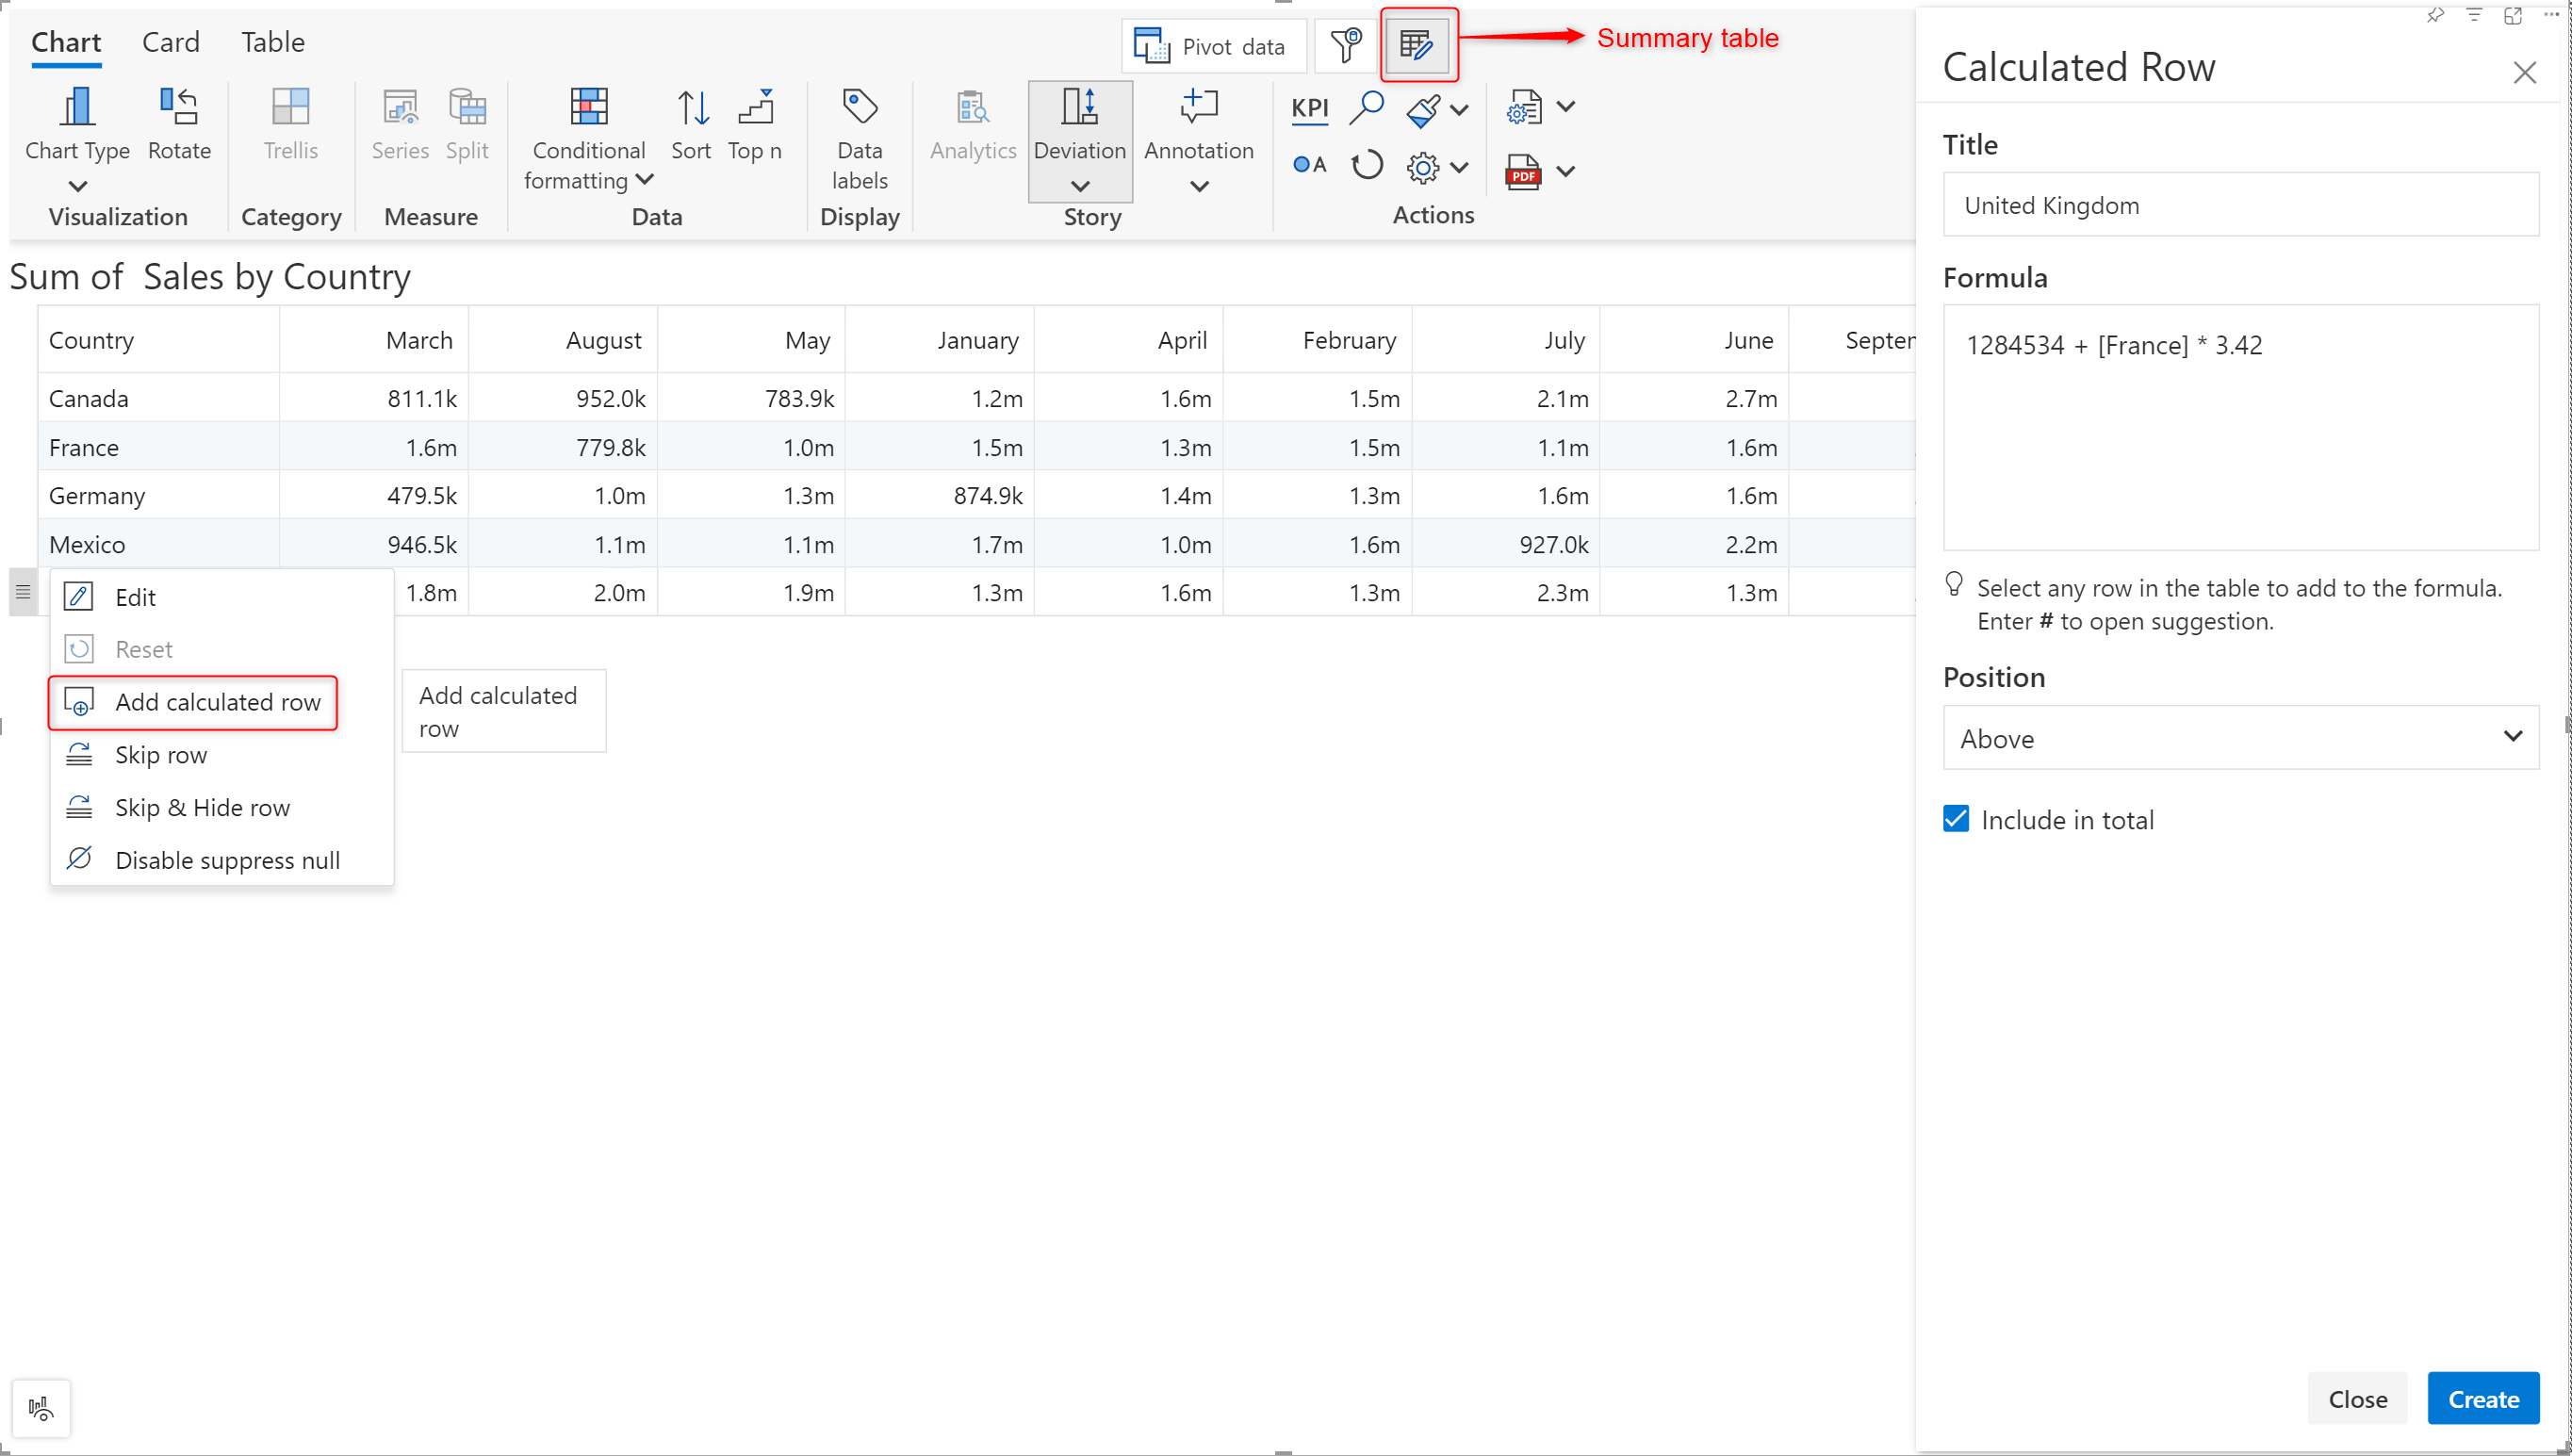
Notice how the calculated row is immediately reflected when we switch back to chart mode.
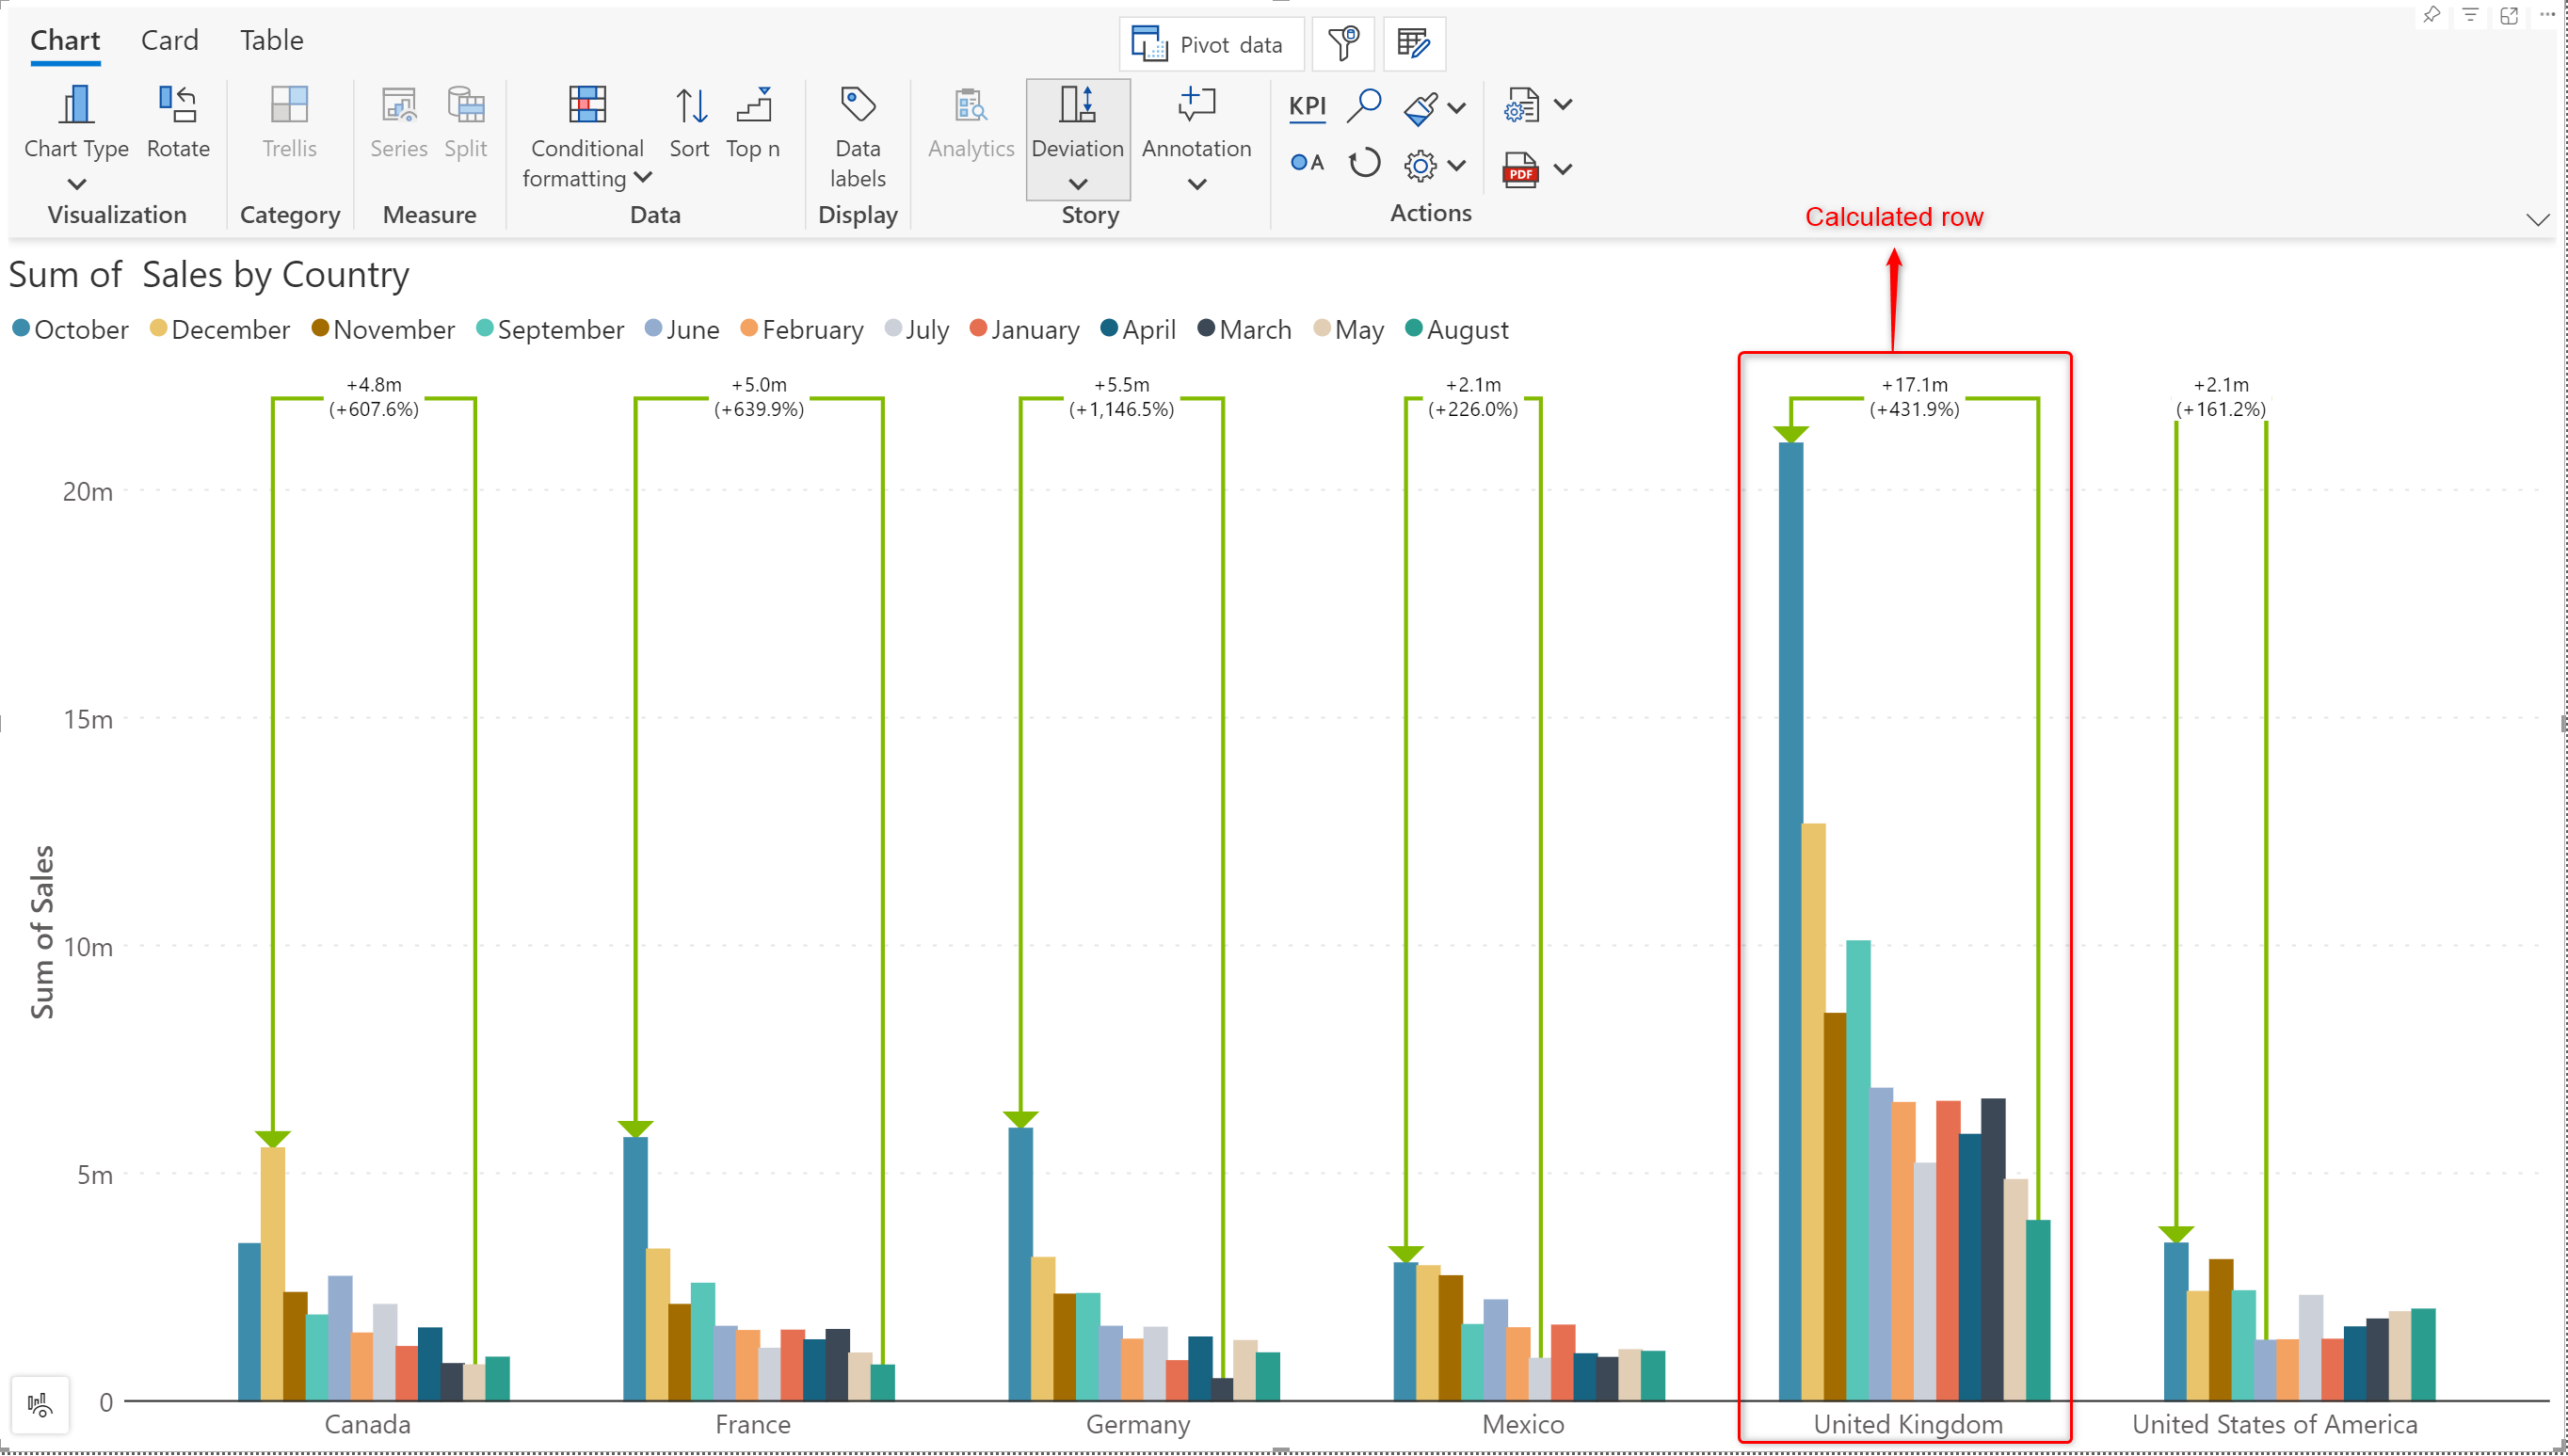
You can edit, delete, invert, skip and hide calculated rows directly from the row gripper.
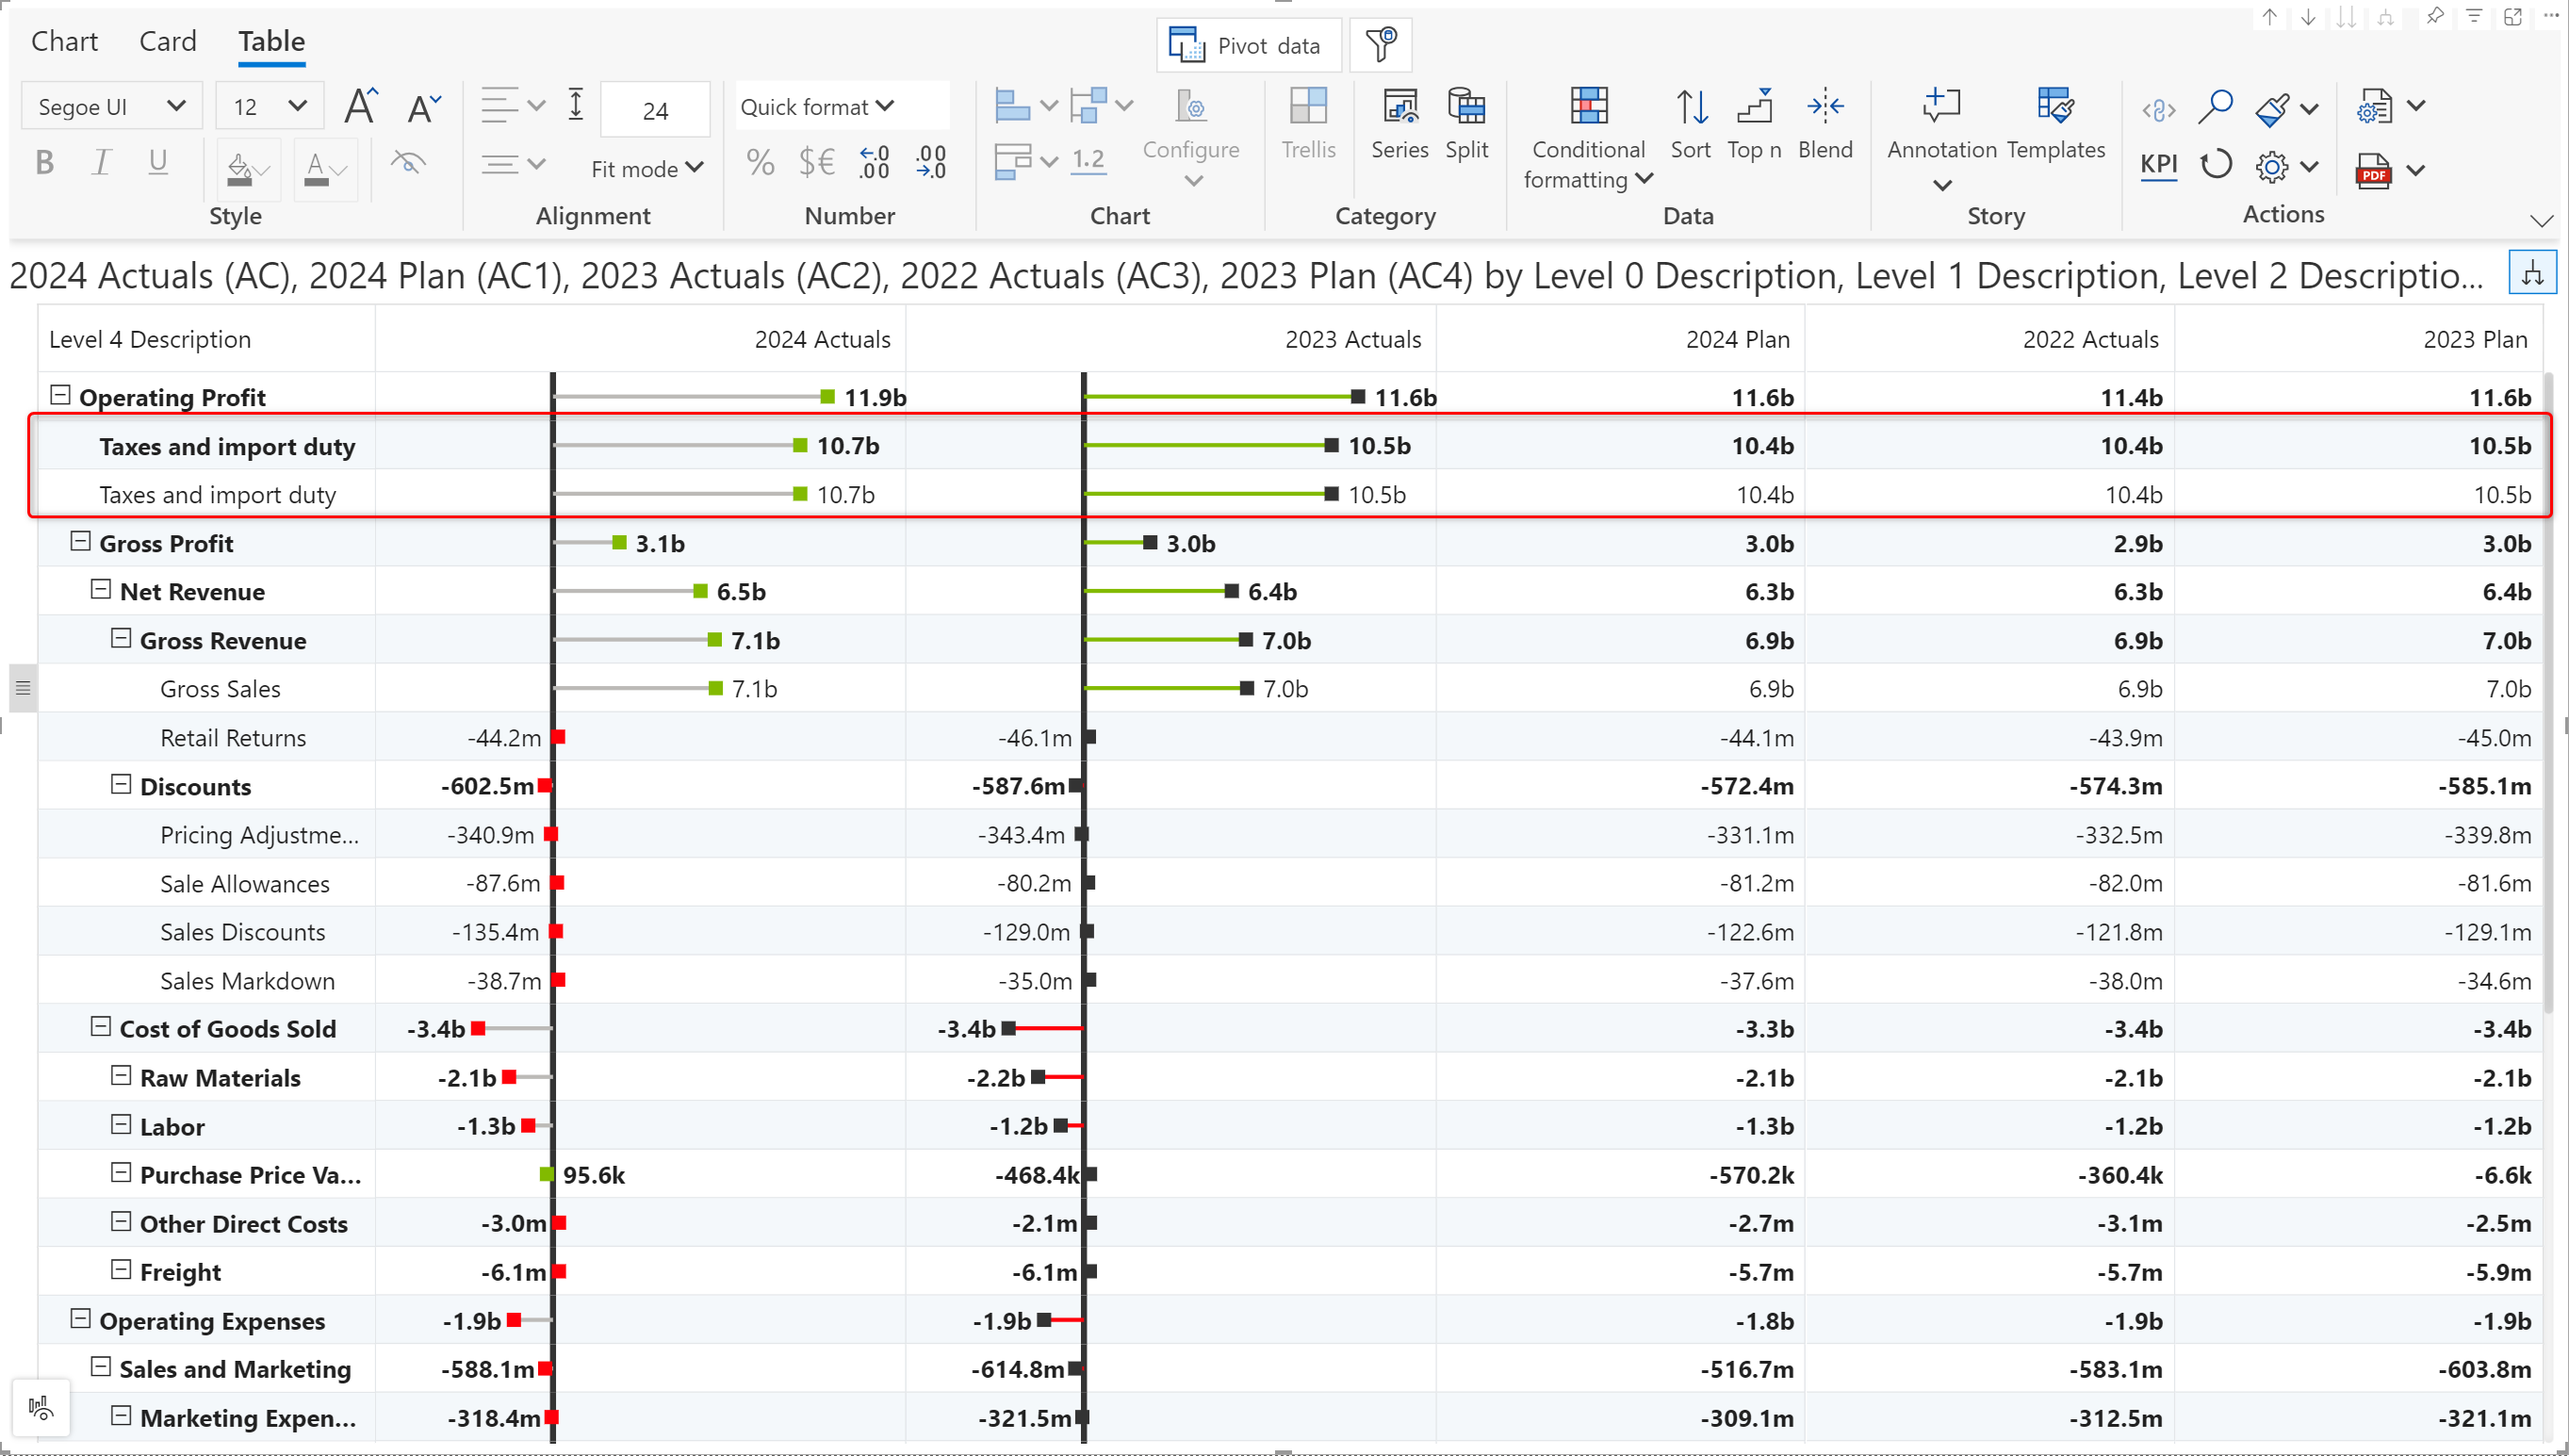
Analytics+ is built with inherent support for hierarchies. You can create calculated rows at the parent level too. Analytics+ will automatically create a child row when a calculated row is inserted at parent level.
If you have any questions about the new release or need assistance, feel free to reach out to us.
The refinements that we continuously make to Analytics+ were made possible with your support and feedback. We look forward to receiving your suggestions and have many more exciting innovations lined up! Visit the Inforiver Community to share your ideas, vote on other submissions, and interact with other users.
Inforiver helps enterprises consolidate planning, reporting & analytics on a single platform (Power BI). The no-code, self-service award-winning platform has been recognized as the industry’s best and is adopted by many Fortune 100 firms.
Inforiver is a product of Lumel, the #1 Power BI AppSource Partner. The firm serves over 3,000 customers worldwide through its portfolio of products offered under the brands Inforiver, EDITable, ValQ, and xViz.