Upcoming webinar on 'Inforiver Charts : The fastest way to deliver stories in Power BI', Aug 29th , Monday, 10.30 AM CST. Register Now
Upcoming webinar on 'Inforiver Charts : The fastest way to deliver stories in Power BI', Aug 29th , Monday, 10.30 AM CST. Register Now
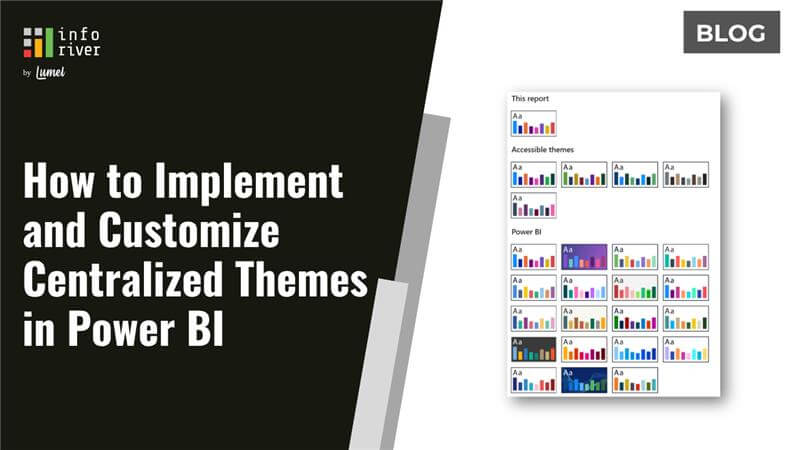
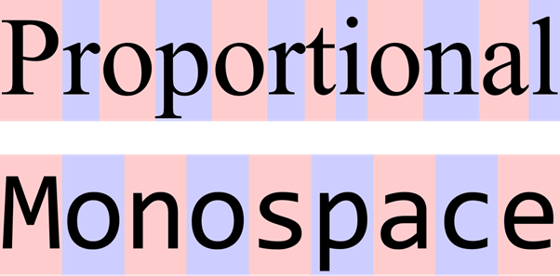
Power BI makes it easy for every department to create reports, but without shared standards, the results are often filled with inconsistency in design and interpretation. Finance, sales, operations, and marketing teams often design reports independently, leading to differences in fonts, colors, chart layouts, and even terminology. These inconsistencies don’t just affect appearance. They slow down interpretation, create confusion in cross-department discussions, and weaken trust in the insights being presented.
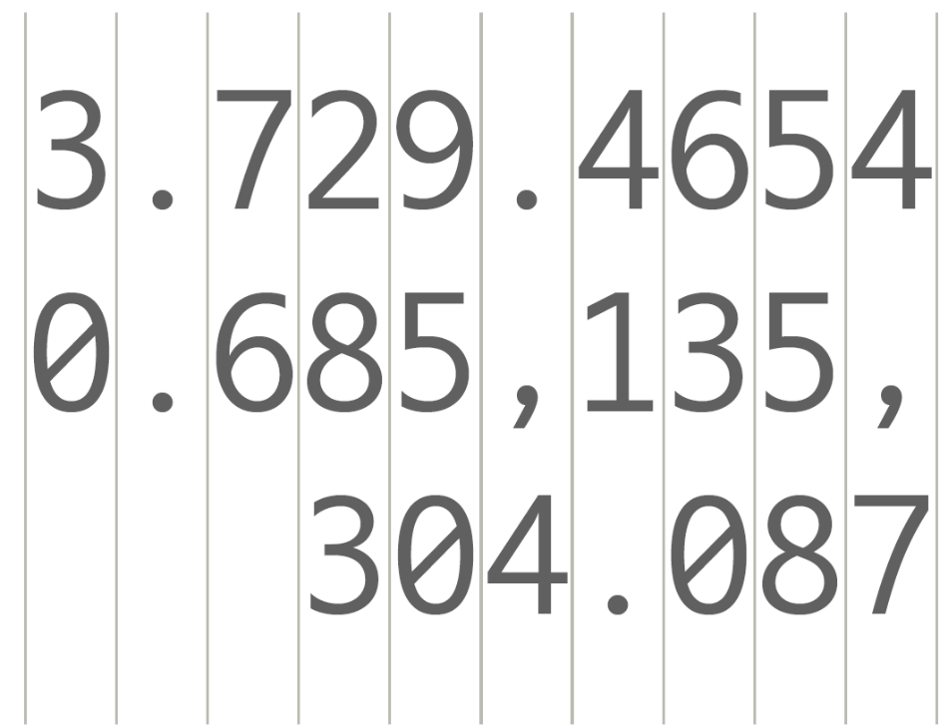
Centralized themes and branding in Power BI provide a practical solution. Visual standards in reporting are more than a matter of aesthetics; they shape how effectively information is interpreted, trusted, and acted upon. Even small variations in layout, color usage, or typography can introduce friction in the decision-making process. When executives must pause to decode formatting choices or reconcile conflicting visual cues, valuable time is lost, and confidence in the data can erode. Standardizing these elements ensures that reports communicate insights clearly, reduce the risk of misinterpretation, and enable faster alignment across stakeholders. In short, centralized theming does more than unify the look of dashboards - it strengthens the reliability of reporting as a foundation for business planning and execution.
It’s easy to dismiss theming as a matter of design. In reality, themes influence how quickly and accurately information is understood. A report styled with inconsistent colors or misaligned fonts forces readers to spend extra time interpreting visuals. Multiply that across dozens of reports, and the inefficiencies compound.
Centralized themes remove this friction by:
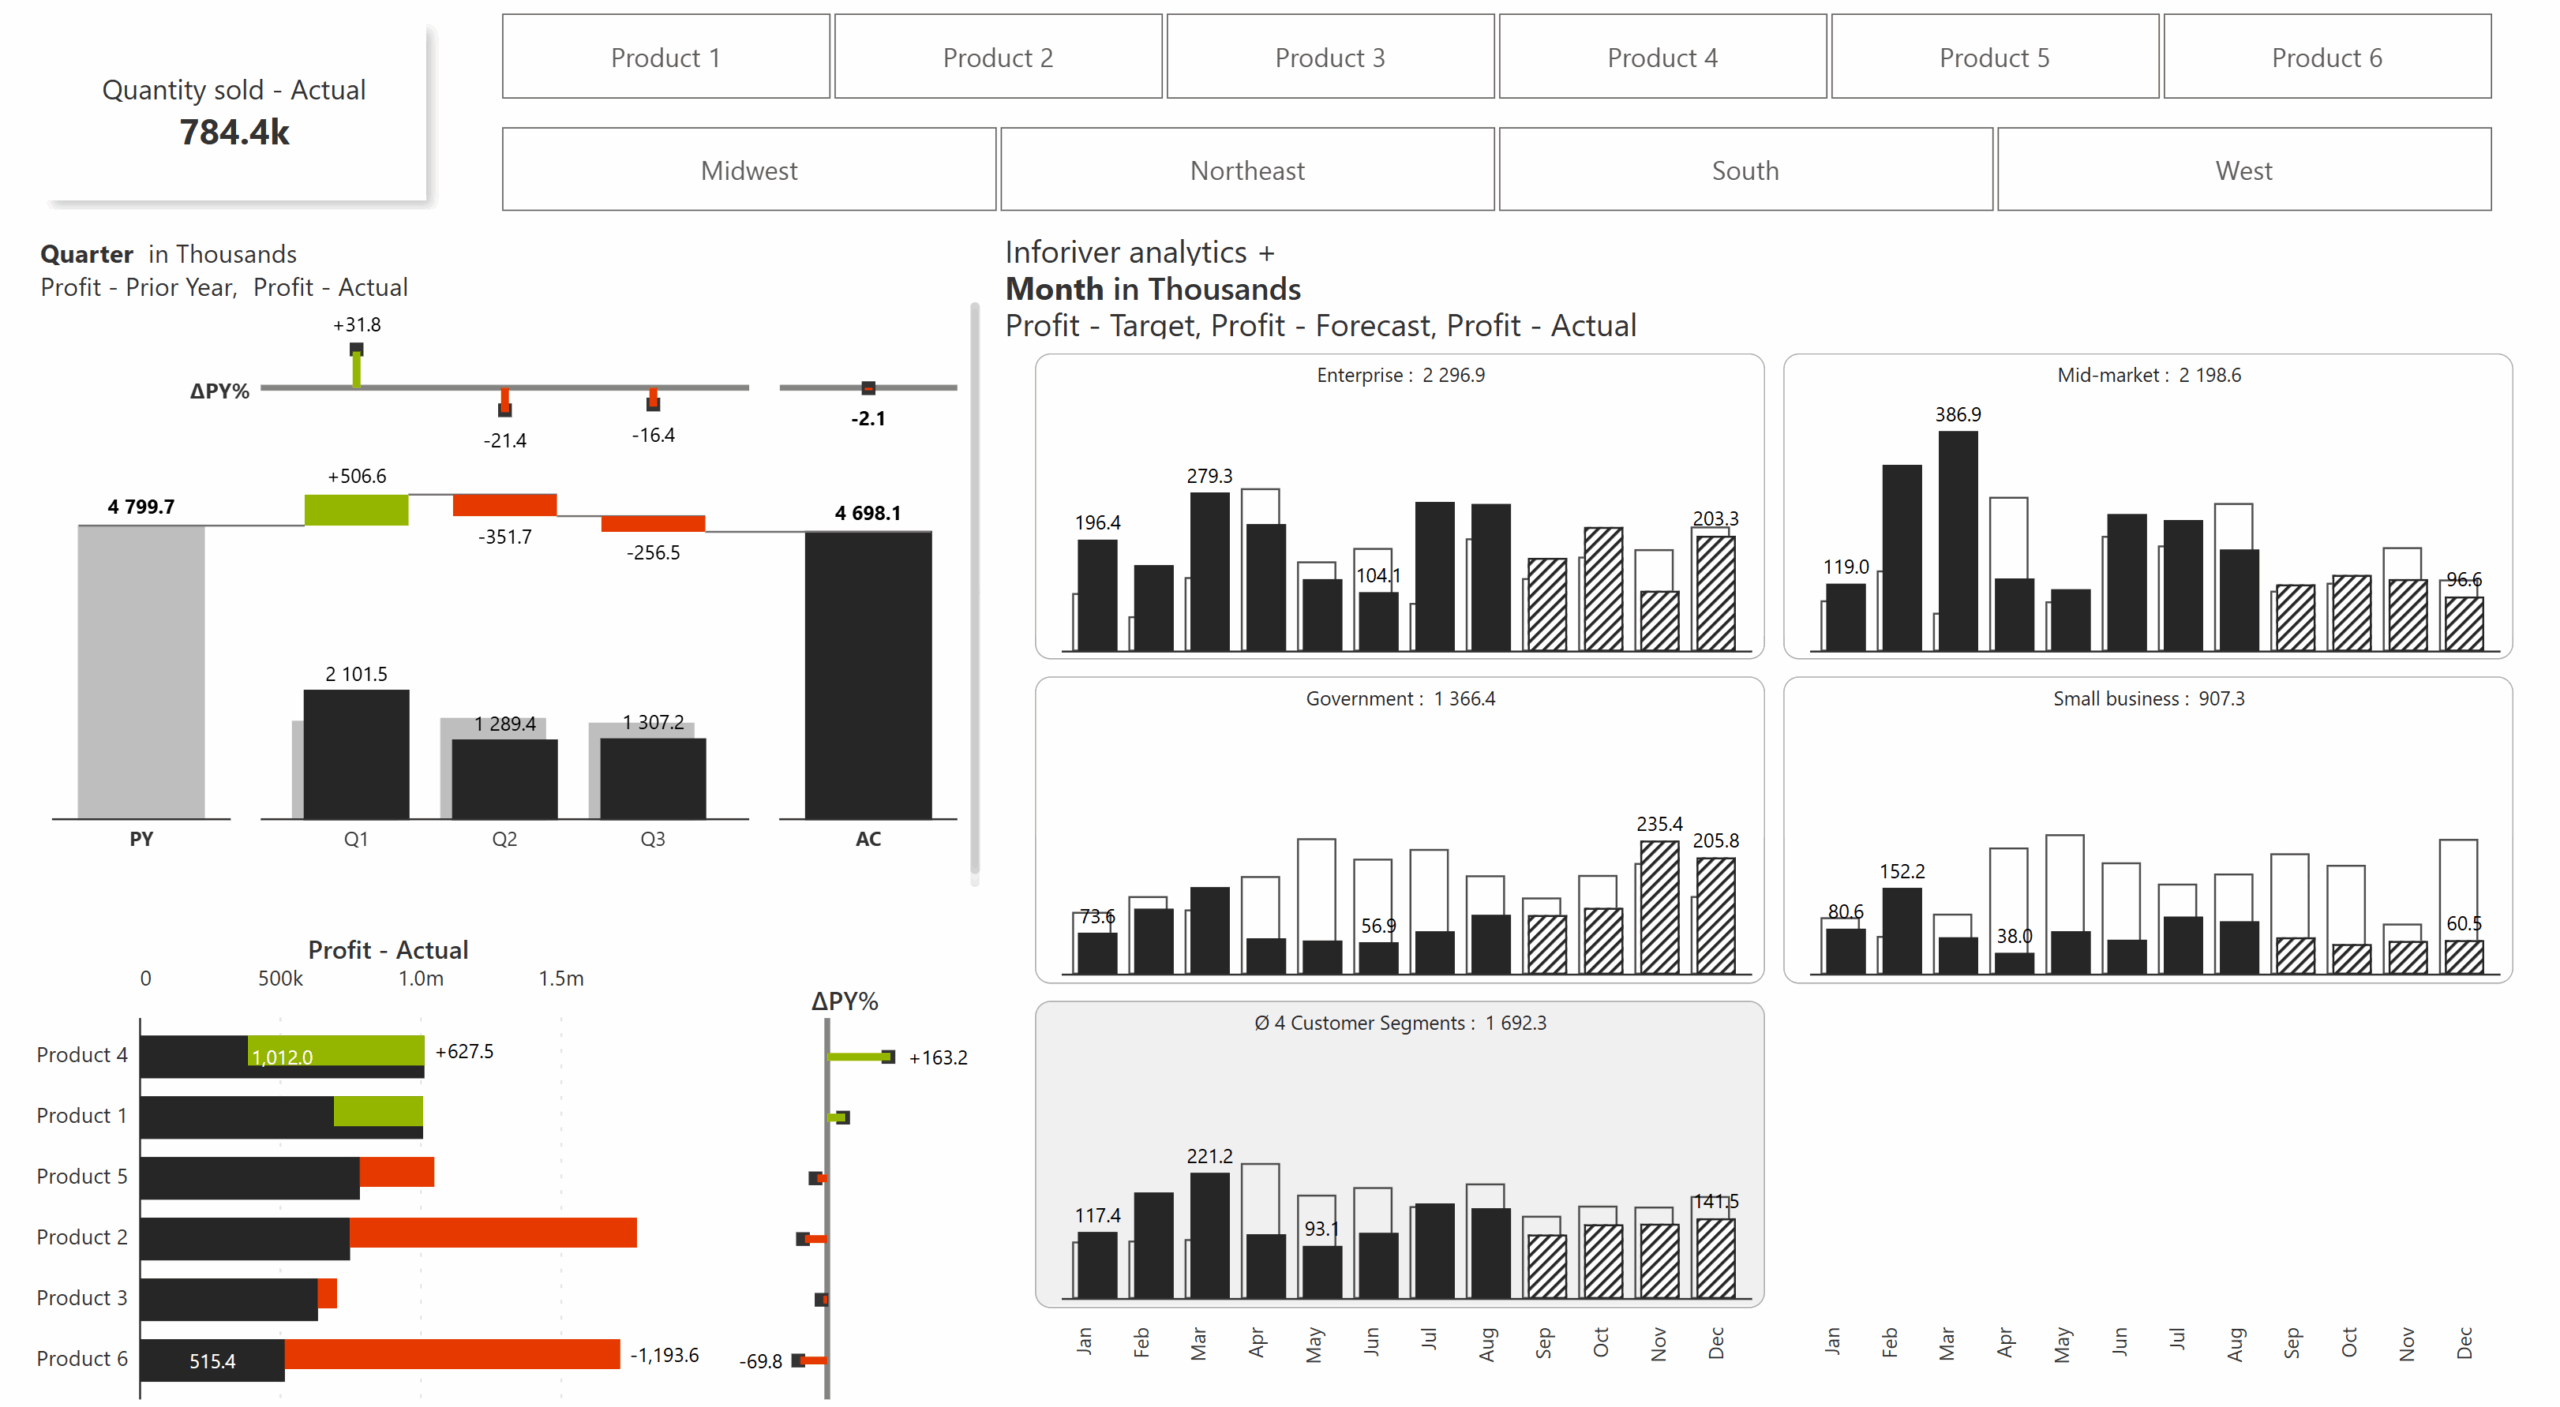
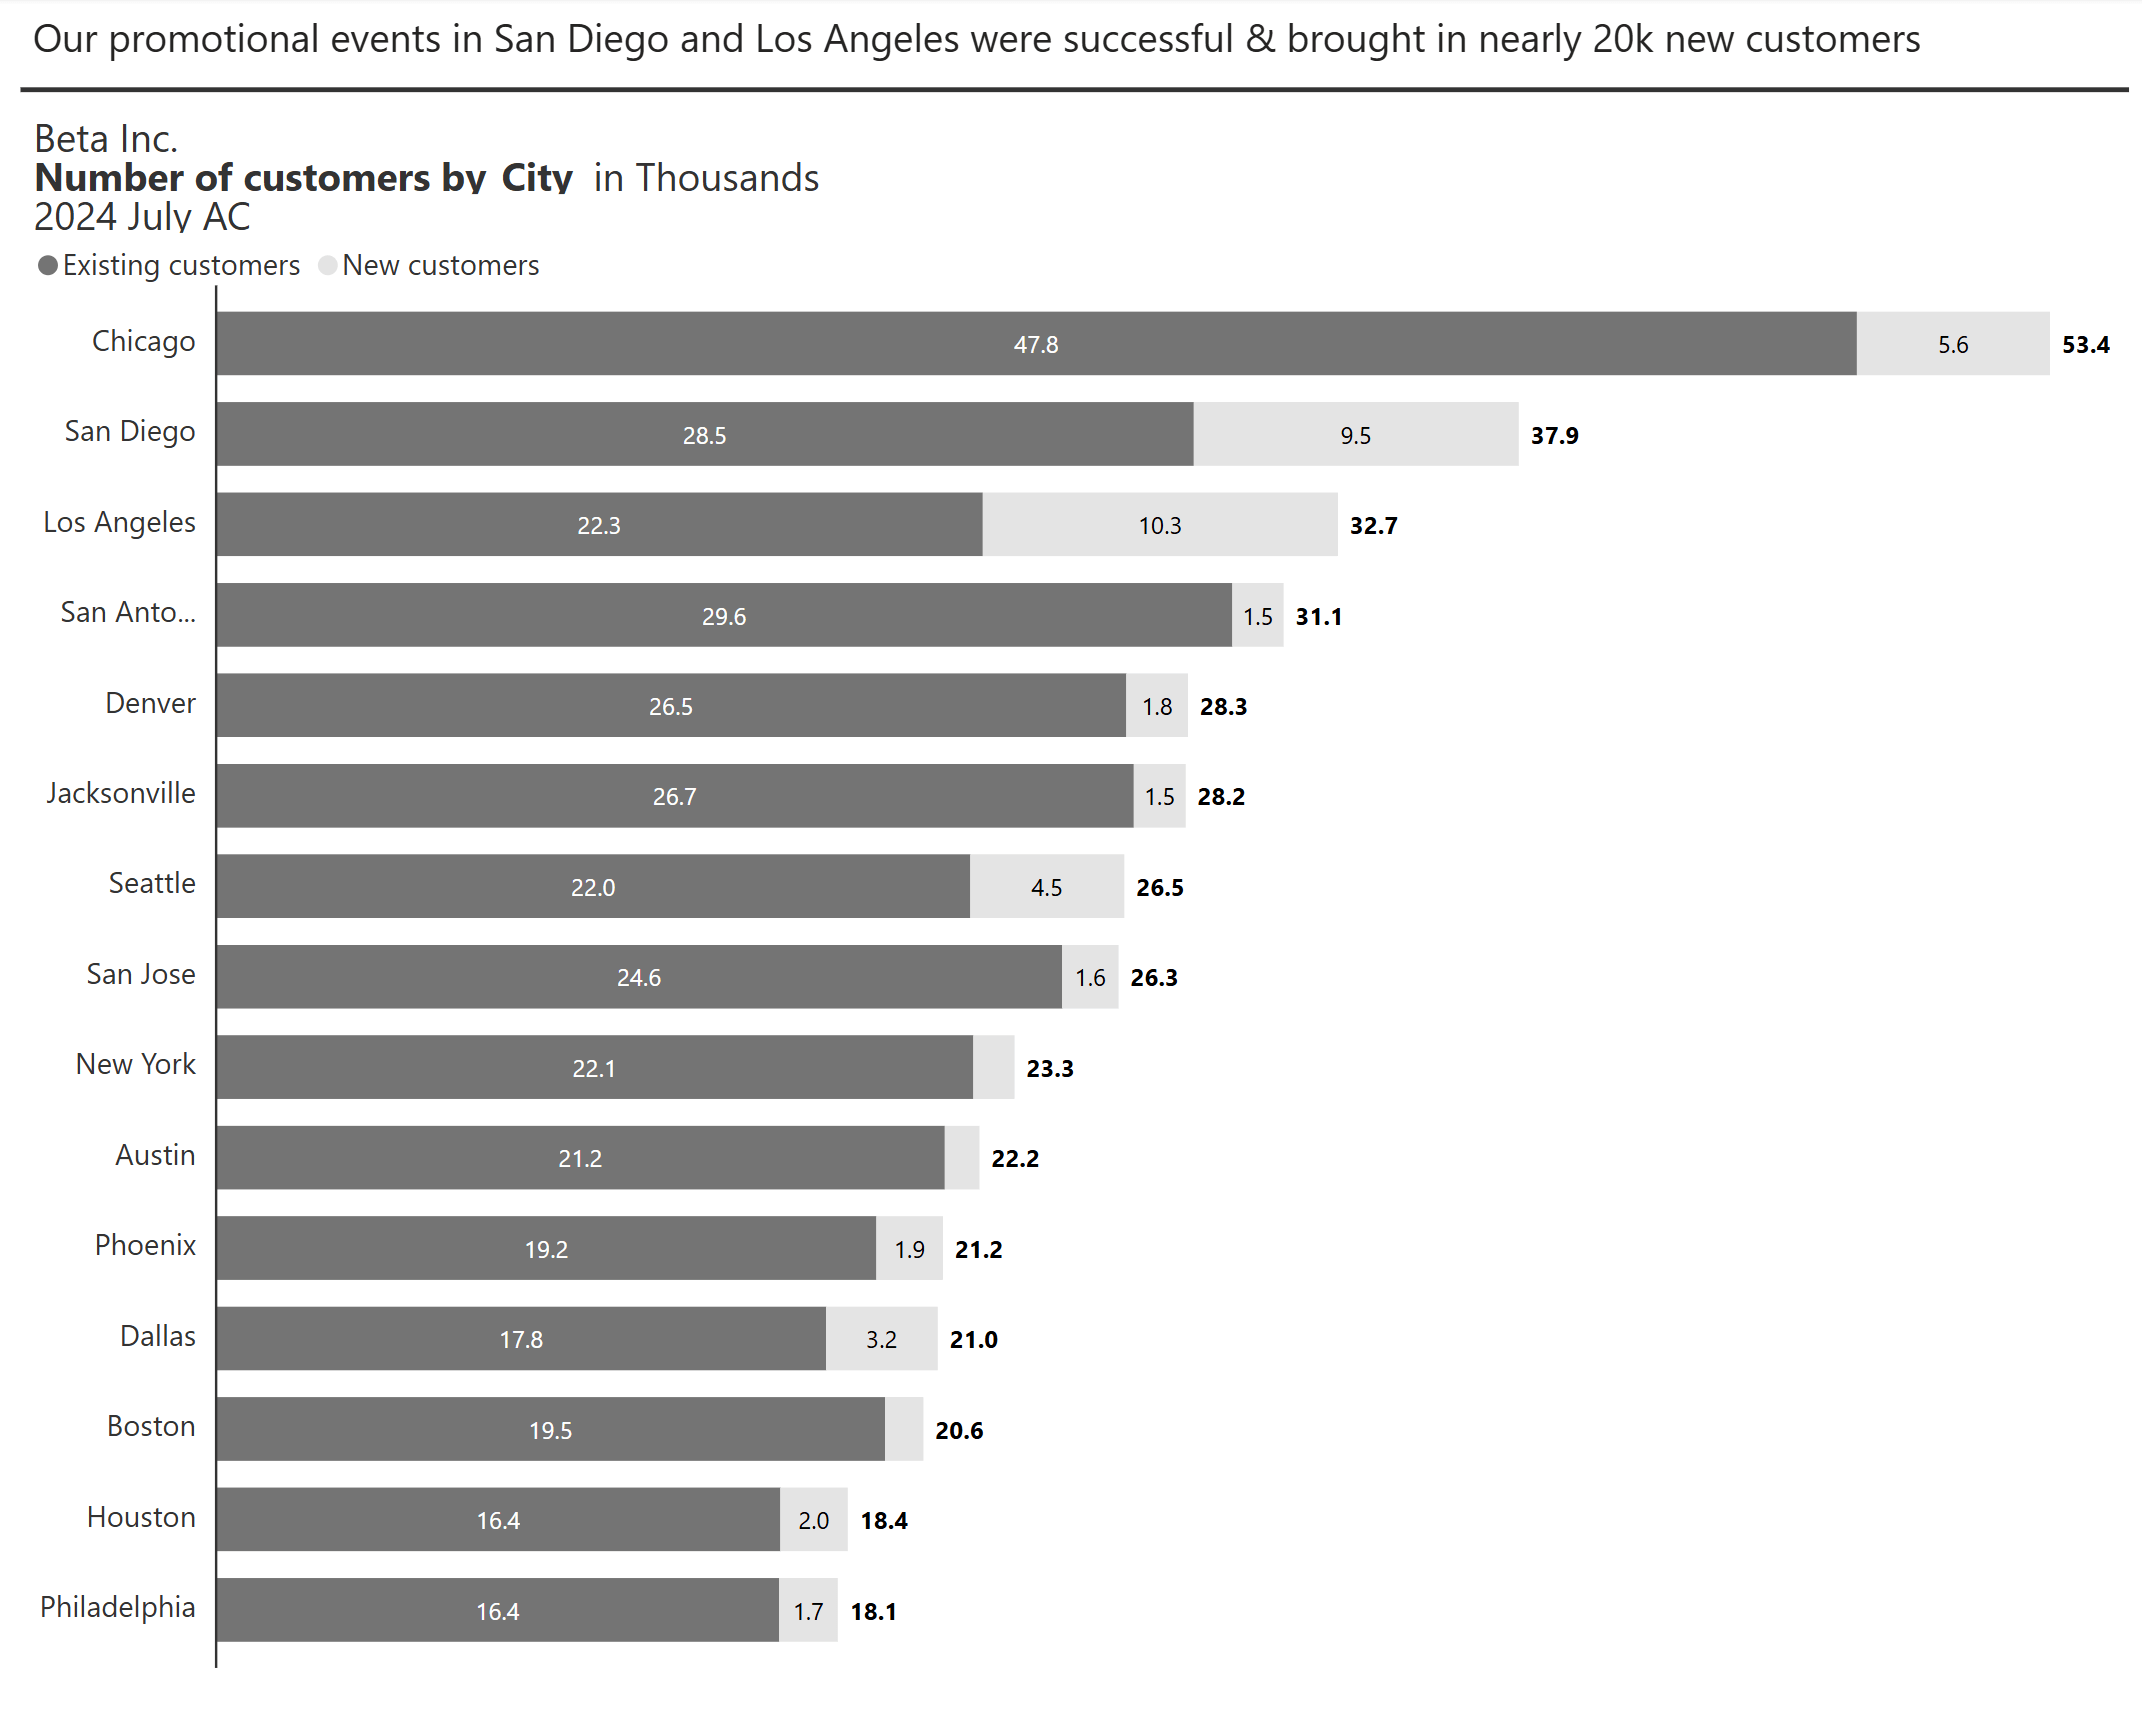
A finance team publishes quarterly reports with tables of forecasts and actuals. By using consistent notation—solid bars for actuals, outlined bars for plans, and hatched bars for forecasts, executives can instantly see which figures are projections and which are confirmed.

Inforiver extends Power BI’s native themes by providing a no-code interface to manage layouts, fonts, colors, and KPI presentation without the need for JSON editing. It includes branded templates, import and export for enterprise themes, advanced number formatting, customizable headers and footers, IBCS-compliant notations, and standardized KPI cards—features that help enterprises implement centralized themes and branding at scale. By reducing manual formatting effort and ensuring consistency across teams, Inforiver makes it easier to deliver professional, trusted reports that align with both brand guidelines and governance requirements.

Centralized themes go beyond branding. They make reporting scalable. By aligning design choices with usability and trust, organizations can reduce friction in decision-making and improve the clarity of every report distributed. For BI leaders, the question is no longer whether to centralize themes, but how quickly they can be implemented to keep pace with growing reporting demands.
This series continues in our next blog post with a practical look at how to implement and customize centralized themes directly in Power BI. Take a deeper dive on this topic with live examples, watch our webinar on Centralized Themes and Branding in Power BI for a full expert-led overview of this topic.
To learn more about the latest from Inforiver and why we are garnering recognition from industry experts, check out our newest brochure.
Level up your planning, reporting, and analytics, try our products for free today.

Inforiver helps enterprises consolidate planning, reporting & analytics on a single platform (Power BI). The no-code, self-service award-winning platform has been recognized as the industry’s best and is adopted by many Fortune 100 firms.
Inforiver is a product of Lumel, the #1 Power BI AppSource Partner. The firm serves over 3,000 customers worldwide through its portfolio of products offered under the brands Inforiver, EDITable, ValQ, and xViz.