Upcoming webinar on 'Inforiver Charts : The fastest way to deliver stories in Power BI', Aug 29th , Monday, 10.30 AM CST. Register Now
Upcoming webinar on 'Inforiver Charts : The fastest way to deliver stories in Power BI', Aug 29th , Monday, 10.30 AM CST. Register Now
Recognizing the value of centralized themes is only the beginning. The real challenge is putting them into practice across your reporting environment. Power BI includes built-in functionality to apply and customize themes, enabling organizations to standardize design choices and create templates that align with brand guidelines. With a consistent theme in place, teams can reduce formatting effort, improve usability, and deliver a professional reporting experience at scale.
For BI teams managing dozens, or even hundreds, of dashboards, this consistency translates into significant time savings and stronger stakeholder confidence. A well-designed theme ensures that users spend less time interpreting formatting differences and more time acting on insights.
Implementing Centralized Themes in Power BI is therefore not just about visual alignment, it is about operational efficiency and trust in reporting. You can read more about why consistency is so important for enterprise reporting in part one of this blog series here.
Power BI comes with a library of ready-made themes accessible through the View → Themes menu. These options allow teams to quickly apply consistent color palettes and text styles across a report. For smaller organizations or ad hoc analysis, built-in themes can be sufficient.
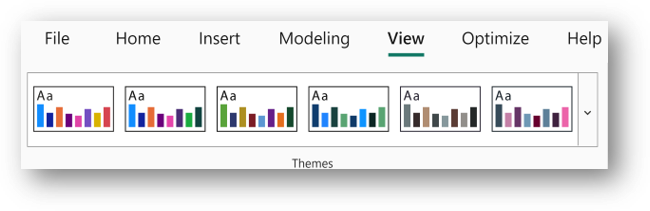
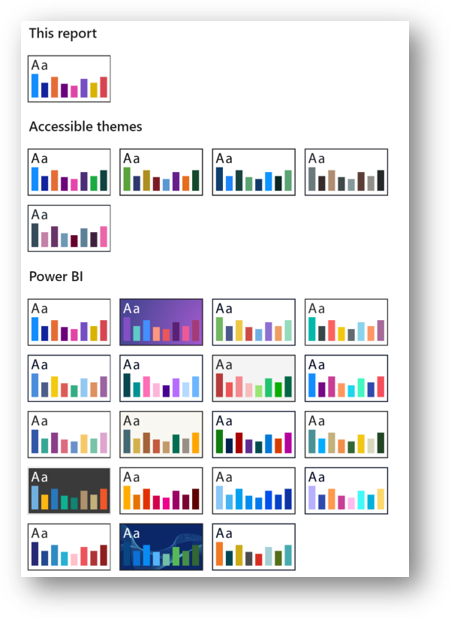
However, for enterprises with strict brand guidelines or cross-departmental reporting needs, customization is essential.
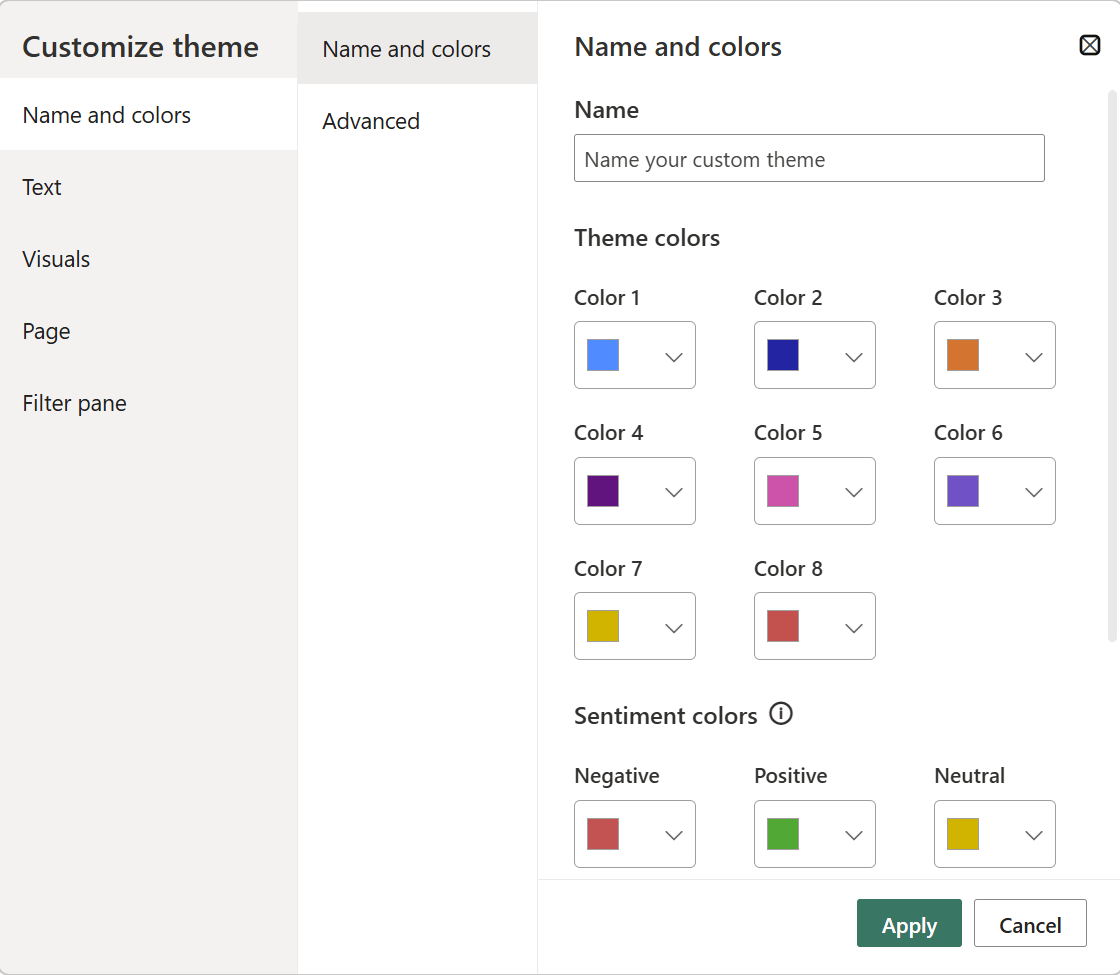
From the Customize Current Theme option, developers can fine-tune design elements such as:
These changes can then be saved as a JSON theme file. Once exported, the theme can be shared across workspaces, ensuring that every report produced follows the same design logic.

While Power BI’s native theming covers most needs, enterprises often require more advanced capabilities, such as dynamic headers, flexible number formatting, and template-driven layouts that reduce the risk of inconsistency.
Inforiver supports all of these practices by providing a no-code interface for styling and theming in Power BI. Its branded templates, semantic formatting, and advanced KPI cards enable enterprises to scale reporting faster and with less effort. Instead of relying on JSON editing, BI teams can achieve consistent, professional themes that align with both brand identity and governance requirements.
1. No-Code Theme Designer
Design and apply custom Power BI themes without any code. With branded presets, reusable color schemes, fonts, and layouts, teams can instantly create and standardize visual styles across multiple dashboards. This simplifies visual governance and accelerates report delivery.
2. Enterprise Themes with Inforiver
Inforiver Writeback Matrix extends theming to enterprise-level reporting with theme import/export, shared access, and organization-wide reuse of approved templates.
Key capabilities include:
3. Advanced Formatting & Semantic Styling
Inforiver supports advanced semantic formatting options, allowing users to define display rules for numbers, units, decimals, and signs. Customize hierarchy layouts, totals, subtotals, and visual settings like font, spacing, and background color — all from an intuitive interface. This ensures professional, uniform reports across every Power BI workspace.
4. Reporting and analytics themes
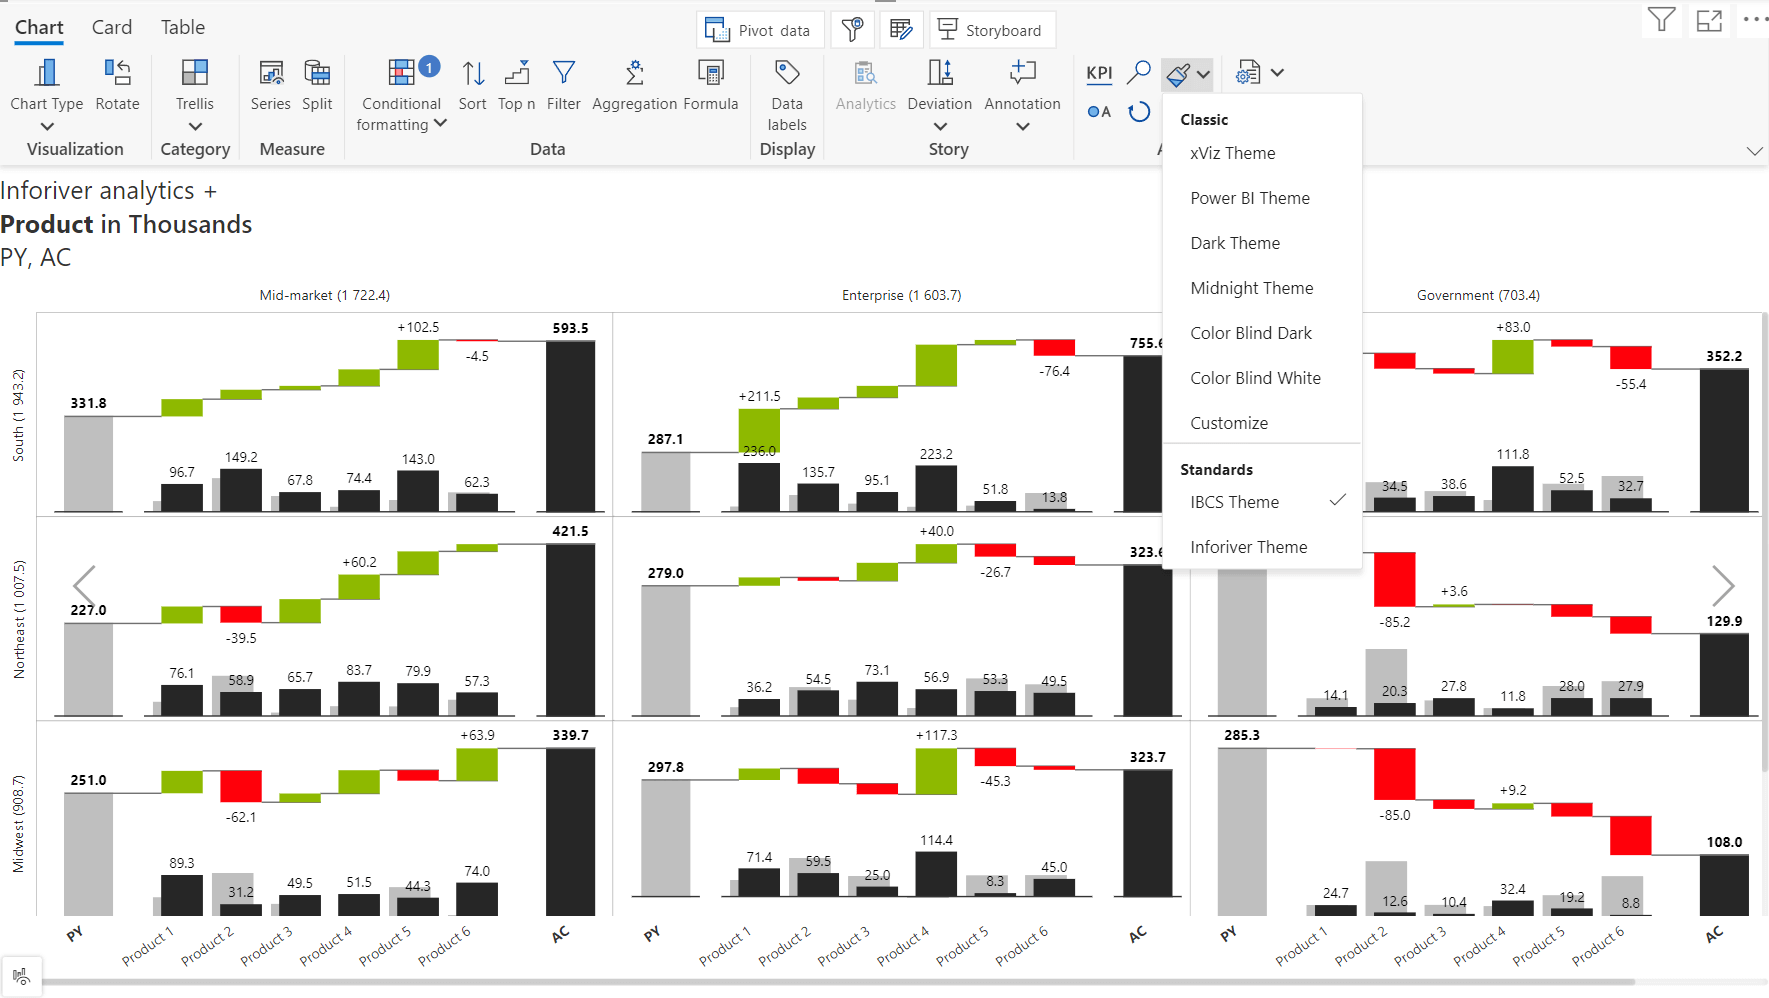
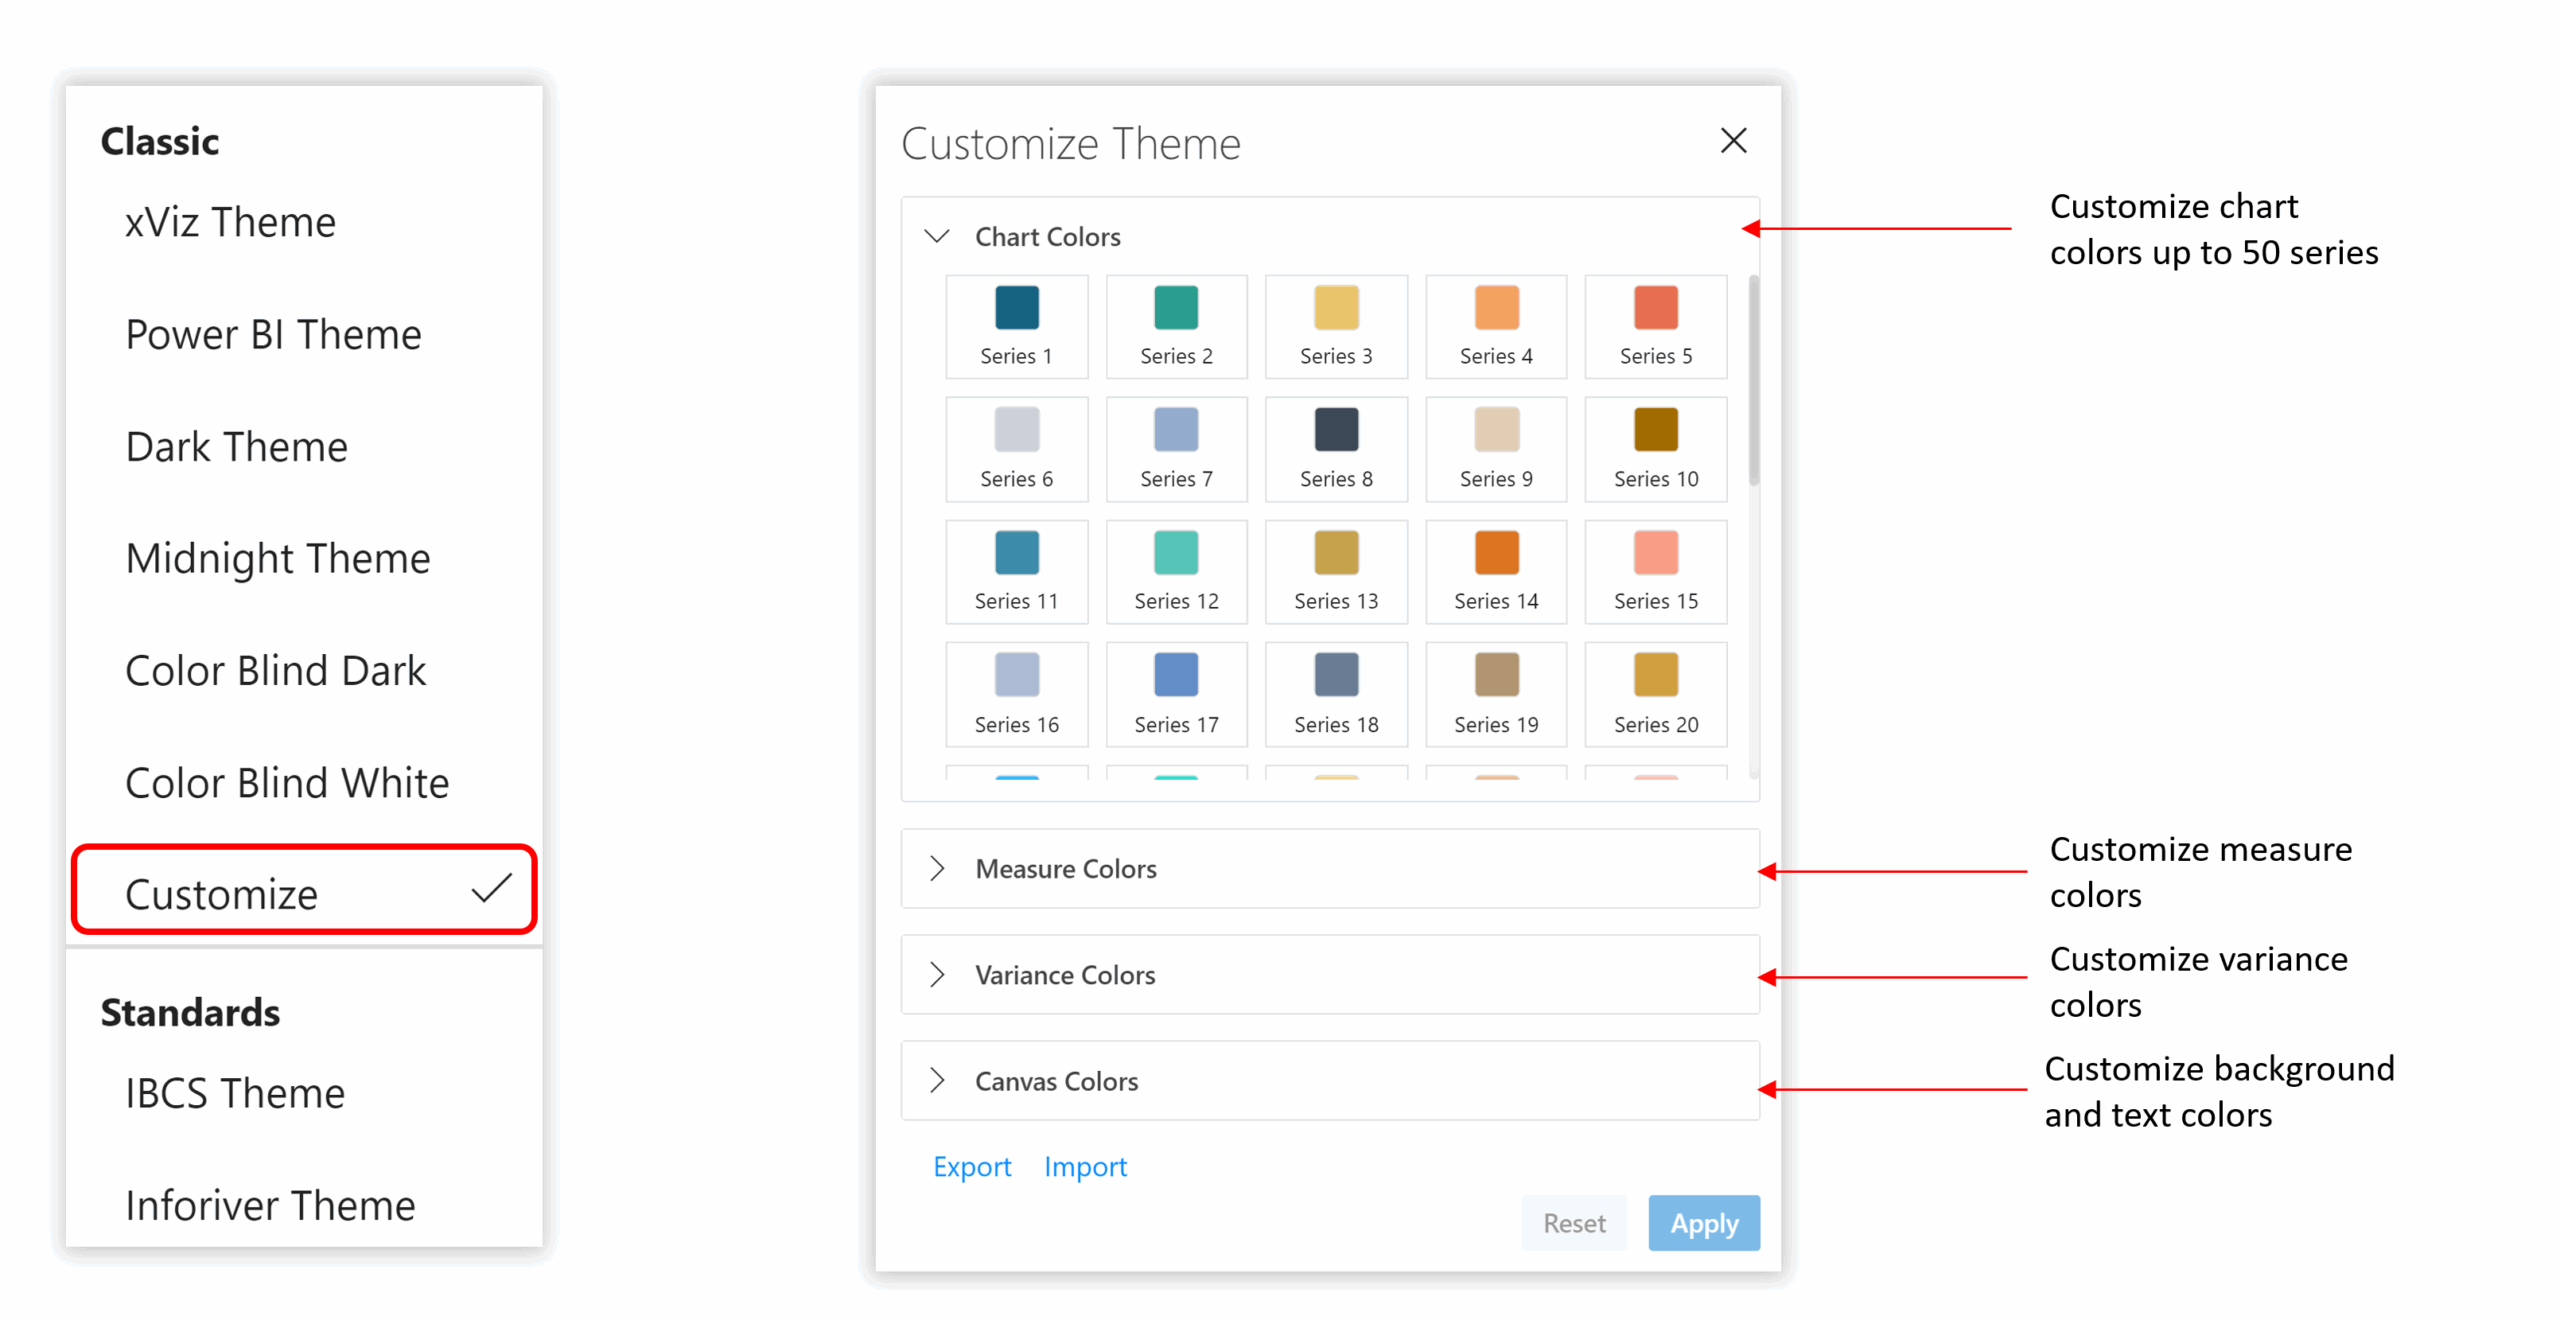
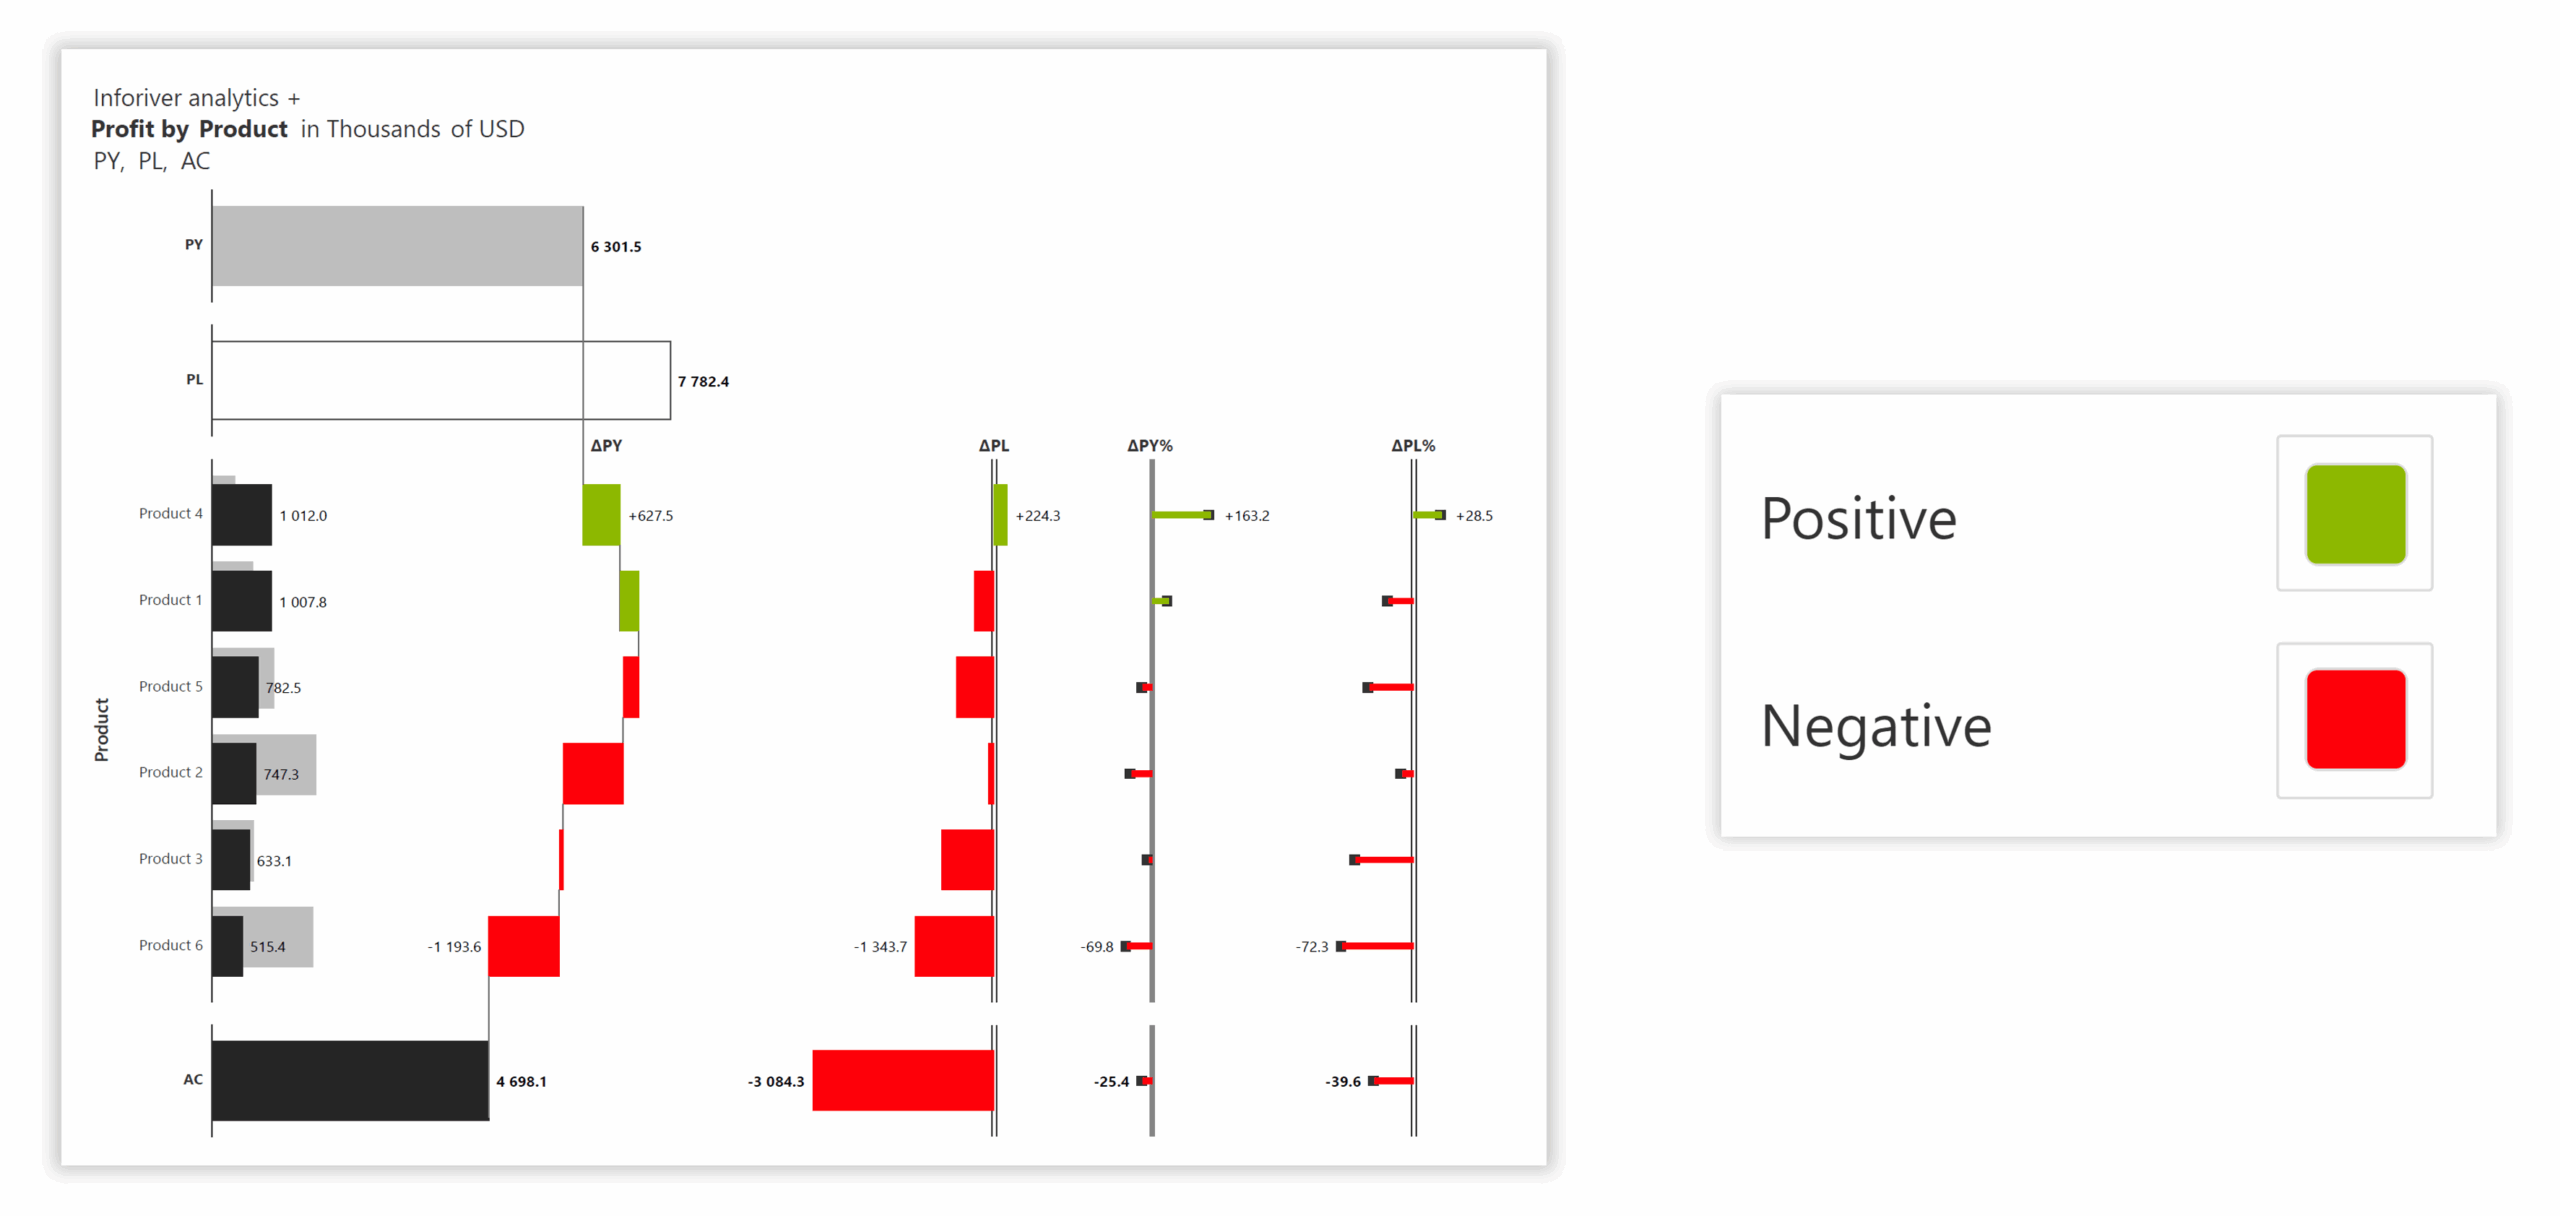
Inforiver Analytics+ introduces powerful chart-level theming capabilities designed for IBCS-compliant business reporting.
Highlights include:

Inforiver enables faster report creation, brand alignment, and visual governance — all without coding. By integrating centralized theming within Power BI, teams can maintain design consistency across hundreds of reports, minimize rework, and enhance visual storytelling. The result is a scalable, governed, and aesthetically consistent Power BI environment that improves user trust and organizational efficiency.
Centralized theming is not just about visual polish. It provides the governance framework needed to manage reporting at scale. By standardizing colors, fonts, layouts, and KPI presentation, organizations can ensure that every report communicates insights with clarity and credibility. Power BI’s native theming features make this possible, while extensions like Inforiver extend these capabilities with branded templates, advanced formatting, and no-code customization.
For BI leaders, centralized themes are no longer optional, they are essential for delivering reports that decision-makers can trust and act on quickly. To explore these practices in depth and see them demonstrated in real-world examples, watch our webinar for a full overview of centralized themes and branding in Power BI from our experts.
To learn more about the latest from Inforiver and why we are garnering recognition from industry experts, check out our newest brochure.
Level up your planning, reporting, and analytics, try our products for free today.

Inforiver helps enterprises consolidate planning, reporting & analytics on a single platform (Power BI). The no-code, self-service award-winning platform has been recognized as the industry’s best and is adopted by many Fortune 100 firms.
Inforiver is a product of Lumel, the #1 Power BI AppSource Partner. The firm serves over 3,000 customers worldwide through its portfolio of products offered under the brands Inforiver, EDITable, ValQ, and xViz.