
Upcoming webinar on 'Inforiver Charts : The fastest way to deliver stories in Power BI', Aug 29th , Monday, 10.30 AM CST. Register Now
Upcoming webinar on 'Inforiver Charts : The fastest way to deliver stories in Power BI', Aug 29th , Monday, 10.30 AM CST. Register Now
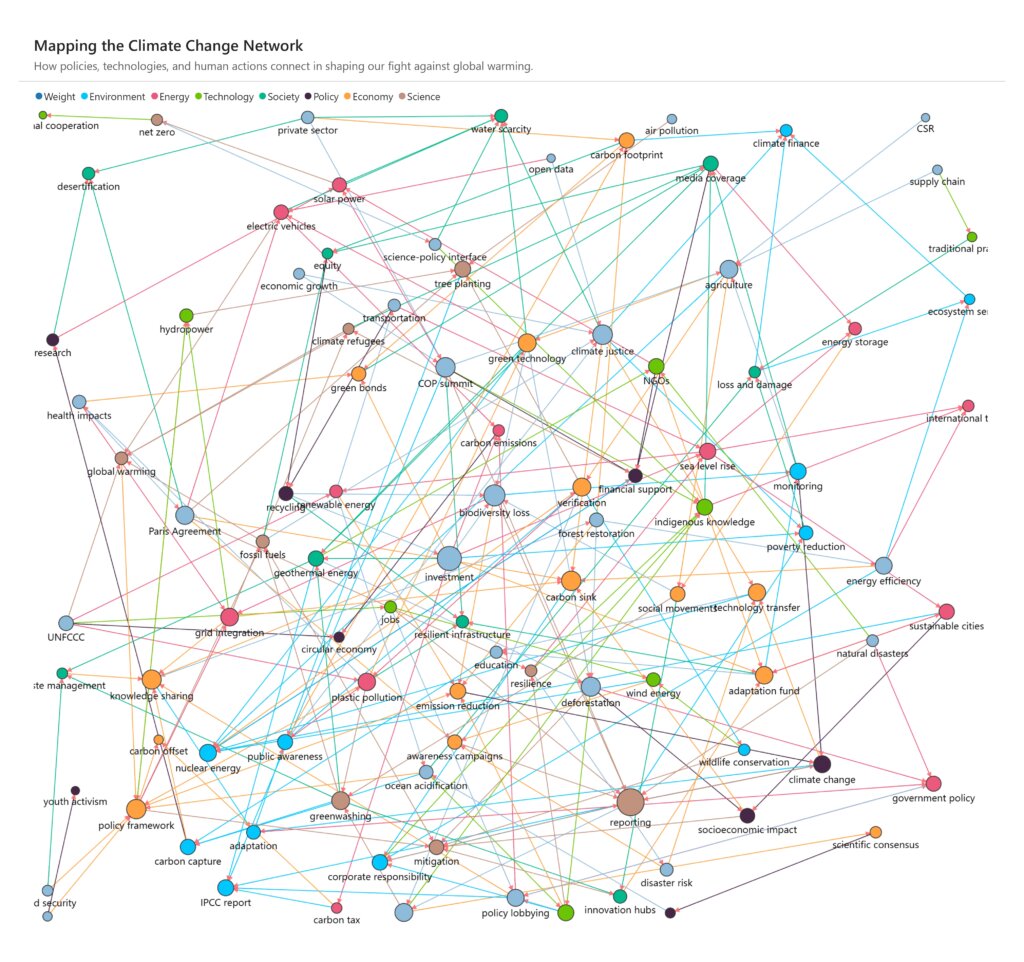
Think about a social network, a complex supply chain, or a financial system. At first glance, you might see lists of people, products, or transactions. But the real story isn't in the lists themselves; it's in the connections between them. Who are friends with whom? Which products are often bought together? How does money flow between different accounts?
While traditional data tools are excellent for organizing lists, they often hide these crucial relationships. Trying to understand a complex network by looking at a table is like trying to read a map with no roads where you see the cities but not how they're connected.
This is where a network graph comes in. A network graph in data analytics is a powerful way to visualize how data points are linked, making it easy to spot patterns and insights that would otherwise be invisible. To create these powerful visualizations, you need a database that understands connections. In this blog, we'll dive deep into two major types of databases: relational database and graph database and explain why they handle connected data in very different ways.
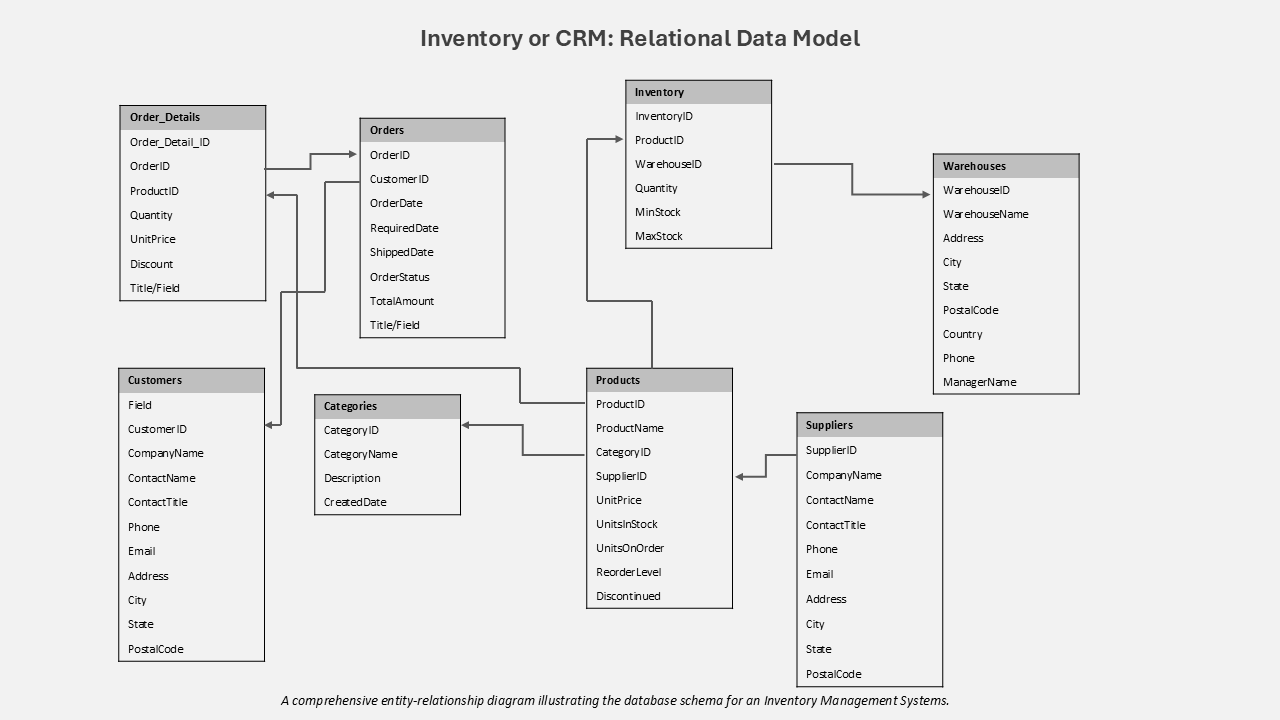
For decades, the relational database management system (RDBMS) has been the standard for storing data. It’s based on a simple idea: organizing data into a collection of structured tables, similar to a spreadsheet. Each table has a fixed set of columns and a collection of rows, where each row is a single, unique record. This rigid structure makes it reliable for storing consistent, well-defined data, which is why it's perfect for applications like banking, e-commerce and others.
But how do you handle relationships in a relational database? You don't store them directly. Instead, you create them indirectly by linking tables using special keys. A primary key is a unique ID for a row in one table, and a foreign key is a column in another table that holds that ID, creating a link between them for this relational databases use Structured Query Language (SQL) to query and manipulate data (e.g. SELECT and JOIN statements).
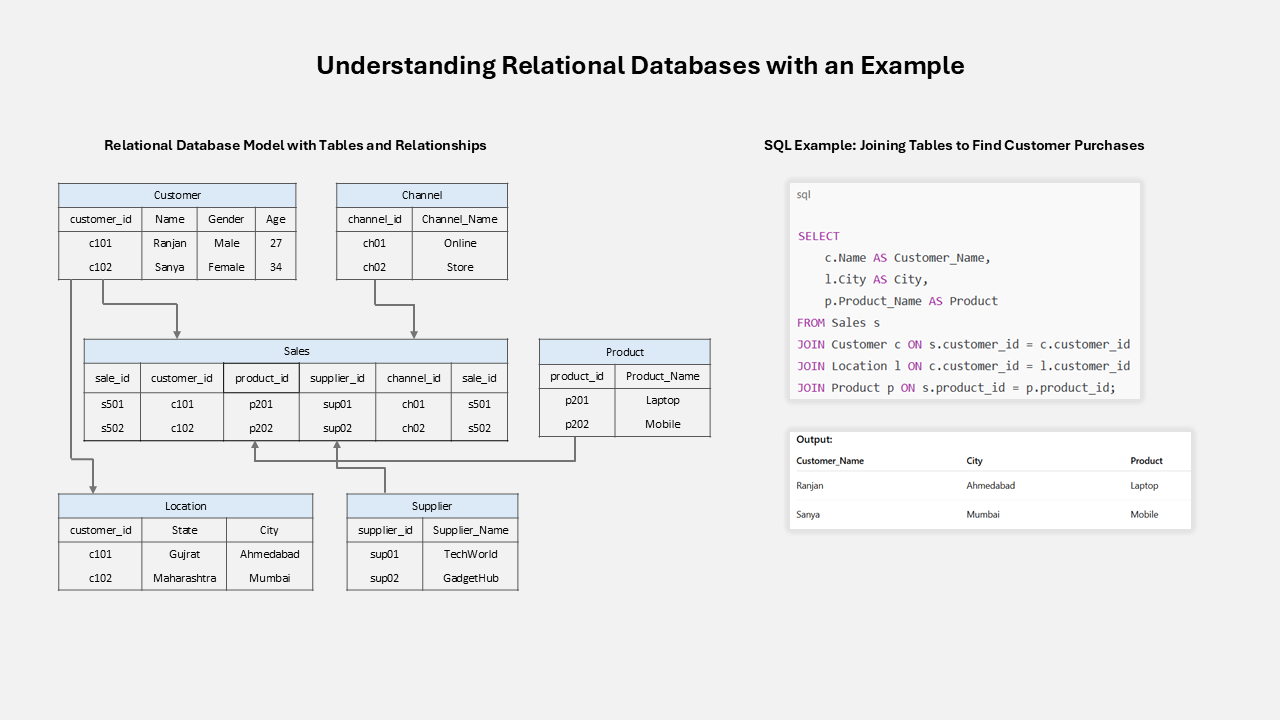
To find a connection, such as a customer's address, the database performs a JOIN operation, which matches the foreign key in one table with the primary key in another. This process works well for simple queries.
However, if you need to find a connection several layers deep like a "friend of a friend of a friend" the database has to perform multiple JOINs across many tables. This becomes very slow and resource intensive as the number of tables and relationships grows.
In contrast, a graph database is designed from the ground up to prioritize relationships. Instead of tables, data is organized into a flexible, interconnected structure that mirrors how we naturally think about information.
The core components of a graph database are:
The biggest advantage of a graph database is its performance. Because relationships are already stored as data, the database can follow connections directly from one node to the next without needing expensive JOIN operations.

The following table provides a concise summary of the key differences between these two powerful database paradigms.
| Feature | Relational Database | Graph Database |
|---|---|---|
| Data model | Tables with rows and columns; fixed schema. | Nodes (entities) and edges (relationships) with properties. |
| Schema | Rigid; adding fields often needs table changes | Flexible; easily add new nodes, edges, or properties. |
| Relationships | Managed with foreign keys and JOINs. | Stored directly as edges, no joins required. |
| Relationships | Managed with foreign keys and JOINs. | Stored directly as edges, no joins required. |
| Query language | SQL, best for tabular filtering and aggregation. | Cypher, GQL, etc., optimized for pattern and connection queries. |
| Performance | Slows with many JOINs or deep relationships. | Fast for multi-hop traversals and complex connections. |
| Ideal use cases | Traditional business data like CRM, inventory, finance. | Connected data: social networks, fraud detection, recommendation engines etc. |
Choosing between a relational or graph database isn’t about which one is “better” overall. It’s about matching the database to your data and the kind of questions you need to answer.
Relational Database Use Cases: Relational databases remain the optimal choice for applications requiring transactional integrity and a highly structured approach to data.


The database world is changing fast, and graph technology is at the center of this shift. Analysts predict massive growth in the coming years. Gartner expects that by 2025, graph technologies will power 80% of data and analytics innovations, a huge jump from just 10% in 2021. The global graph database market is also forecast to grow more than 20% each year, reaching several billion dollars by the end of the decade.
This surge shows how data strategies are evolving. Graph databases were once seen as niche tools for tasks like social network analysis. But the rise of Artificial Intelligence has created a new need: reliable, context-rich data that can guide intelligent systems. Knowledge graphs built on graph databases have become the top solution for this challenge.
The trend is so strong that even traditional technologies are adapting. The SQL:2023 standard now includes property graph queries, blending graph concepts with the familiar relational world. This proves that graph thinking isn’t optional anymore - it’s becoming a core part of the modern data stack. The future isn’t about choosing graph or relational databases it’s about combining both and recognizing the power of connected data.
Many organizations recognize the power of graph analytics, the ability to uncover fraud rings, identify supply chain dependencies, or build a 360° view of customer relationships.
However, when it comes to adoption, they face a harsh reality: migrating decades of relational database into a graph database is complex, costly, and risky. Rebuilding schemas, rewriting applications, and retraining teams can take years often with no guaranteed return. As a result, businesses remain stuck with data that’s rich in potential but locked in rows and columns.
- What if you could explore these hidden relationships without moving a single byte of data?
- What if you could visualize every connection between customers, transactions, or entities - directly within the familiar environment of your existing SQL Server, Oracle, PostgreSQL, or other relational databases, right inside Power BI?
That’s exactly what Inforiver Analytics+ delivers.
The smartest way to address the Migration Paradox isn’t replacing your databases, it’s giving them a new way to reveal insights.
Inforiver Analytics+ Network Graph visualization connects the structured reliability of relational databases with the flexible power of graph analytics, all within Power BI.
Inforiver works directly with your existing data sources, whether they’re SQL-based relational systems or modern graph platforms. There’s no risky migration, no expensive rewrites, and no disruption to your core infrastructure. Instead, you can explore your data as an interactive network and uncover patterns that traditional tables can’t show.
Inforiver Analytics+ is a comprehensive visualization suite for Power BI, built to help organizations extract deep insights from their existing data without requiring database architects or data scientists.
Inforiver acts as a bridge between relational and graph worlds, letting organizations unlock graph-level insights without the cost, risk, or time of a full migration. By visualizing your existing relational data as an interactive network, you can make faster, smarter decisions while keeping your trusted data infrastructure exactly where it is.
The journey through the world of databases tells a clear story. Relational databases remain the backbone of modern business, offering unmatched structure, consistency, and transactional reliability. They provide the stable foundation that organizations rely on every day. Graph databases, on the other hand, offer a fresh perspective one that reveals the intricate web of relationships and hidden patterns that drive real-world outcomes.
The choice is not about replacing one with the other. The future of intelligent data analysis lies in augmentation: combining the rock-solid stability of relational databases with the intuitive, relationship-focused power of network analytics. Understanding the connections within your data is no longer optional, it’s a competitive necessity.
Tools like the Inforiver Network Graph in Power BI bring this capability to every business user and analyst. By bridging traditional data storage with modern, interactive analytics, Inforiver turns static tables into a dynamic network of actionable insights. It empowers organizations to uncover hidden patterns, follow complex relationships, and make smarter decisions using the data they already own.

Inforiver helps enterprises consolidate planning, reporting & analytics on a single platform (Power BI). The no-code, self-service award-winning platform has been recognized as the industry’s best and is adopted by many Fortune 100 firms.
Inforiver is a product of Lumel, the #1 Power BI AppSource Partner. The firm serves over 3,000 customers worldwide through its portfolio of products offered under the brands Inforiver, EDITable, ValQ, and xViz.