
Upcoming webinar on 'Inforiver Charts : The fastest way to deliver stories in Power BI', Aug 29th , Monday, 10.30 AM CST. Register Now
Upcoming webinar on 'Inforiver Charts : The fastest way to deliver stories in Power BI', Aug 29th , Monday, 10.30 AM CST. Register Now
In today's data-driven world, marketing metrics have become essential for measuring success and guiding decision-making. From website traffic to social media engagement, there are a wide variety of metrics available to marketers. However, not all metrics are created equal.
Creating an effective marketing dashboard with the right metrics can help you better engage with your target audience, optimize your campaigns, and ultimately drive more revenue. Consider the following factors while designing a marketing dashboard.
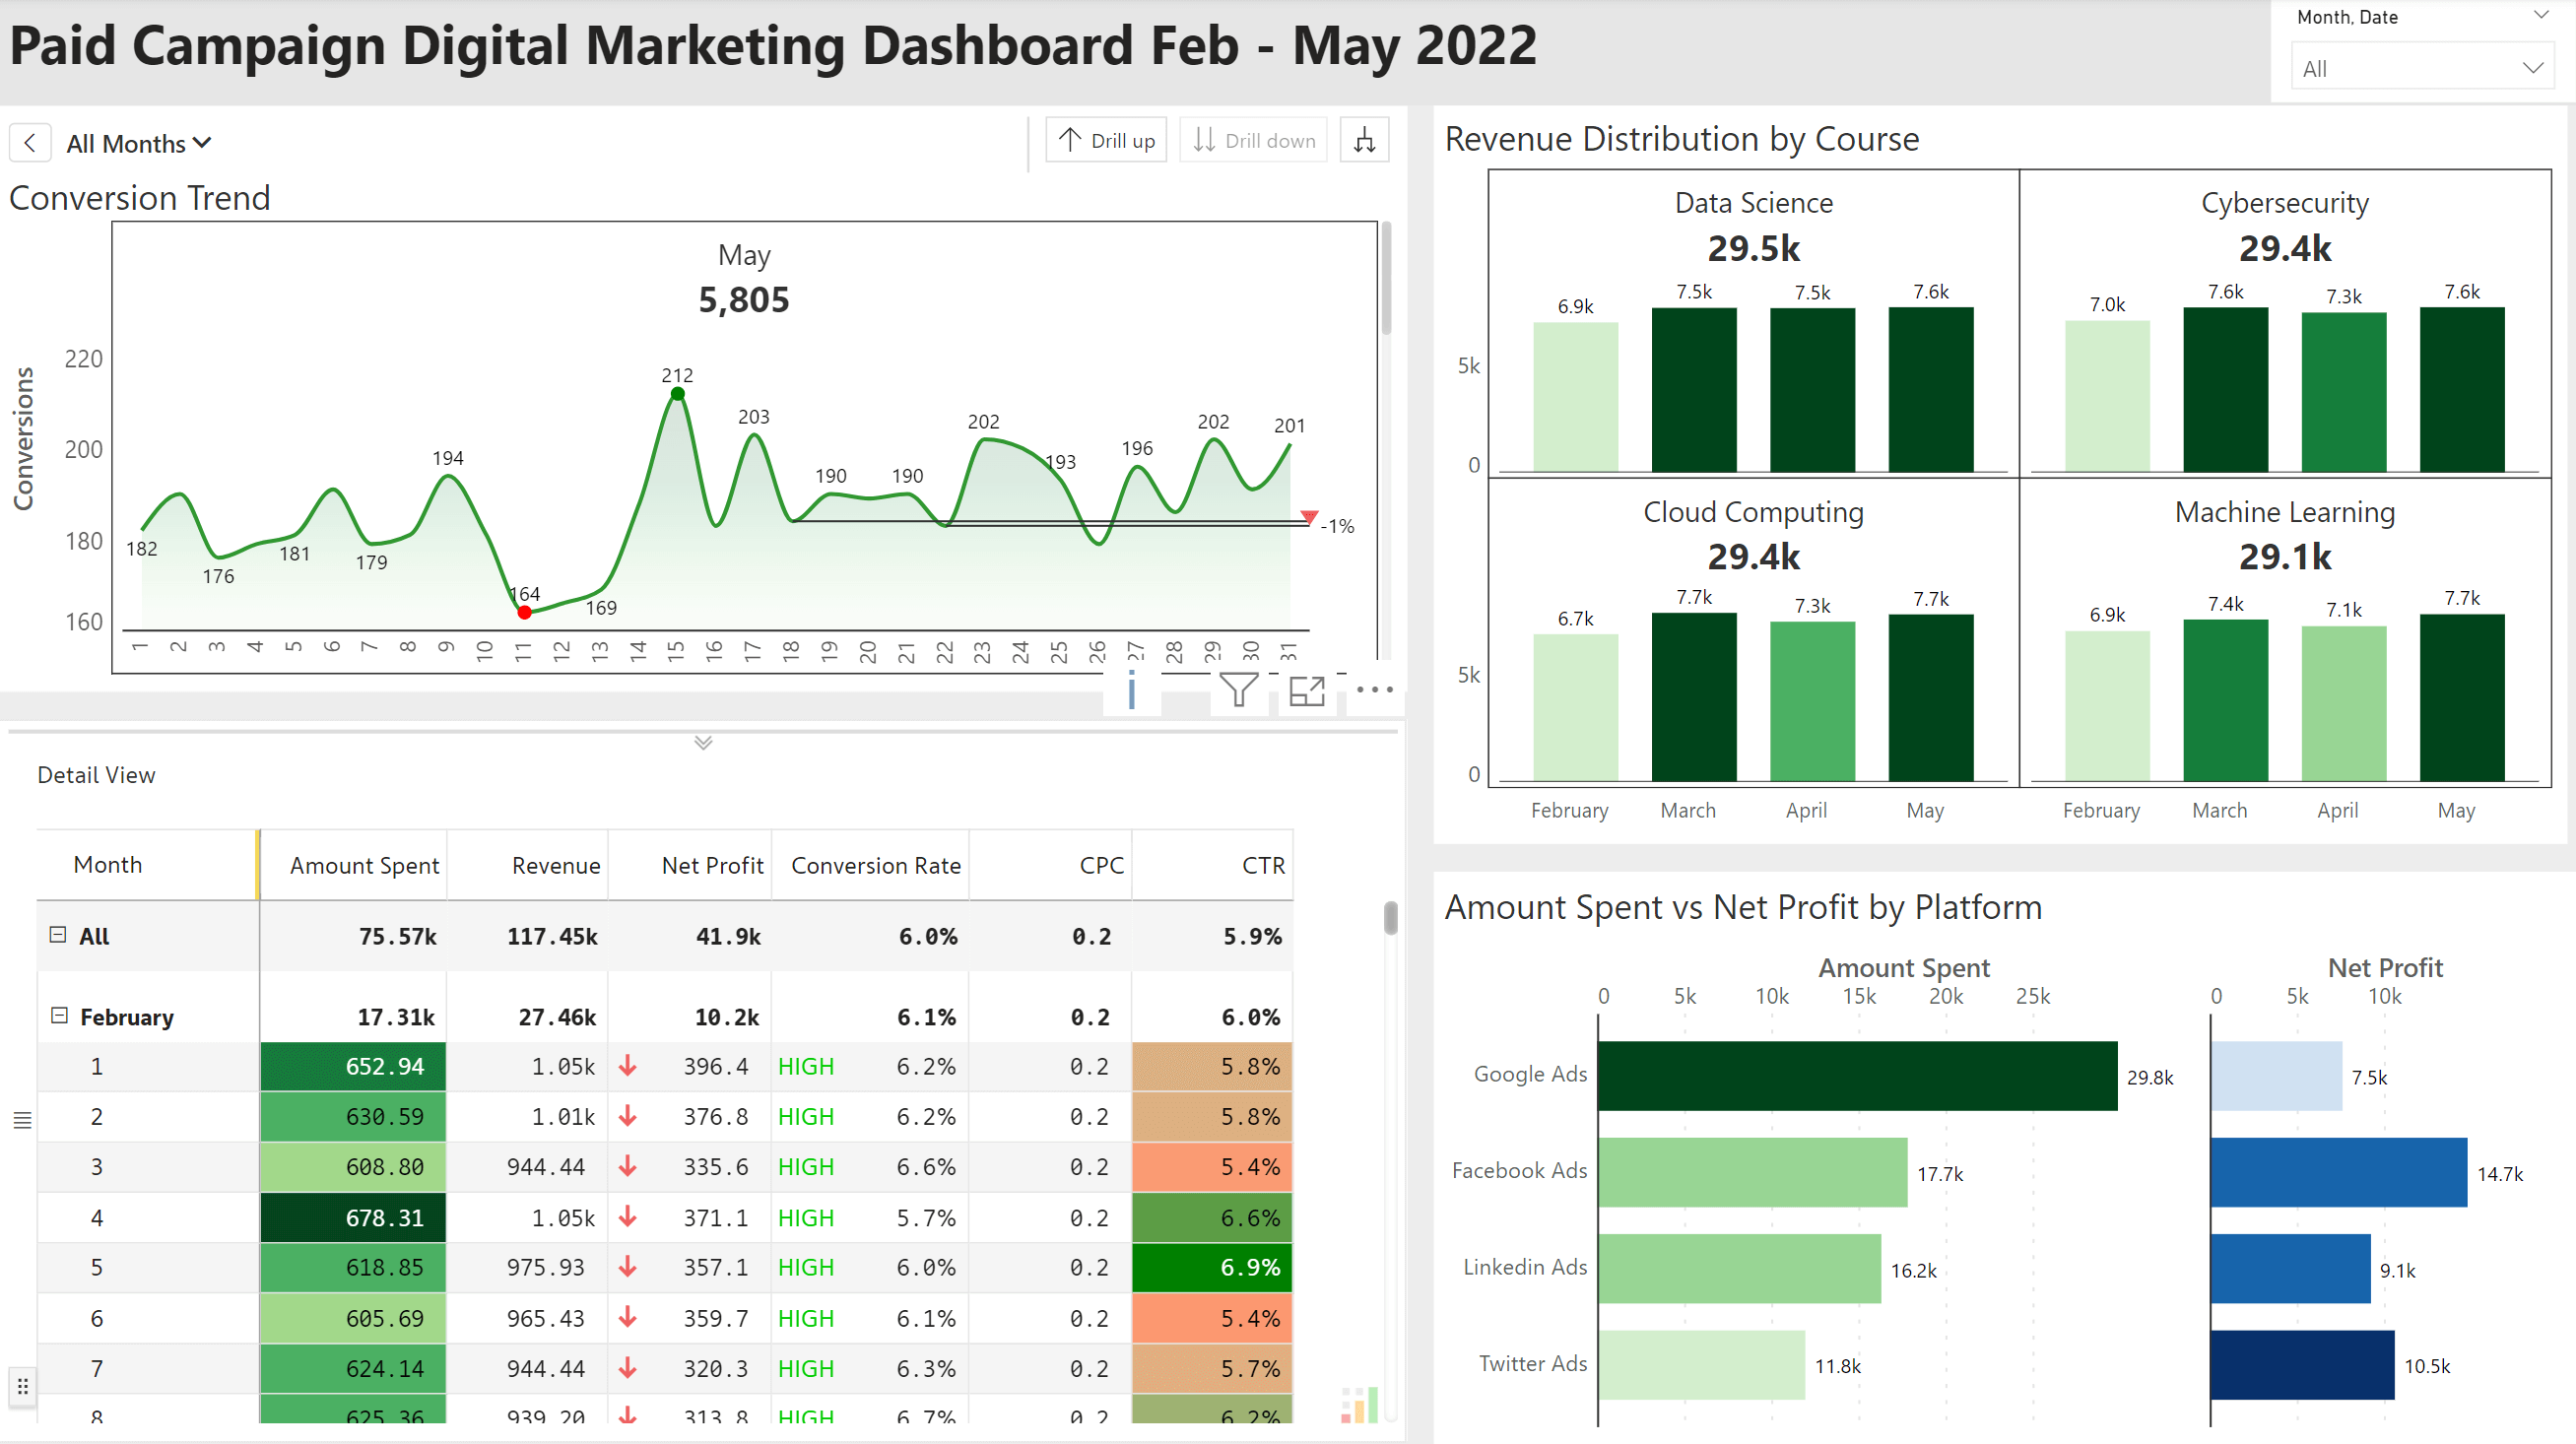
1. Provide a snapshot of marketing performance: As mentioned earlier, marketing metrics can range from website traffic, impressions, clicks, conversions, revenue, cost per conversion and more. An ideal dashboard will provide key performance indicators (KPIs) upfront so that decision-makers receive quick insights for making.

2. Highlight trends and patterns: A good marketing dashboard allows businesses to track marketing metrics over time by highlighting trends and patterns. For example, if website traffic is consistently decreasing, this could be an indication that there is an issue with content generation, relevancy, search engine optimization (SEO), engagement or campaign frequency. By identifying these trends and patterns early on, businesses can adjust their marketing strategy to improve their results. In the following example, the conversion trend can be correlated with specific activities and campaigns to understand the nature and volume of fluctuations, and the seeming slowdown in conversion rate.
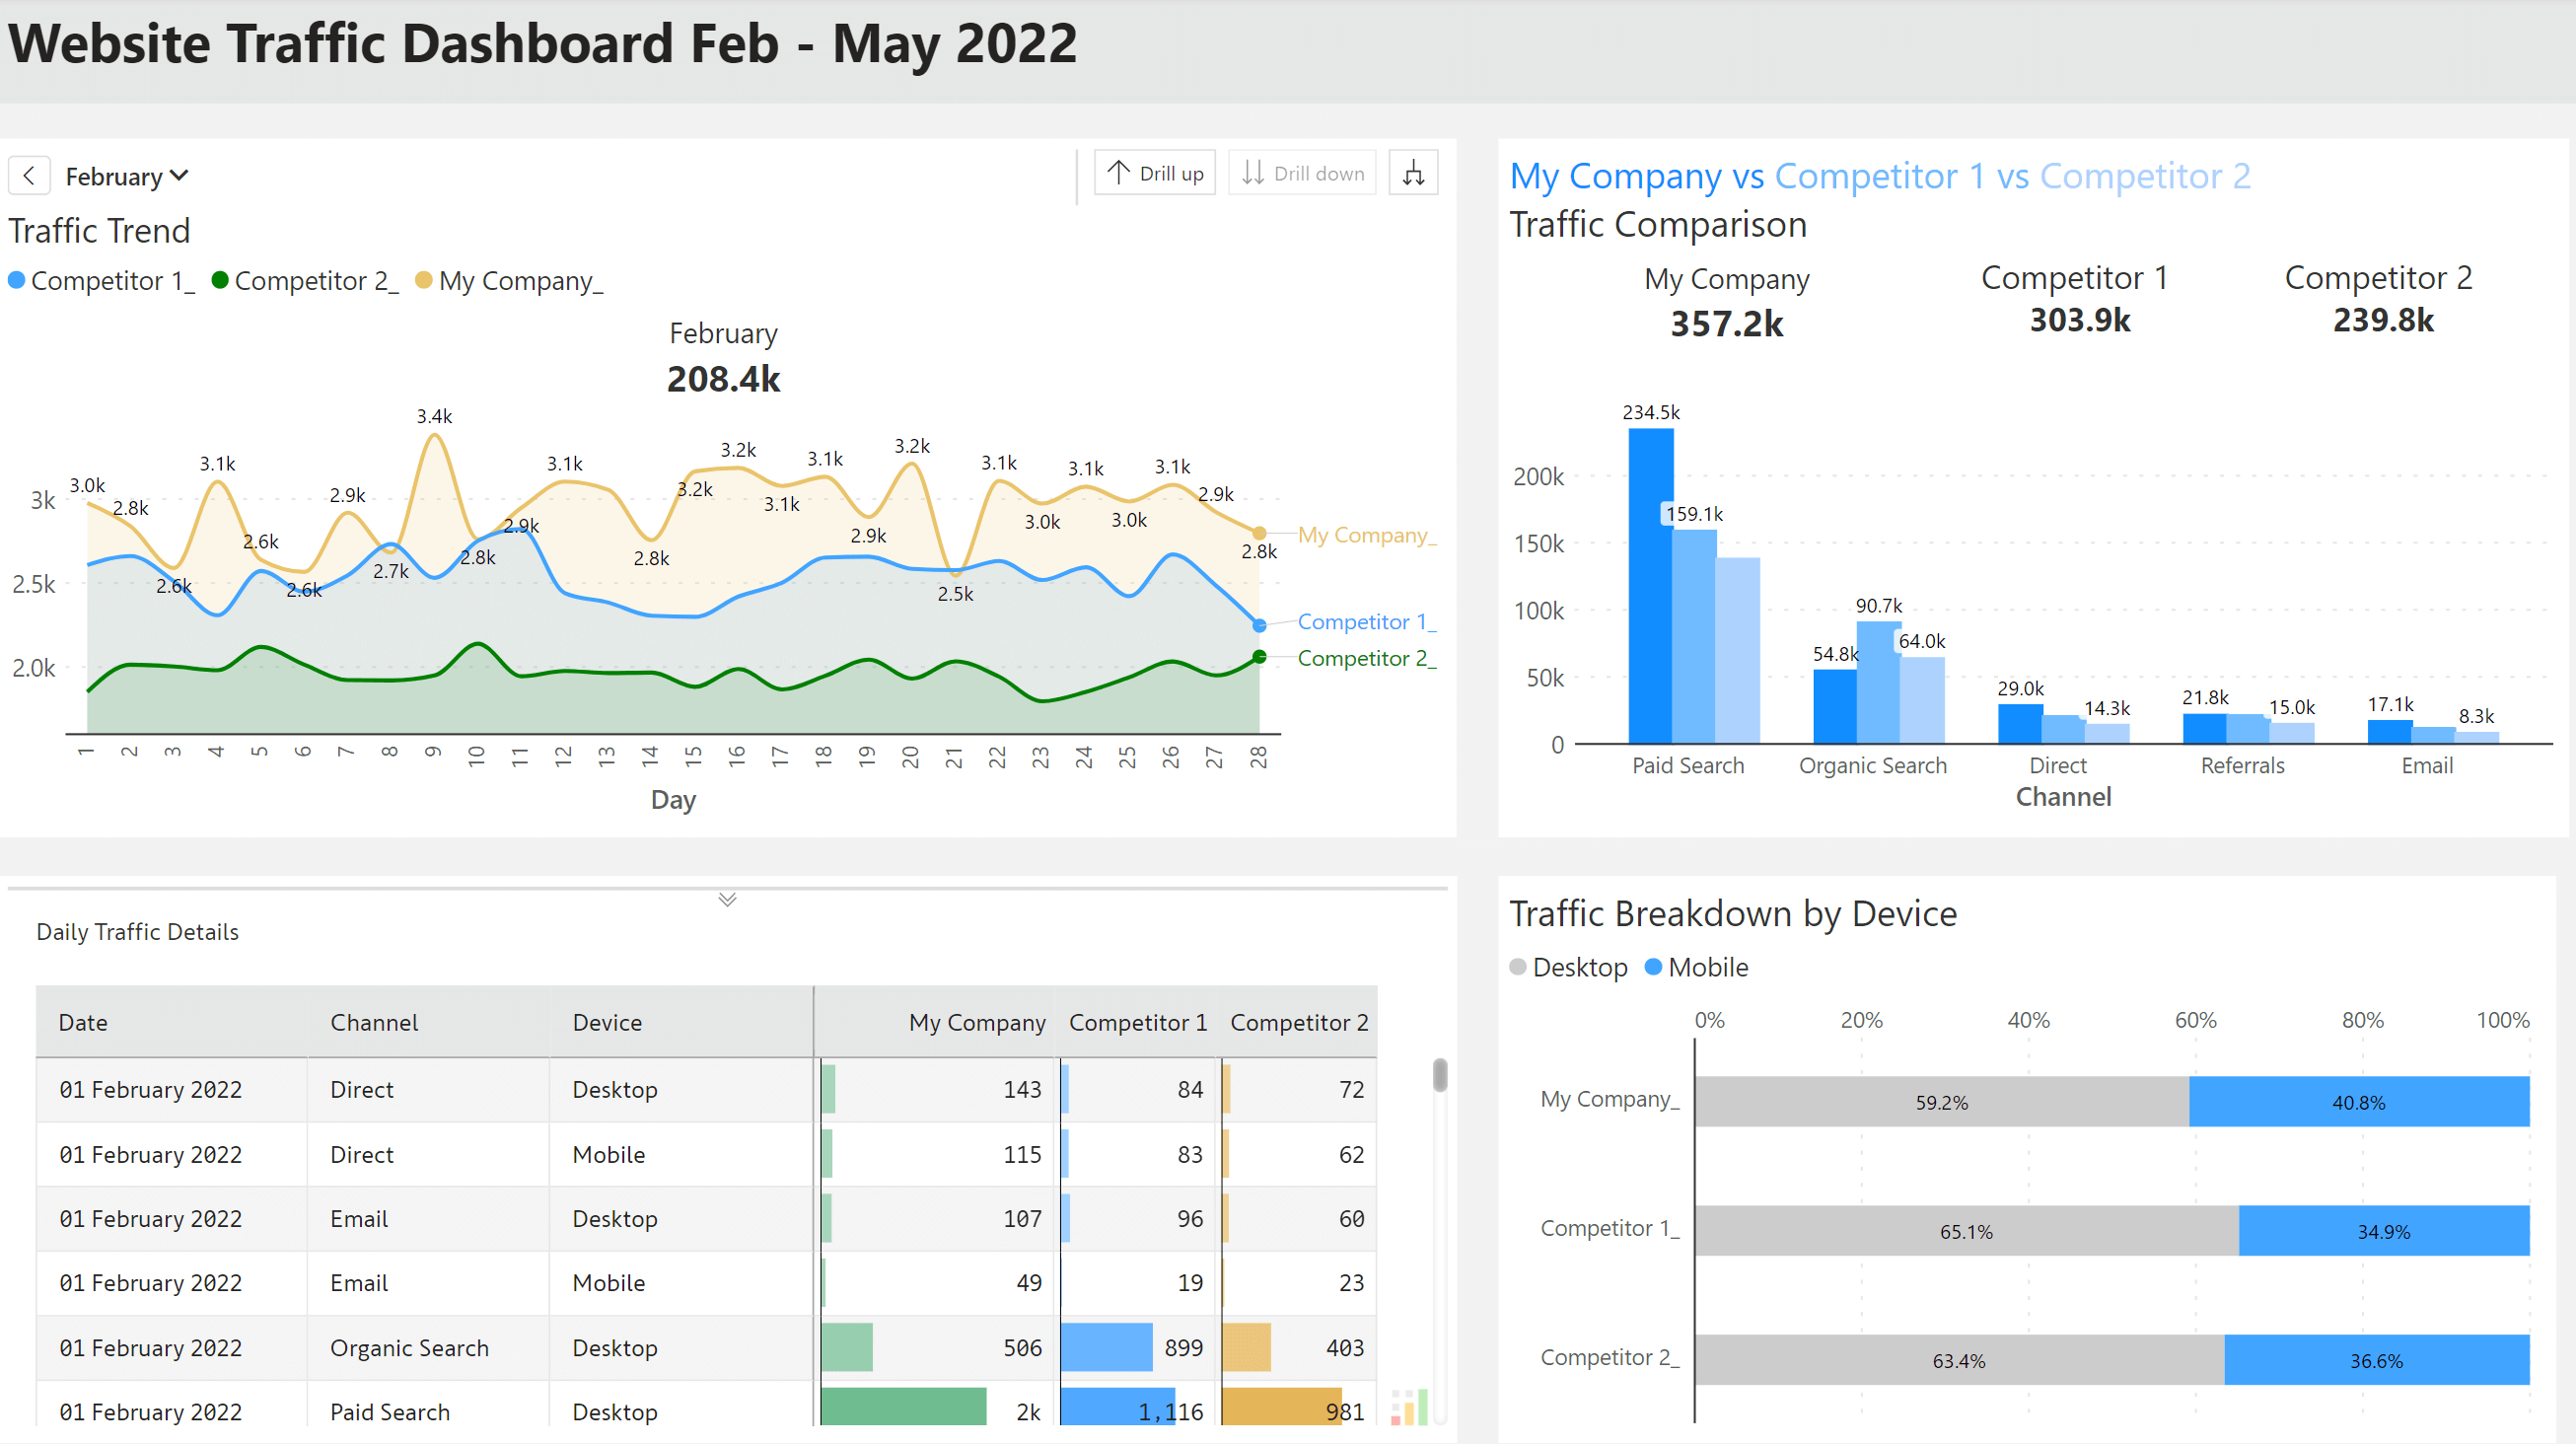
3. Facilitate Competitor Benchmarking: A good way to validate performance of your marketing efforts is to compare and benchmark yourselves with competitors. Benchmarking your metrics such as social media follower count, mentions, website visitors, site authority & domain authority and more can help you identify areas for improvement.
4. Enable real-time monitoring: Real-time monitoring allows businesses to quickly respond to changes in the market or customer behavior, which can help yourselves stay ahead of the competition. This is important when you run campaigns only for a few hours (think on the day of Thanksgiving), as any course-corrections need to be done immediately for better ROI.
5. Improve collaboration and communication: Provide the ability for users to comment, annotate and collaborate at a data level in your marketing dashboards. Tools like Inforiver for Power BI allow your users to securely interact at the data-level.
Some of the terminologies and key metrics used in the dashboard are explained below.
• ROAS: ROAS stands for "Return on Advertising Spend“. ROAS is a metric that measures how much revenue a business generates for each dollar spent on advertising. For example, if a campaign costs $1000 and generates $1500 in revenue, the ROAS would be $1500/ $1000 = $1.5
• Impressions: The number of times an ad is displayed on a digital platform.
• Clicks: The number of times a user clicks on an ad, leading to a visit to the advertiser's website.
• Click-through rate (CTR): The ratio of clicks to impressions, expressed as a percentage. It measures ad performance. For example, if an ad is shown 100 times and receives 5 clicks, the CTR would be 5%.
• Conversion rate: The percentage of users who take a desired action, such as making a purchase or filling out a form, after clicking on an ad. For example, if 100 people visit a website and 4 of them make a purchase, the conversion rate would be 4%.
• Cost per conversion: Cost to acquire one desired action, such as a sale or lead in advertising.
• Cost per click (CPC): The amount of money an advertiser pays for each click on their ad. For example, Let's say you are running a pay-per-click (PPC) campaign on Google Ads, and you have set a maximum CPC bid of $0.50 for a particular keyword. If someone clicks on your ad after searching for that keyword, you will be charged a maximum of $0.50 for that click. So, if 100 people click on your ad, your total cost for those clicks would be $50.
****
Let us explore how Inforiver Analytics+* and Matrix deliver advanced capabilities that have been utilized in the dashboard pictured above.
1. Dynamic deviation: Inforiver Analytics+* allow you to highlight and configure multiple dynamic deviations (both percentage variance as well as absolute variance).

2. Data point and canvas annotations: Inforiver facilitates telling compelling stories using dynamic data-point and canvas annotations. You can deliver additional context regarding the data or highlight select findings for the benefit of your users.

3. Advanced small multiples: Inforiver supports multi-dimensional, multi-measure visualizations. With the advanced small multiples, you can add overall KPIs in each panel, add reference lines & bands, and more.

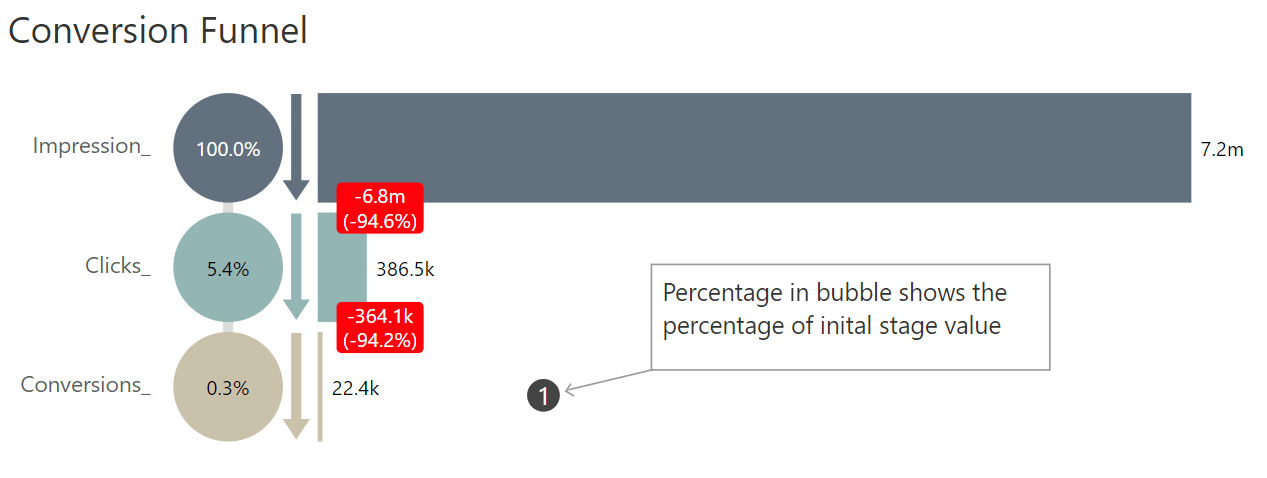
4. Funnel chart: Inforiver offers exclusive visualizations such as advanced funnel to track your pipeline. Compared to a normal funnel chart, the Inforiver chart displays conversion rate with respect to the first stage. E.g. – only 0.3% of overall impressions were converted. The funnel also highlights overall drop-off or abandonment rate in each stage (highlighted in red).
5. Side by side bar chart: Side by side bar chart enables easy comparison of multiple variables at a time. With Inforiver, you can compare up to four (4) measures at a time. In the example below, we are comparing marketing spend vs. net profit.

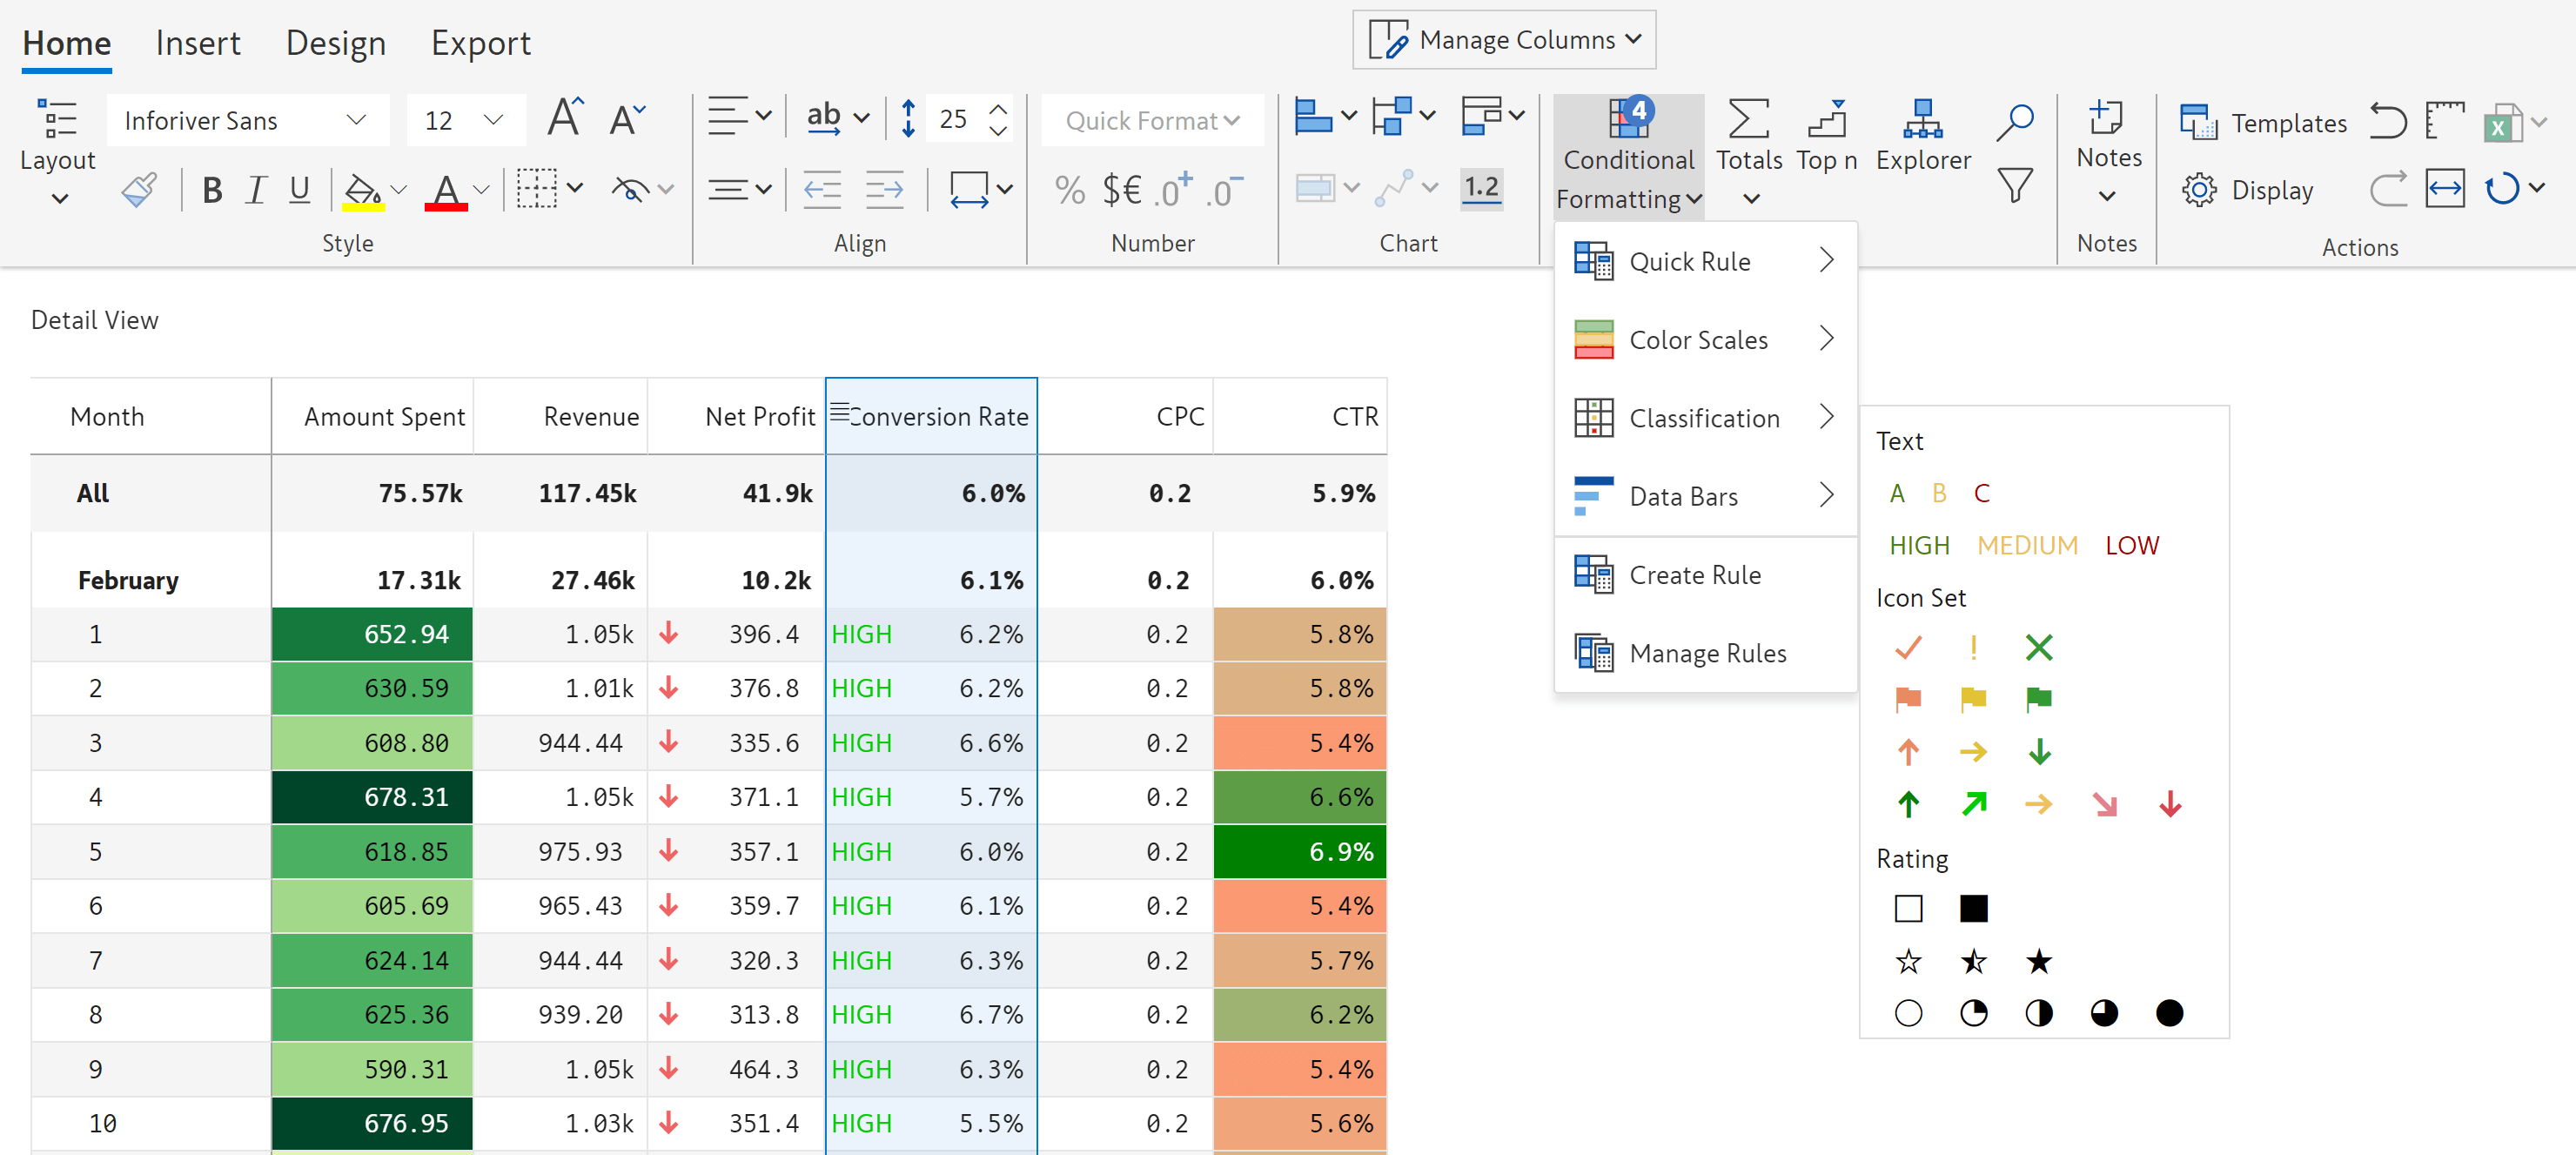
6. One-click conditional formatting: Inforiver offers quick, one-click options such as quick rules, color scales, classification, and data bars. You can also create advanced rules from scratch using nested if-conditions, ranking etc.
Want to try your own marketing dashboard in Power BI? Download Inforiver to kickstart your marketing analytics in Power BI.
To view the interactive marketing dashboard, visit here.
*Inforiver Charts has been renamed to Inforiver Analytics+, a 3-in-1 visual for dashboards and storyboards. It offers 50+ charts, cards, and tables.

Inforiver helps enterprises consolidate planning, reporting & analytics on a single platform (Power BI). The no-code, self-service award-winning platform has been recognized as the industry’s best and is adopted by many Fortune 100 firms.
Inforiver is a product of Lumel, the #1 Power BI AppSource Partner. The firm serves over 3,000 customers worldwide through its portfolio of products offered under the brands Inforiver, EDITable, ValQ, and xViz.


