Upcoming webinar on 'Inforiver Charts : The fastest way to deliver stories in Power BI', Aug 29th , Monday, 10.30 AM CST. Register Now
Upcoming webinar on 'Inforiver Charts : The fastest way to deliver stories in Power BI', Aug 29th , Monday, 10.30 AM CST. Register Now
Inforiver Analytics+ (50+ Charts, Cards and Tables) is a new product offering that delivers dashboards, visualizations and storyboards. Enterprises use Analytics+ to retire their legacy BI & Visualization tools (Tableau, Qlik, Spotfire, SAP Lumira) and static PowerPoint visualization add-ins (Mekko Graphics or Think cell) and migrate to / consolidate these use cases in Power BI.
Here is a quick comparison of Inforiver Analytics+ with some of our other offerings – Inforiver Charts (legacy), Reporting Matrix and xViz Visualization suite:
Inforiver Analytics+ delivers a huge library of basic, advanced and storytelling chart types (50+ as of today, and it will be 75+ by end of 2024), cards and tables in a single visual. It is a lot easier for large enterprises to train, deploy and manage a single, all-encompassing visual using Analytics+ than two dozen visuals in their Power BI platform / visualization pane and each one of them having their own feature set and UI/UX.
Inforiver Analytics+ will soon help enterprises to build beautiful multi-visual dashboards and storyboards in under 5 minutes using a single query and a single visual. The reading view experience will also bring a much-awaited pivot-data-style exploration mode that incorporates high interactivity, personalization and self-exploration capabilities, which casual users have come to love in products such as Qlik and Spotfire.
In most cases Analytics+ would also deliver a substantial performance boost (Because of single component & single query architecture) and premium capacity consumption cost savings as it does reduce the number of query calls to the model and for most part will use your browser computing power.
1. With immediate effect, we are suspending developer-based subscription plans from AppSource – for the reasons outlined in detail.
However, we will grandfather all existing customers who are already on this plan until they are ready to add more users and transition to the named-user pricing model.
2. The domain-wide unlimited user pricing will now be a simple offline calculation based on your company size and Power BI user base. In essence we are moving from a flat public price for companies of all sizes – to a negotiated, offline annual quote that can vary by company size. This domain-wide, unlimited user option helps organizations eliminate license management hassles. They also avoid scenarios where they are looking for mid-year approvals to handle a spike in usage & adoption.
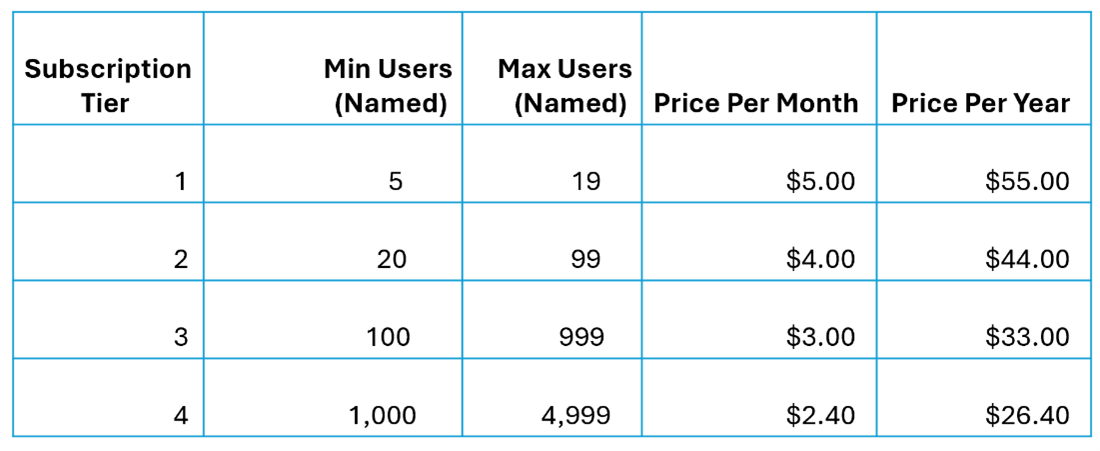
3. Here is the new proposed tiered pricing for Analytics + as of the date of this article, where only the Tier 4 pricing has changed slightly.
4. The pricing for On-Prem report Server or Publish to Web (PaaS) non-commercial embedded use cases with no user-context will now be $4,995 per annum per creator/publisher. They will also gain full reading view active interactivity as well in lieu of the current reading view only offers just sort and export capabilities like native visuals.
If you are a current Inforiver customer on a developer-based, unlimited viewer licensing plan, we strongly encourage you to reach out to us to explore options for migrating to a private plan in AppSource or to a domain-wide subscription plan. Otherwise, you can keep your old subscription plan in AppSource as is.
Have any questions? Reach out to us to learn more.

Inforiver helps enterprises consolidate planning, reporting & analytics on a single platform (Power BI). The no-code, self-service award-winning platform has been recognized as the industry’s best and is adopted by many Fortune 100 firms.
Inforiver is a product of Lumel, the #1 Power BI AppSource Partner. The firm serves over 3,000 customers worldwide through its portfolio of products offered under the brands Inforiver, EDITable, ValQ, and xViz.